Races in Newnan, Georgia (GA) Detailed Stats
Data:
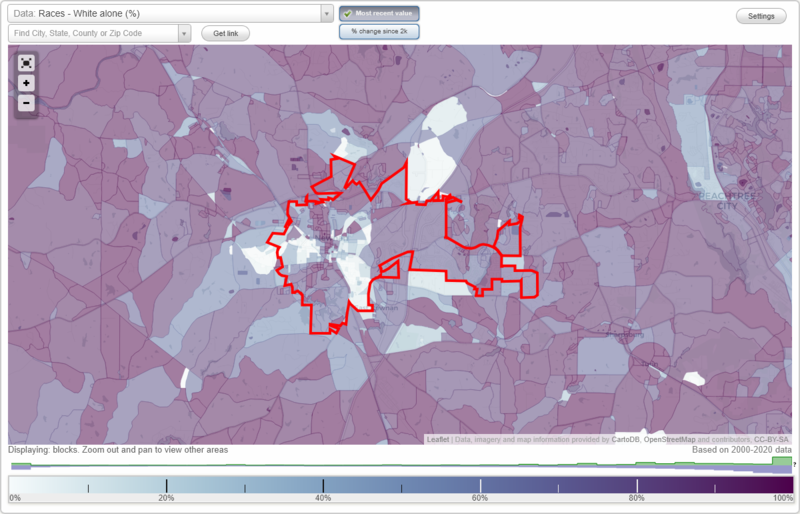
Races - White alone (%)
Races - White alone (% change since 2000)
Races - Black alone (%)
Races - Black alone (% change since 2000)
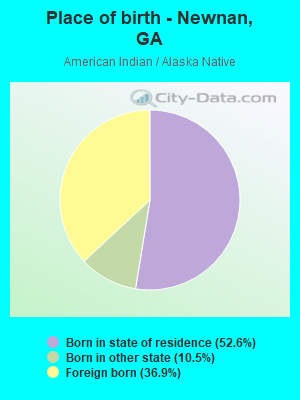
Races - American Indian alone (%)
Races - American Indian alone (% change since 2000)
Races - Asian alone (%)
Races - Asian alone (% change since 2000)
Races - Hispanic (%)
Races - Hispanic (% change since 2000)
Races - Native Hawaiian and Other Pacific Islander alone (%)
Races - Native Hawaiian and Other Pacific Islander alone (% change since 2000)
Races - Two or more races(%)
Races - Two or more races(% change since 2000)
Races - Other race alone (%)
Races - Other race alone (% change since 2000)
Racial diversity
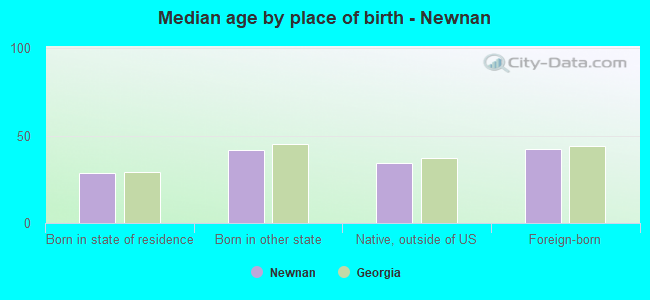
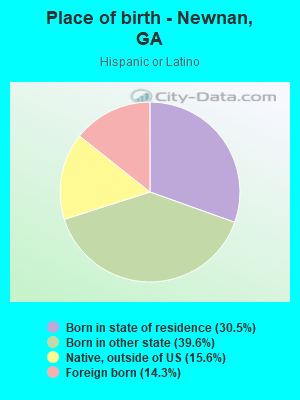
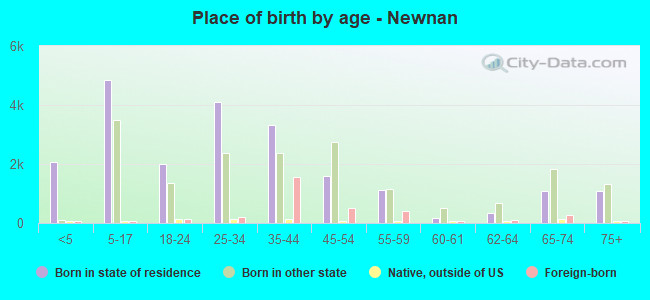
Place of birth - Born in state of residence (%)
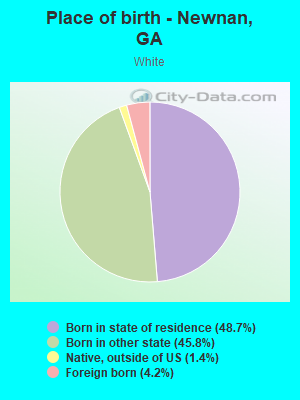
Place of birth - Born in state of residence (%) - White
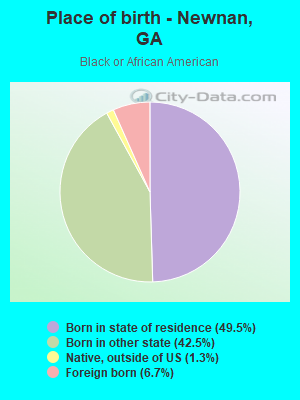
Place of birth - Born in state of residence (%) - Black or African American
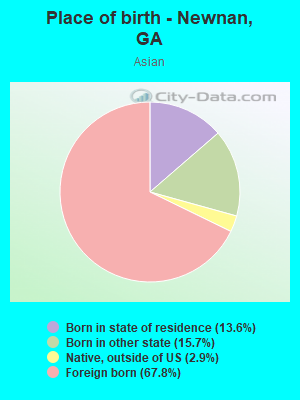
Place of birth - Born in state of residence (%) - Asian
Place of birth - Born in state of residence (%) - Hispanic or Latino
Place of birth - Born in state of residence (%) - American Indian and Alaska Native
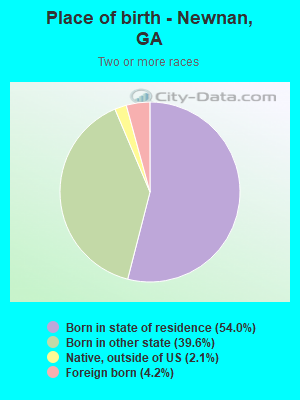
Place of birth - Born in state of residence (%) - Multirace
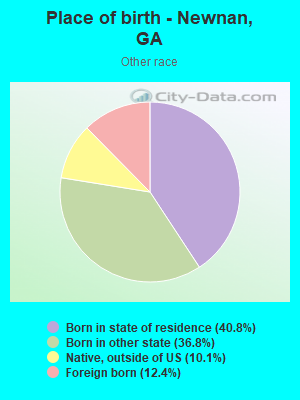
Place of birth - Born in state of residence (%) - Other Race
Place of birth - Born in other state (%)
Place of birth - Born in other state (%) - White
Place of birth - Born in other state (%) - Black or African American
Place of birth - Born in other state (%) - Asian
Place of birth - Born in other state (%) - Hispanic or Latino
Place of birth - Born in other state (%) - American Indian and Alaska Native
Place of birth - Born in other state (%) - Multirace
Place of birth - Born in other state (%) - Other Race
Place of birth - Native, outside of US (%)
Place of birth - Native, outside of US (%) - White
Place of birth - Native, outside of US (%) - Black or African American
Place of birth - Native, outside of US (%) - Asian
Place of birth - Native, outside of US (%) - Hispanic or Latino
Place of birth - Native, outside of US (%) - American Indian and Alaska Native
Place of birth - Native, outside of US (%) - Multirace
Place of birth - Native, outside of US (%) - Other Race
Place of birth - Foreign born (%)
Place of birth - Foreign born (%) - White
Place of birth - Foreign born (%) - Black or African American
Place of birth - Foreign born (%) - Asian
Place of birth - Foreign born (%) - Hispanic or Latino
Place of birth - Foreign born (%) - American Indian and Alaska Native
Place of birth - Foreign born (%) - Multirace
Place of birth - Foreign born (%) - Other Race
Residents speaking English at home (%)
Residents speaking English at home - Born in the United States (%)
Residents speaking English at home - Native, born elsewhere (%)
Residents speaking English at home - Foreign born (%)
Residents speaking Spanish at home (%)
Residents speaking Spanish at home - Born in the United States (%)
Residents speaking Spanish at home - Native, born elsewhere (%)
Residents speaking Spanish at home - Foreign born (%)
Residents speaking other language at home (%)
Residents speaking other language at home - Born in the United States (%)
Residents speaking other language at home - Native, born elsewhere (%)
Residents speaking other language at home - Foreign born (%)
Marital status - Never married (%)
Marital status - Now married (%)
Marital status - Separated (%)
Marital status - Widowed (%)
Marital status - Divorced (%)
Ancestries Reported - Arab (%)
Ancestries Reported - Czech (%)
Ancestries Reported - Danish (%)
Ancestries Reported - Dutch (%)
Ancestries Reported - English (%)
Ancestries Reported - French (%)
Ancestries Reported - French Canadian (%)
Ancestries Reported - German (%)
Ancestries Reported - Greek (%)
Ancestries Reported - Hungarian (%)
Ancestries Reported - Irish (%)
Ancestries Reported - Italian (%)
Ancestries Reported - Lithuanian (%)
Ancestries Reported - Norwegian (%)
Ancestries Reported - Polish (%)
Ancestries Reported - Portuguese (%)
Ancestries Reported - Russian (%)
Ancestries Reported - Scotch-Irish (%)
Ancestries Reported - Scottish (%)
Ancestries Reported - Slovak (%)
Ancestries Reported - Subsaharan African (%)
Ancestries Reported - Swedish (%)
Ancestries Reported - Swiss (%)
Ancestries Reported - Ukrainian (%)
Ancestries Reported - United States (%)
Ancestries Reported - Welsh (%)
Ancestries Reported - West Indian (%)
Ancestries Reported - Other (%)
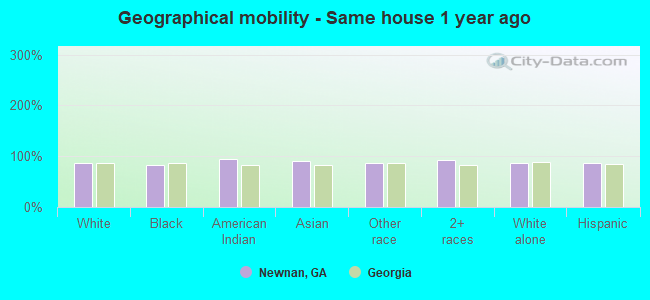
Geographical mobility - Same house 1 year ago (%)
Geographical mobility - Same house 1 year ago (%) - White
Geographical mobility - Same house 1 year ago (%) - Black or African American
Geographical mobility - Same house 1 year ago (%) - Asian
Geographical mobility - Same house 1 year ago (%) - Hispanic or Latino
Geographical mobility - Same house 1 year ago (%) - American Indian and Alaska Native
Geographical mobility - Same house 1 year ago (%) - Multirace
Geographical mobility - Same house 1 year ago (%) - Other Race
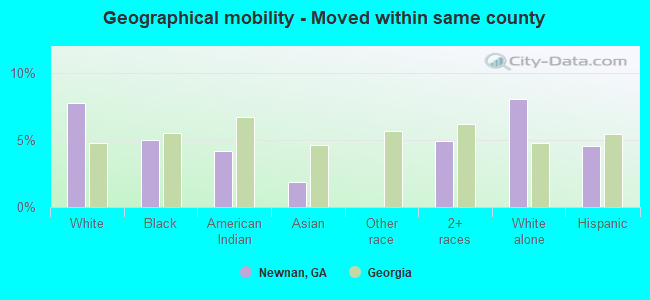
Geographical mobility - Moved within same county (%)
Geographical mobility - Moved within same county (%) - White
Geographical mobility - Moved within same county (%) - Black or African American
Geographical mobility - Moved within same county (%) - Asian
Geographical mobility - Moved within same county (%) - Hispanic or Latino
Geographical mobility - Moved within same county (%) - American Indian and Alaska Native
Geographical mobility - Moved within same county (%) - Multirace
Geographical mobility - Moved within same county (%) - Other Race
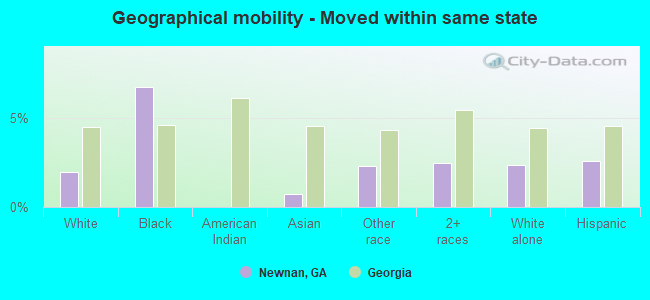
Geographical mobility - Moved from different county within same state (%)
Geographical mobility - Moved from different county within same state (%) - White
Geographical mobility - Moved from different county within same state (%) - Black or African American
Geographical mobility - Moved from different county within same state (%) - Asian
Geographical mobility - Moved from different county within same state (%) - Hispanic or Latino
Geographical mobility - Moved from different county within same state (%) - American Indian and Alaska Native
Geographical mobility - Moved from different county within same state (%) - Multirace
Geographical mobility - Moved from different county within same state (%) - Other Race
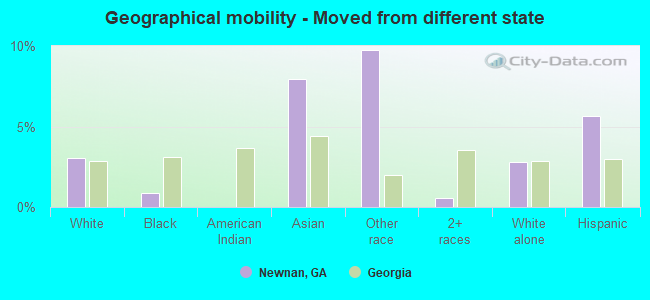
Geographical mobility - Moved from different state (%)
Geographical mobility - Moved from different state (%) - White
Geographical mobility - Moved from different state (%) - Black or African American
Geographical mobility - Moved from different state (%) - Asian
Geographical mobility - Moved from different state (%) - Hispanic or Latino
Geographical mobility - Moved from different state (%) - American Indian and Alaska Native
Geographical mobility - Moved from different state (%) - Multirace
Geographical mobility - Moved from different state (%) - Other Race
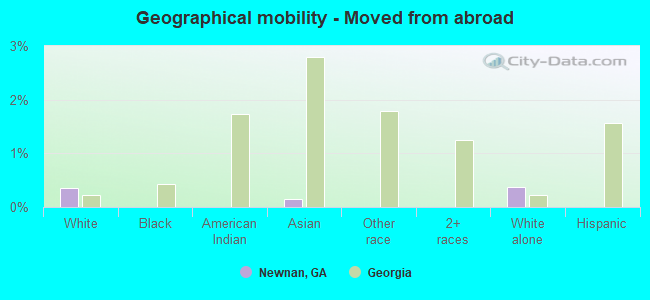
Geographical mobility - Moved from abroad (%)
Geographical mobility - Moved from abroad (%) - White
Geographical mobility - Moved from abroad (%) - Black or African American
Geographical mobility - Moved from abroad (%) - Asian
Geographical mobility - Moved from abroad (%) - Hispanic or Latino
Geographical mobility - Moved from abroad (%) - American Indian and Alaska Native
Geographical mobility - Moved from abroad (%) - Multirace
Geographical mobility - Moved from abroad (%) - Other Race
Place of birth for the foreign-born population - Ireland (%)
Place of birth for the foreign-born population - Denmark (%)
Place of birth for the foreign-born population - Norway (%)
Place of birth for the foreign-born population - Sweden (%)
Place of birth for the foreign-born population - United Kingdom (%)
Place of birth for the foreign-born population - England (%)
Place of birth for the foreign-born population - Scotland (%)
Place of birth for the foreign-born population - Other Northern Europe (%)
Place of birth for the foreign-born population - Austria (%)
Place of birth for the foreign-born population - Belgium (%)
Place of birth for the foreign-born population - France (%)
Place of birth for the foreign-born population - Germany (%)
Place of birth for the foreign-born population - Netherlands (%)
Place of birth for the foreign-born population - Switzerland (%)
Place of birth for the foreign-born population - Other Western Europe (%)
Place of birth for the foreign-born population - Greece (%)
Place of birth for the foreign-born population - Italy (%)
Place of birth for the foreign-born population - Portugal (%)
Place of birth for the foreign-born population - Spain (%)
Place of birth for the foreign-born population - Other Southern Europe (%)
Place of birth for the foreign-born population - Albania (%)
Place of birth for the foreign-born population - Belarus (%)
Place of birth for the foreign-born population - Bosnia and Herzegovina (%)
Place of birth for the foreign-born population - Bulgaria (%)
Place of birth for the foreign-born population - Croatia (%)
Place of birth for the foreign-born population - Czechoslovakia (%)
Place of birth for the foreign-born population - Hungary (%)
Place of birth for the foreign-born population - Latvia (%)
Place of birth for the foreign-born population - Lithuania (%)
Place of birth for the foreign-born population - North Macedonia (Macedonia) (%)
Place of birth for the foreign-born population - Moldova (%)
Place of birth for the foreign-born population - Poland (%)
Place of birth for the foreign-born population - Romania (%)
Place of birth for the foreign-born population - Russia (%)
Place of birth for the foreign-born population - Serbia (%)
Place of birth for the foreign-born population - Ukraine (%)
Place of birth for the foreign-born population - Other Eastern Europe (%)
Place of birth for the foreign-born population - China (%)
Place of birth for the foreign-born population - Hong Kong (%)
Place of birth for the foreign-born population - Taiwan (%)
Place of birth for the foreign-born population - Japan (%)
Place of birth for the foreign-born population - Korea (%)
Place of birth for the foreign-born population - Other Eastern Asia (%)
Place of birth for the foreign-born population - Afghanistan (%)
Place of birth for the foreign-born population - Bangladesh (%)
Place of birth for the foreign-born population - India (%)
Place of birth for the foreign-born population - Iran (%)
Place of birth for the foreign-born population - Kazakhstan (%)
Place of birth for the foreign-born population - Nepal (%)
Place of birth for the foreign-born population - Pakistan (%)
Place of birth for the foreign-born population - Sri Lanka (%)
Place of birth for the foreign-born population - Uzbekistan (%)
Place of birth for the foreign-born population - Other South Central Asia (%)
Place of birth for the foreign-born population - Burma (%)
Place of birth for the foreign-born population - Cambodia (%)
Place of birth for the foreign-born population - Indonesia (%)
Place of birth for the foreign-born population - Laos (%)
Place of birth for the foreign-born population - Malaysia (%)
Place of birth for the foreign-born population - Philippines (%)
Place of birth for the foreign-born population - Singapore (%)
Place of birth for the foreign-born population - Thailand (%)
Place of birth for the foreign-born population - Vietnam (%)
Place of birth for the foreign-born population - Other South Eastern Asia (%)
Place of birth for the foreign-born population - Armenia (%)
Place of birth for the foreign-born population - Iraq (%)
Place of birth for the foreign-born population - Israel (%)
Place of birth for the foreign-born population - Jordan (%)
Place of birth for the foreign-born population - Kuwait (%)
Place of birth for the foreign-born population - Lebanon (%)
Place of birth for the foreign-born population - Saudi Arabia (%)
Place of birth for the foreign-born population - Syria (%)
Place of birth for the foreign-born population - Turkey (%)
Place of birth for the foreign-born population - Yemen (%)
Place of birth for the foreign-born population - Other Western Asia (%)
Place of birth for the foreign-born population - Eritrea (%)
Place of birth for the foreign-born population - Ethiopia (%)
Place of birth for the foreign-born population - Kenya (%)
Place of birth for the foreign-born population - Somalia (%)
Place of birth for the foreign-born population - Uganda (%)
Place of birth for the foreign-born population - Zimbabwe (%)
Place of birth for the foreign-born population - Other Eastern Africa (%)
Place of birth for the foreign-born population - Cameroon (%)
Place of birth for the foreign-born population - Congo (%)
Place of birth for the foreign-born population - Democratic Republic of Congo (Zaire) (%)
Place of birth for the foreign-born population - Other Middle Africa (%)
Place of birth for the foreign-born population - Egypt (%)
Place of birth for the foreign-born population - Morocco (%)
Place of birth for the foreign-born population - Sudan (%)
Place of birth for the foreign-born population - Other Northern Africa (%)
Place of birth for the foreign-born population - South Africa (%)
Place of birth for the foreign-born population - Other Southern Africa (%)
Place of birth for the foreign-born population - Cabo Verde (%)
Place of birth for the foreign-born population - Ghana (%)
Place of birth for the foreign-born population - Liberia (%)
Place of birth for the foreign-born population - Nigeria (%)
Place of birth for the foreign-born population - Senegal (%)
Place of birth for the foreign-born population - Sierra Leone (%)
Place of birth for the foreign-born population - Other Western Africa (%)
Place of birth for the foreign-born population - Australia (%)
Place of birth for the foreign-born population - New Zealand (%)
Place of birth for the foreign-born population - Fiji (%)
Place of birth for the foreign-born population - Micronesia (%)
Place of birth for the foreign-born population - Bahamas (%)
Place of birth for the foreign-born population - Barbados (%)
Place of birth for the foreign-born population - Cuba (%)
Place of birth for the foreign-born population - Dominica (%)
Place of birth for the foreign-born population - Dominican Republic (%)
Place of birth for the foreign-born population - Grenada (%)
Place of birth for the foreign-born population - Haiti (%)
Place of birth for the foreign-born population - Jamaica (%)
Place of birth for the foreign-born population - St. Vincent and the Grenadines (%)
Place of birth for the foreign-born population - Trinidad and Tobago (%)
Place of birth for the foreign-born population - West Indies (%)
Place of birth for the foreign-born population - Other Caribbean (%)
Place of birth for the foreign-born population - Belize (%)
Place of birth for the foreign-born population - Costa Rica (%)
Place of birth for the foreign-born population - El Salvador (%)
Place of birth for the foreign-born population - Guatemala (%)
Place of birth for the foreign-born population - Honduras (%)
Place of birth for the foreign-born population - Mexico (%)
Place of birth for the foreign-born population - Nicaragua (%)
Place of birth for the foreign-born population - Panama (%)
Place of birth for the foreign-born population - Other Central America (%)
Place of birth for the foreign-born population - Argentina (%)
Place of birth for the foreign-born population - Bolivia (%)
Place of birth for the foreign-born population - Brazil (%)
Place of birth for the foreign-born population - Chile (%)
Place of birth for the foreign-born population - Colombia (%)
Place of birth for the foreign-born population - Ecuador (%)
Place of birth for the foreign-born population - Guyana (%)
Place of birth for the foreign-born population - Peru (%)
Place of birth for the foreign-born population - Uruguay (%)
Place of birth for the foreign-born population - Venezuela (%)
Place of birth for the foreign-born population - Other South America (%)
Place of birth for the foreign-born population - Canada (%)
Place of birth for the foreign-born population - Other Northern America (%)
Place of birth for the foreign-born population - Other (%)
Latest news about races in Newnan, GA collected exclusively by city-data.com from local newspapers, TV, and radio stations
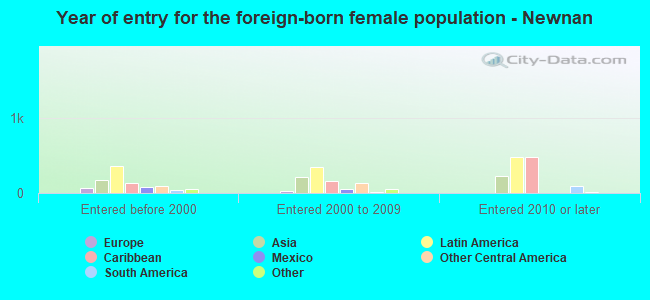
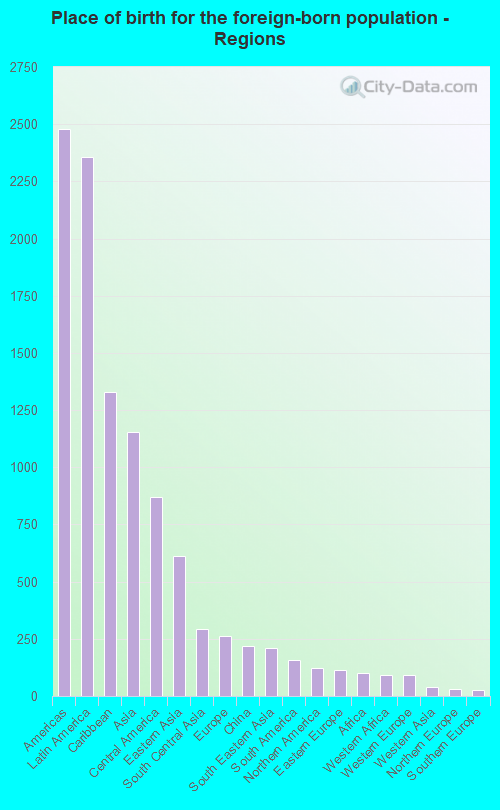
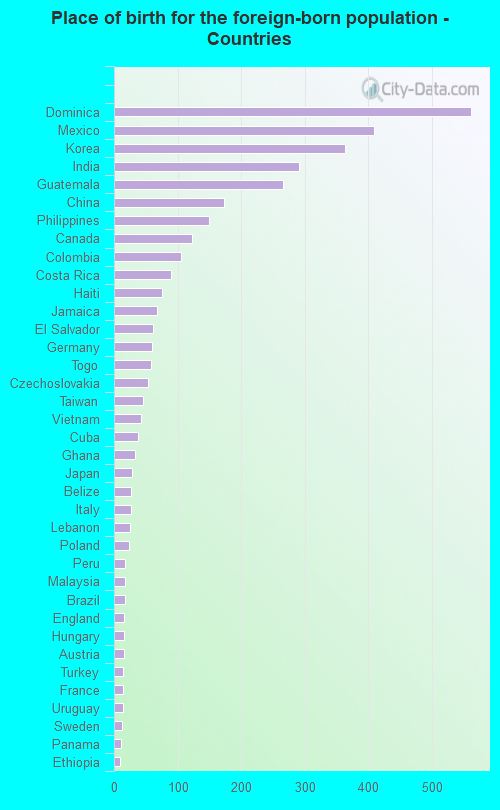
According to 2022 data, the most numerous races in Newnan, GA are White alone (21,208 residents), Black alone (13,851 residents), and Hispanic (3,914 residents). 88.0% of Newnan residents speak English at home. 9.0% of Newnan, GA residents are foreign-born (5.3% born in Latin America, 2.6% born in Asia), which is 10.6% less than the foreign-born rate of 10.0% across the entire state of Georgia.
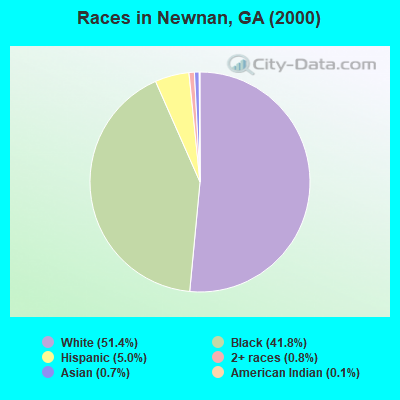
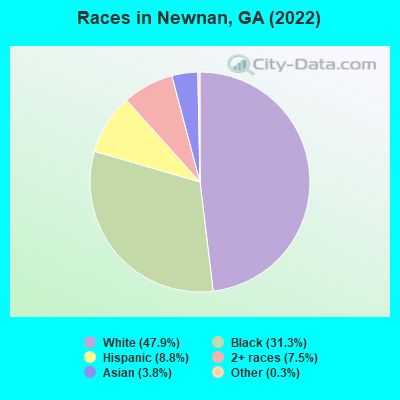
Race distribution in Newnan
2000 2022
5,128,661 62.6% White alone 2,331,465 28.5% Black alone 435,227 5.3% Hispanic 171,513 2.1% Asian alone 87,364 1.1% Two or more races 17,670 0.2% American Indian alone 11,275 0.1% Other race alone 3,278 0.04% Native Hawaiian and Other
5,415,657 49.6% White alone 3,349,240 30.7% Black alone 1,132,604 10.4% Hispanic 479,156 4.4% Asian alone 462,923 4.2% Two or more races 54,416 0.5% Other race alone 11,923 0.1% American Indian alone 6,957 0.06% Native Hawaiian and Other
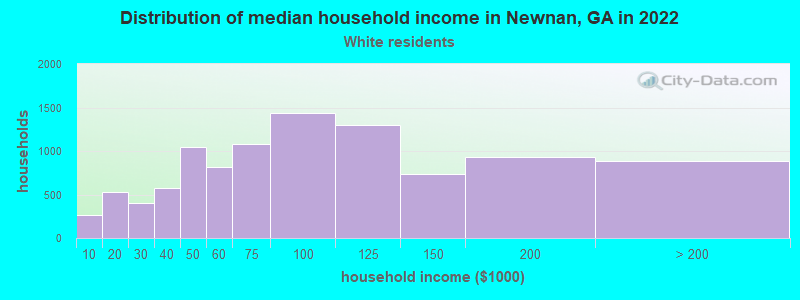
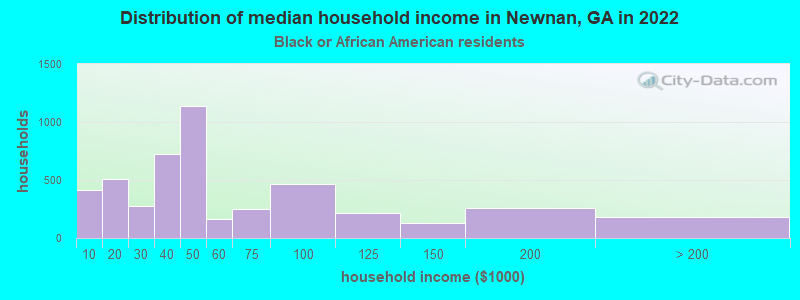
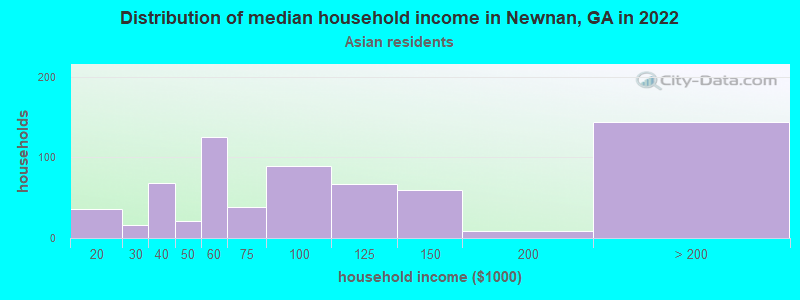
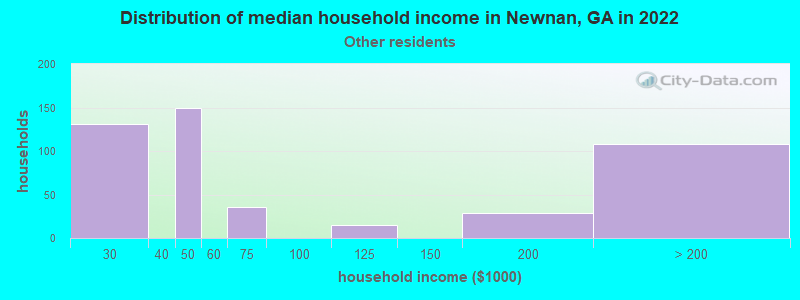
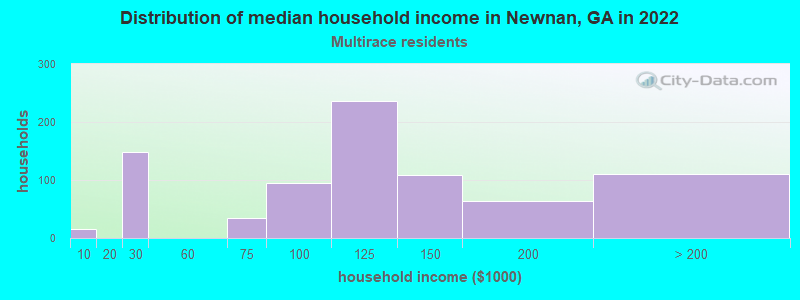
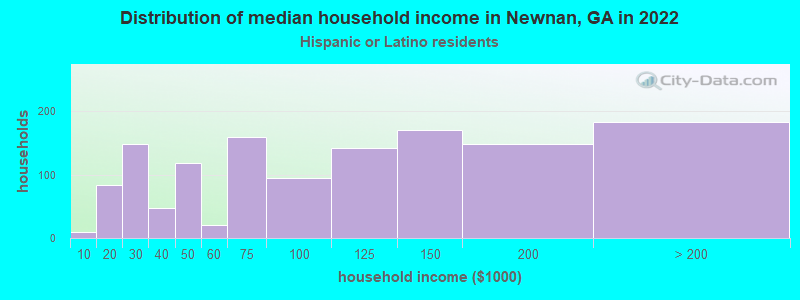
Income and house value in Newnan Median household income in 2022 $80,831 White non-Hispanic householders$37,279 Black householders$99,917 Asian householders$44,052 Some other race householders$85,525 Two or more races householders$73,122 Hispanic or Latino race householdersMedian 2022 house value $404,709 White Non-Hispanic householders$210,666 Black or African American householders $468,181 Asian householders$256,910 Two or more races householders$396,850 Hispanic or Latino householders
Median age by race in Newnan
38.8 Median age for White residents37.8 40.2 33.2 Median age for Black or African American residents28.8 35.7 53.9 Median age for American Indian / Alaska Native residents-683,886,838.2 56.6 33.7 Median age for Asian residents39.8 29.4 -666,666,666.0 Median age for Native Hawaiian / Pacific Islander residents-666,666,666.0 -666,666,666.0 24.8 Median age for Other race residents26.2 24.5 17.9 Median age for Two or more races residents23.8 14.3 39.2 Median age for White alone residents38.2 41.0 31.0 Median age for Hispanic or Latino residents32.9 30.8
Owner/renter occupied households by race in Newnan
House owners and renters - White residents 7,104 73.2% Owner occupied2,603 26.8% Renter occupiedHouse owners and renters - Black or African American residents 1,148 21.6% Owner occupied4,179 78.4% Renter occupiedHouse owners and renters - American Indian / Alaska Native residents 10 100.0% Owner occupiedHouse owners and renters - Asian residents 485 73.2% Owner occupied178 26.8% Renter occupiedHouse owners and renters - Other race residents 168 37.1% Owner occupied285 62.9% Renter occupiedHouse owners and renters - Two or more races residents 657 74.9% Owner occupied220 25.1% Renter occupiedHouse owners and renters - White alone residents 6,754 74.4% Owner occupied2,318 25.6% Renter occupiedHouse owners and renters - Hispanic or Latino residents 573 47.3% Owner occupied638 52.7% Renter occupied
Language usage in Newnan
English speakers - Total 88.0% of residents of Newnan speak English at home.
6.4% of residents speak Spanish at home 1,778 66.8% Speak English very well884 33.2% Speak English less than very well5.8% of residents speak other language at home 1,264 52.0% Speak English very well1,168 48.0% Speak English less than very well
English speakers - Born in the United States 92.7% of residents of Newnan speak English at home.
4.3% of residents speak Spanish at home 634 83.3% Speak English very well127 16.7% Speak English less than very well3.2% of residents speak other language at home 425 74.0% Speak English very well149 26.0% Speak English less than very well
English speakers - Native, born elsewhere 31.9% of residents of Newnan speak English at home.
78.6% of residents speak Spanish at home 471 64.0% Speak English very well265 36.0% Speak English less than very well1.9% of residents speak other language at home 18 100.0% Speak English less than very well
English speakers - Foreign-born 37.2% of residents of Newnan speak English at home.
26.7% of residents speak Spanish at home 434 47.6% Speak English very well477 52.4% Speak English less than very well51.1% of residents speak other language at home 766 43.9% Speak English very well978 56.1% Speak English less than very well
White (Caucasian) - Speak only English Native:
96.4% (19,655)Foreign-born:
35.5% (332)
White (Caucasian) - Speak another language Native:
3.7% (763)Foreign-born:
64.1% (600)
Black or African American - Speak only English Native:
96.7% (12,176)Foreign-born:
86.6% (1,337)
Black or African American - Speak another language Native:
3.4% (425)Foreign-born:
11.6% (179)
American Indian / Alaska Native - Speak another language Native:
91.9% (115)Foreign-born:
100.0% (81)
Asian - Speak only English Native:
41.5% (193)Foreign-born:
14.7% (175)
Asian - Speak another language Native:
54.0% (251)Foreign-born:
85.2% (1,017)
Other race - Speak another language Native:
98.9% (767)Foreign-born:
99.0% (338)
Two or more races - Speak another language Native:
25.7% (800)Foreign-born:
99.4% (269)
White alone - Speak only English Native:
98.6% (19,196)Foreign-born:
47.7% (324)
White alone - Speak another language Native:
1.5% (285)Foreign-born:
52.2% (354)
Hispanic or Latino - Speak only English Native:
41.8% (1,351)Foreign-born:
11.5% (67)
Hispanic or Latino - Speak another language Native:
56.8% (1,838)Foreign-born:
88.4% (512)
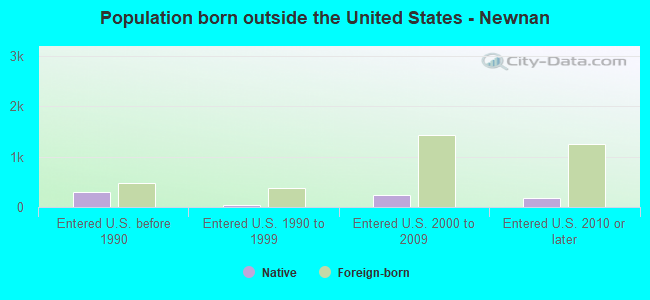
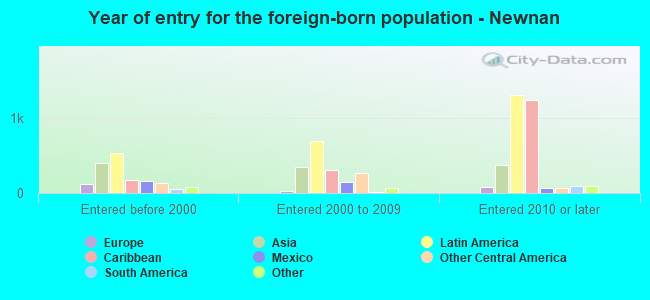
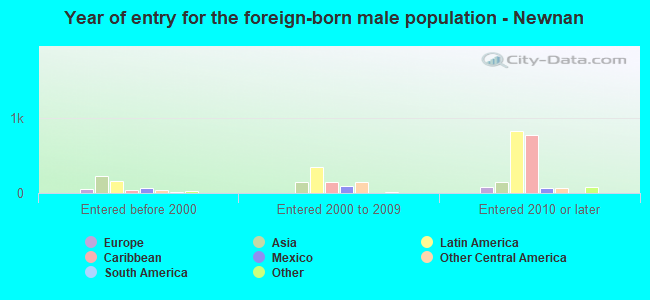
Foreign-born residents in Newnan 4,001 residents are foreign born (5.3% Latin America , 2.6% Asia ).
This city:
9.0%Georgia:
10.4%
Marital status for residents in Newnan Marital status - White (Caucasian) population 15 years and over
Males 27.6% Never married61.0% Now married1.5% Separated2.4% Widowed7.5% DivorcedFemales 24.3% Never married50.1% Now married0.7% Separated10.5% Widowed14.4% DivorcedWomen who gave birth in the past 12 months Now married:
94.4% (212)Unmarried:
5.6% (13)
Women who did not give birth in the past 12 months Now married:
50.4% (2,807)Unmarried:
49.6% (2,760)
Marital status - Black or African American population 15 years and over
Males 53.4% Never married37.9% Now married0.3% Separated0.7% Widowed7.7% DivorcedFemales 50.5% Never married27.6% Now married2.5% Separated7.1% Widowed12.2% DivorcedWomen who gave birth in the past 12 months Now married:
55.6% (30)Unmarried:
44.4% (24)
Women who did not give birth in the past 12 months Now married:
24.8% (1,129)Unmarried:
75.2% (3,420)
Marital status - American Indian / Alaska Native population 15 years and over
Males 100.0% Never married0.0% Now married0.0% Separated0.0% Widowed0.0% DivorcedFemales 0.0% Never married100.0% Now married0.0% Separated0.0% Widowed0.0% DivorcedWomen who did not give birth in the past 12 months Now married:
100.0% (82)Unmarried:
0.0% (0)
Marital status - Asian population 15 years and over
Males 14.9% Never married79.0% Now married0.0% Separated0.0% Widowed6.0% DivorcedFemales 31.7% Never married53.4% Now married1.9% Separated5.1% Widowed7.8% DivorcedWomen who gave birth in the past 12 months Now married:
100.0% (55)Unmarried:
0.0% (0)
Women who did not give birth in the past 12 months Now married:
49.0% (240)Unmarried:
51.0% (249)
Marital status - Other race population 15 years and over
Males 76.2% Never married12.6% Now married0.0% Separated0.0% Widowed11.2% DivorcedFemales 53.7% Never married43.5% Now married0.0% Separated2.9% Widowed0.0% DivorcedWomen who did not give birth in the past 12 months Now married:
43.7% (244)Unmarried:
56.3% (314)
Marital status - Two or more races population 15 years and over
Males 31.0% Never married66.6% Now married0.0% Separated0.0% Widowed2.4% DivorcedFemales 22.2% Never married51.6% Now married0.0% Separated9.3% Widowed16.9% DivorcedWomen who did not give birth in the past 12 months Now married:
42.2% (293)Unmarried:
57.8% (401)
Marital status - White alone, not Hispanic / Latino population 15 years and over
Males 27.7% Never married60.8% Now married1.6% Separated2.4% Widowed7.5% DivorcedFemales 24.1% Never married49.7% Now married0.7% Separated11.0% Widowed14.5% DivorcedWomen who gave birth in the past 12 months Now married:
94.4% (213)Unmarried:
5.6% (13)
Women who did not give birth in the past 12 months Now married:
49.5% (2,574)Unmarried:
50.5% (2,627)
Marital status - Hispanic or Latino population 15 years and over
Males 38.1% Never married54.6% Now married0.0% Separated1.1% Widowed6.2% DivorcedFemales 30.3% Never married58.4% Now married0.0% Separated1.5% Widowed9.8% DivorcedWomen who gave birth in the past 12 months Now married:
0.0% (0)Unmarried:
100.0% (26)
Women who did not give birth in the past 12 months Now married:
50.2% (585)Unmarried:
49.8% (580)
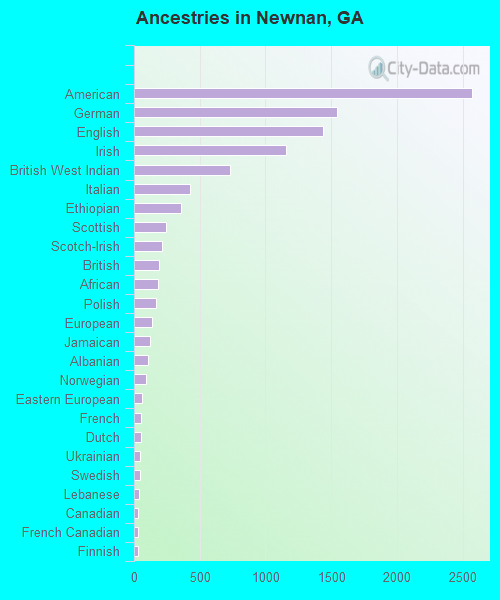
Ancestries in Newnan
2,573 11.1% American1,546 6.7% German1,439 6.2% English1,154 5.0% Irish731 3.2% British West Indian423 1.8% Italian354 1.5% Ethiopian243 1.0% Scottish215 0.9% Scotch-Irish194 0.8% British184 0.8% African168 0.7% Polish136 0.6% European124 0.5% Jamaican110 0.5% Albanian88 0.4% Norwegian60 0.3% Eastern European56 0.2% French52 0.2% Dutch49 0.2% Ukrainian42 0.2% Swedish37 0.2% Lebanese29 0.1% Canadian28 0.1% French Canadian27 0.1% Finnish23 0.10% Turkish22 0.09% Greek17 0.07% Hungarian16 0.07% Pennsylvania German15 0.06% Haitian13 0.06% Welsh12 0.05% Austrian12 0.05% Portuguese6 0.03% Swiss3 0.01% Bahamian3 0.01% Northern European
Geographical mobility in Newnan Same house 1 year ago 19,196 86.4% White (Caucasian)11,661 83.6% Black or African American203 94.8% American Indian / Alaska Native1,410 90.2% Asian967 86.3% Other race3,829 91.9% Two or more races18,076 86.0% White alone, not Hispanic / Latino3,229 86.8% Hispanic or LatinoMoved within same county 1,726 7.8% White / Caucasian696 5.0% Black or African American9 4.2% American Indian / Alaska Native29 1.9% Asian205 4.9% Two or more races1,686 8.0% White alone, not Hispanic / Latino169 4.5% Hispanic or LatinoMoved within same state 431 1.9% White / Caucasian935 6.7% Black or African American12 0.7% Asian26 2.3% Other race102 2.4% Two or more races491 2.3% White alone, not Hispanic / Latino95 2.6% Hispanic or LatinoMoved from different state 681 3.1% White / Caucasian125 0.9% Black or African American125 8.0% Asian109 9.7% Other race24 0.6% Two or more races594 2.8% White alone, not Hispanic / Latino209 5.6% Hispanic or LatinoMoved from abroad 79 0.4% White2 0.1% Asian79 0.4% White alone, not Hispanic / Latino
Children Nativity (place of birth) in Newnan
Children under 6 years - Living with two parents Both parents native 1,470 100.0% NativeBoth parents foreign-born 423 100.0% NativeOne native, one foreign-born parent 143 100.0% NativeChildren under 6 years - Living with one parent Native parent 1,077 100.0% NativeForeign-born parent 18 100.0% NativeChildren 6 to 17 years - Living with two parents Both parents native 3,460 100.0% NativeBoth parents foreign-born 563 86.1% Native91 13.9% Foreign-bornOne native, one foreign-born parent 360 100.0% NativeChildren 6 to 17 years - Living with one parent Native parent 2,599 100.0% NativeForeign-born parent 197 50.3% Native195 49.7% Foreign-born
Grandparents responsible for own grandchildren in Newnan
Grandparents (30 to 59 years) White / Caucasian 17 31.3% Responsible for grandchildren37 68.7% Not responsible for grandchildrenBlack or African American 291 73.3% Responsible for grandchildren106 26.7% Not responsible for grandchildrenAsian 6 100.0% Not responsible for grandchildrenTwo or more races 103 100.0% Not responsible for grandchildrenWhite alone, not Hispanic / Latino 17 30.5% Responsible for grandchildren39 69.5% Not responsible for grandchildrenHispanic or Latino 71 100.0% Not responsible for grandchildrenGrandparents (60 years and over) White / Caucasian 36 27.7% Responsible for grandchildren94 72.3% Not responsible for grandchildrenBlack or African American 347 67.3% Responsible for grandchildren169 32.7% Not responsible for grandchildrenAsian 26 100.0% Not responsible for grandchildrenTwo or more races 18 100.0% Responsible for grandchildrenWhite alone, not Hispanic / Latino 36 33.0% Responsible for grandchildren74 67.0% Not responsible for grandchildrenHispanic or Latino 24 100.0% Not responsible for grandchildren