Races in Newport East, Rhode Island (RI) Detailed Stats
Data:
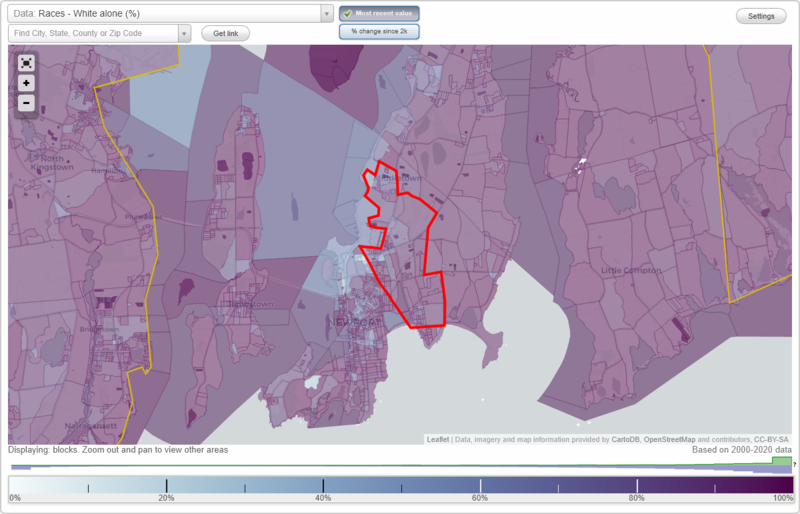
Races - White alone (%)
Races - White alone (% change since 2000)
Races - Black alone (%)
Races - Black alone (% change since 2000)
Races - American Indian alone (%)
Races - American Indian alone (% change since 2000)
Races - Asian alone (%)
Races - Asian alone (% change since 2000)
Races - Hispanic (%)
Races - Hispanic (% change since 2000)
Races - Native Hawaiian and Other Pacific Islander alone (%)
Races - Native Hawaiian and Other Pacific Islander alone (% change since 2000)
Races - Two or more races(%)
Races - Two or more races(% change since 2000)
Races - Other race alone (%)
Races - Other race alone (% change since 2000)
Racial diversity
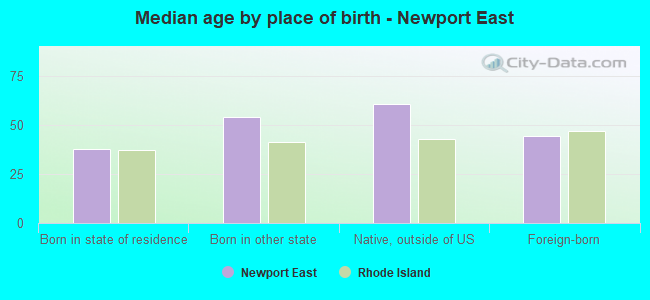
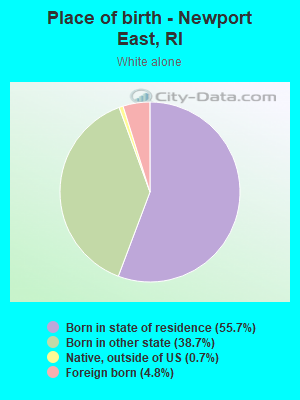
Place of birth - Born in state of residence (%)
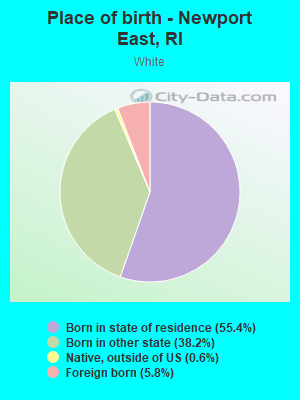
Place of birth - Born in state of residence (%) - White
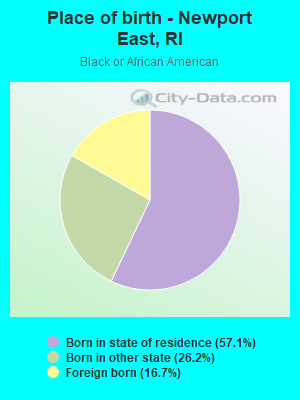
Place of birth - Born in state of residence (%) - Black or African American
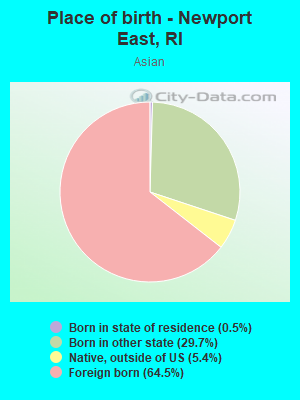
Place of birth - Born in state of residence (%) - Asian
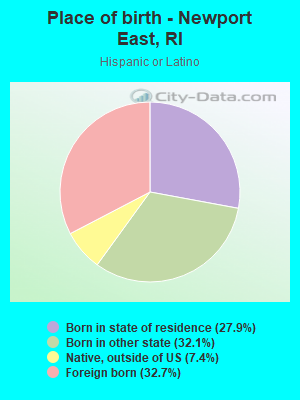
Place of birth - Born in state of residence (%) - Hispanic or Latino
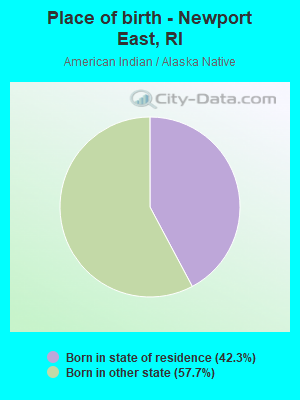
Place of birth - Born in state of residence (%) - American Indian and Alaska Native
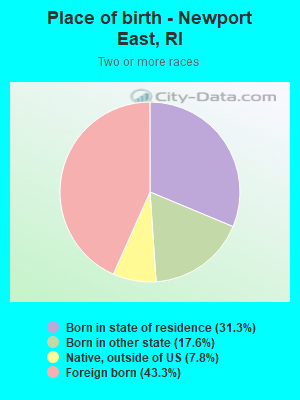
Place of birth - Born in state of residence (%) - Multirace
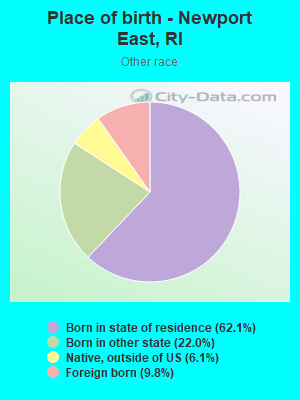
Place of birth - Born in state of residence (%) - Other Race
Place of birth - Born in other state (%)
Place of birth - Born in other state (%) - White
Place of birth - Born in other state (%) - Black or African American
Place of birth - Born in other state (%) - Asian
Place of birth - Born in other state (%) - Hispanic or Latino
Place of birth - Born in other state (%) - American Indian and Alaska Native
Place of birth - Born in other state (%) - Multirace
Place of birth - Born in other state (%) - Other Race
Place of birth - Native, outside of US (%)
Place of birth - Native, outside of US (%) - White
Place of birth - Native, outside of US (%) - Black or African American
Place of birth - Native, outside of US (%) - Asian
Place of birth - Native, outside of US (%) - Hispanic or Latino
Place of birth - Native, outside of US (%) - American Indian and Alaska Native
Place of birth - Native, outside of US (%) - Multirace
Place of birth - Native, outside of US (%) - Other Race
Place of birth - Foreign born (%)
Place of birth - Foreign born (%) - White
Place of birth - Foreign born (%) - Black or African American
Place of birth - Foreign born (%) - Asian
Place of birth - Foreign born (%) - Hispanic or Latino
Place of birth - Foreign born (%) - American Indian and Alaska Native
Place of birth - Foreign born (%) - Multirace
Place of birth - Foreign born (%) - Other Race
Residents speaking English at home (%)
Residents speaking English at home - Born in the United States (%)
Residents speaking English at home - Native, born elsewhere (%)
Residents speaking English at home - Foreign born (%)
Residents speaking Spanish at home (%)
Residents speaking Spanish at home - Born in the United States (%)
Residents speaking Spanish at home - Native, born elsewhere (%)
Residents speaking Spanish at home - Foreign born (%)
Residents speaking other language at home (%)
Residents speaking other language at home - Born in the United States (%)
Residents speaking other language at home - Native, born elsewhere (%)
Residents speaking other language at home - Foreign born (%)
Marital status - Never married (%)
Marital status - Now married (%)
Marital status - Separated (%)
Marital status - Widowed (%)
Marital status - Divorced (%)
Ancestries Reported - Arab (%)
Ancestries Reported - Czech (%)
Ancestries Reported - Danish (%)
Ancestries Reported - Dutch (%)
Ancestries Reported - English (%)
Ancestries Reported - French (%)
Ancestries Reported - French Canadian (%)
Ancestries Reported - German (%)
Ancestries Reported - Greek (%)
Ancestries Reported - Hungarian (%)
Ancestries Reported - Irish (%)
Ancestries Reported - Italian (%)
Ancestries Reported - Lithuanian (%)
Ancestries Reported - Norwegian (%)
Ancestries Reported - Polish (%)
Ancestries Reported - Portuguese (%)
Ancestries Reported - Russian (%)
Ancestries Reported - Scotch-Irish (%)
Ancestries Reported - Scottish (%)
Ancestries Reported - Slovak (%)
Ancestries Reported - Subsaharan African (%)
Ancestries Reported - Swedish (%)
Ancestries Reported - Swiss (%)
Ancestries Reported - Ukrainian (%)
Ancestries Reported - United States (%)
Ancestries Reported - Welsh (%)
Ancestries Reported - West Indian (%)
Ancestries Reported - Other (%)
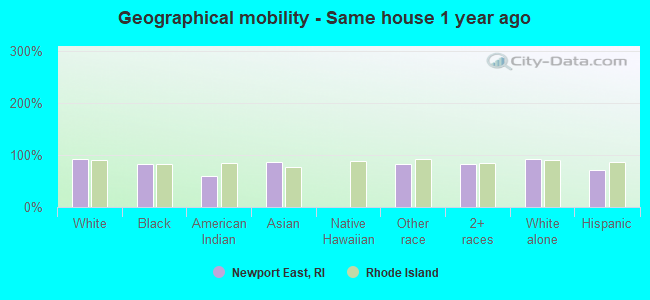
Geographical mobility - Same house 1 year ago (%)
Geographical mobility - Same house 1 year ago (%) - White
Geographical mobility - Same house 1 year ago (%) - Black or African American
Geographical mobility - Same house 1 year ago (%) - Asian
Geographical mobility - Same house 1 year ago (%) - Hispanic or Latino
Geographical mobility - Same house 1 year ago (%) - American Indian and Alaska Native
Geographical mobility - Same house 1 year ago (%) - Multirace
Geographical mobility - Same house 1 year ago (%) - Other Race
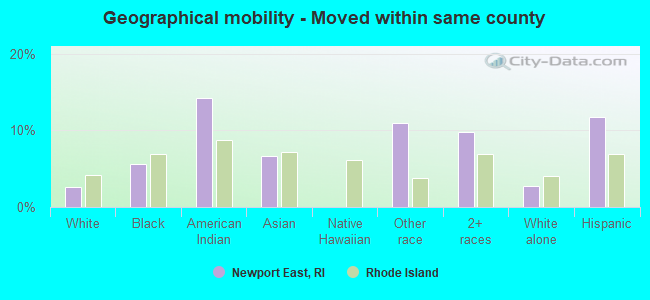
Geographical mobility - Moved within same county (%)
Geographical mobility - Moved within same county (%) - White
Geographical mobility - Moved within same county (%) - Black or African American
Geographical mobility - Moved within same county (%) - Asian
Geographical mobility - Moved within same county (%) - Hispanic or Latino
Geographical mobility - Moved within same county (%) - American Indian and Alaska Native
Geographical mobility - Moved within same county (%) - Multirace
Geographical mobility - Moved within same county (%) - Other Race
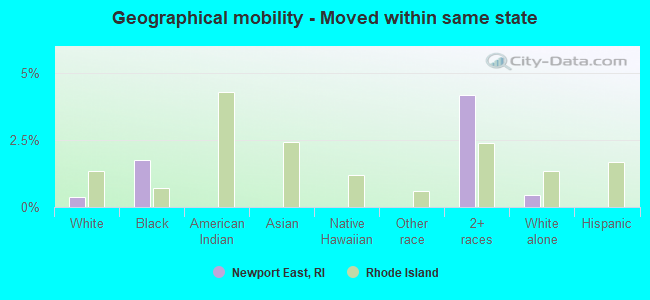
Geographical mobility - Moved from different county within same state (%)
Geographical mobility - Moved from different county within same state (%) - White
Geographical mobility - Moved from different county within same state (%) - Black or African American
Geographical mobility - Moved from different county within same state (%) - Asian
Geographical mobility - Moved from different county within same state (%) - Hispanic or Latino
Geographical mobility - Moved from different county within same state (%) - American Indian and Alaska Native
Geographical mobility - Moved from different county within same state (%) - Multirace
Geographical mobility - Moved from different county within same state (%) - Other Race
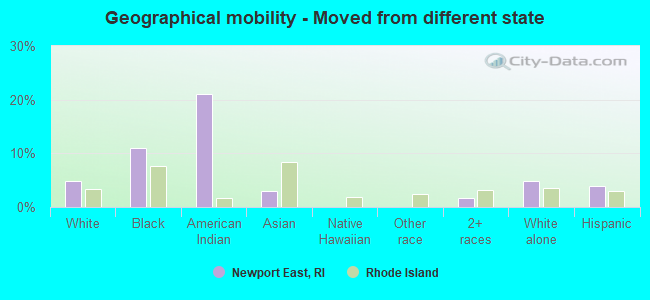
Geographical mobility - Moved from different state (%)
Geographical mobility - Moved from different state (%) - White
Geographical mobility - Moved from different state (%) - Black or African American
Geographical mobility - Moved from different state (%) - Asian
Geographical mobility - Moved from different state (%) - Hispanic or Latino
Geographical mobility - Moved from different state (%) - American Indian and Alaska Native
Geographical mobility - Moved from different state (%) - Multirace
Geographical mobility - Moved from different state (%) - Other Race
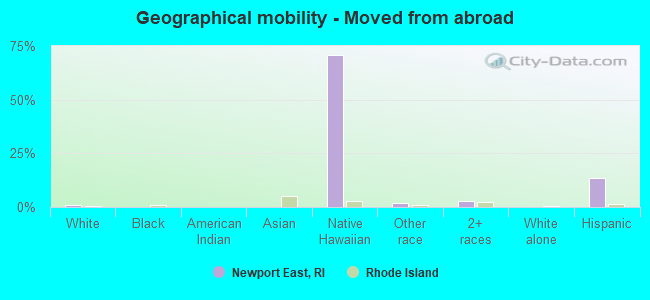
Geographical mobility - Moved from abroad (%)
Geographical mobility - Moved from abroad (%) - White
Geographical mobility - Moved from abroad (%) - Black or African American
Geographical mobility - Moved from abroad (%) - Asian
Geographical mobility - Moved from abroad (%) - Hispanic or Latino
Geographical mobility - Moved from abroad (%) - American Indian and Alaska Native
Geographical mobility - Moved from abroad (%) - Multirace
Geographical mobility - Moved from abroad (%) - Other Race
Place of birth for the foreign-born population - Ireland (%)
Place of birth for the foreign-born population - Denmark (%)
Place of birth for the foreign-born population - Norway (%)
Place of birth for the foreign-born population - Sweden (%)
Place of birth for the foreign-born population - United Kingdom (%)
Place of birth for the foreign-born population - England (%)
Place of birth for the foreign-born population - Scotland (%)
Place of birth for the foreign-born population - Other Northern Europe (%)
Place of birth for the foreign-born population - Austria (%)
Place of birth for the foreign-born population - Belgium (%)
Place of birth for the foreign-born population - France (%)
Place of birth for the foreign-born population - Germany (%)
Place of birth for the foreign-born population - Netherlands (%)
Place of birth for the foreign-born population - Switzerland (%)
Place of birth for the foreign-born population - Other Western Europe (%)
Place of birth for the foreign-born population - Greece (%)
Place of birth for the foreign-born population - Italy (%)
Place of birth for the foreign-born population - Portugal (%)
Place of birth for the foreign-born population - Spain (%)
Place of birth for the foreign-born population - Other Southern Europe (%)
Place of birth for the foreign-born population - Albania (%)
Place of birth for the foreign-born population - Belarus (%)
Place of birth for the foreign-born population - Bosnia and Herzegovina (%)
Place of birth for the foreign-born population - Bulgaria (%)
Place of birth for the foreign-born population - Croatia (%)
Place of birth for the foreign-born population - Czechoslovakia (%)
Place of birth for the foreign-born population - Hungary (%)
Place of birth for the foreign-born population - Latvia (%)
Place of birth for the foreign-born population - Lithuania (%)
Place of birth for the foreign-born population - North Macedonia (Macedonia) (%)
Place of birth for the foreign-born population - Moldova (%)
Place of birth for the foreign-born population - Poland (%)
Place of birth for the foreign-born population - Romania (%)
Place of birth for the foreign-born population - Russia (%)
Place of birth for the foreign-born population - Serbia (%)
Place of birth for the foreign-born population - Ukraine (%)
Place of birth for the foreign-born population - Other Eastern Europe (%)
Place of birth for the foreign-born population - China (%)
Place of birth for the foreign-born population - Hong Kong (%)
Place of birth for the foreign-born population - Taiwan (%)
Place of birth for the foreign-born population - Japan (%)
Place of birth for the foreign-born population - Korea (%)
Place of birth for the foreign-born population - Other Eastern Asia (%)
Place of birth for the foreign-born population - Afghanistan (%)
Place of birth for the foreign-born population - Bangladesh (%)
Place of birth for the foreign-born population - India (%)
Place of birth for the foreign-born population - Iran (%)
Place of birth for the foreign-born population - Kazakhstan (%)
Place of birth for the foreign-born population - Nepal (%)
Place of birth for the foreign-born population - Pakistan (%)
Place of birth for the foreign-born population - Sri Lanka (%)
Place of birth for the foreign-born population - Uzbekistan (%)
Place of birth for the foreign-born population - Other South Central Asia (%)
Place of birth for the foreign-born population - Burma (%)
Place of birth for the foreign-born population - Cambodia (%)
Place of birth for the foreign-born population - Indonesia (%)
Place of birth for the foreign-born population - Laos (%)
Place of birth for the foreign-born population - Malaysia (%)
Place of birth for the foreign-born population - Philippines (%)
Place of birth for the foreign-born population - Singapore (%)
Place of birth for the foreign-born population - Thailand (%)
Place of birth for the foreign-born population - Vietnam (%)
Place of birth for the foreign-born population - Other South Eastern Asia (%)
Place of birth for the foreign-born population - Armenia (%)
Place of birth for the foreign-born population - Iraq (%)
Place of birth for the foreign-born population - Israel (%)
Place of birth for the foreign-born population - Jordan (%)
Place of birth for the foreign-born population - Kuwait (%)
Place of birth for the foreign-born population - Lebanon (%)
Place of birth for the foreign-born population - Saudi Arabia (%)
Place of birth for the foreign-born population - Syria (%)
Place of birth for the foreign-born population - Turkey (%)
Place of birth for the foreign-born population - Yemen (%)
Place of birth for the foreign-born population - Other Western Asia (%)
Place of birth for the foreign-born population - Eritrea (%)
Place of birth for the foreign-born population - Ethiopia (%)
Place of birth for the foreign-born population - Kenya (%)
Place of birth for the foreign-born population - Somalia (%)
Place of birth for the foreign-born population - Uganda (%)
Place of birth for the foreign-born population - Zimbabwe (%)
Place of birth for the foreign-born population - Other Eastern Africa (%)
Place of birth for the foreign-born population - Cameroon (%)
Place of birth for the foreign-born population - Congo (%)
Place of birth for the foreign-born population - Democratic Republic of Congo (Zaire) (%)
Place of birth for the foreign-born population - Other Middle Africa (%)
Place of birth for the foreign-born population - Egypt (%)
Place of birth for the foreign-born population - Morocco (%)
Place of birth for the foreign-born population - Sudan (%)
Place of birth for the foreign-born population - Other Northern Africa (%)
Place of birth for the foreign-born population - South Africa (%)
Place of birth for the foreign-born population - Other Southern Africa (%)
Place of birth for the foreign-born population - Cabo Verde (%)
Place of birth for the foreign-born population - Ghana (%)
Place of birth for the foreign-born population - Liberia (%)
Place of birth for the foreign-born population - Nigeria (%)
Place of birth for the foreign-born population - Senegal (%)
Place of birth for the foreign-born population - Sierra Leone (%)
Place of birth for the foreign-born population - Other Western Africa (%)
Place of birth for the foreign-born population - Australia (%)
Place of birth for the foreign-born population - New Zealand (%)
Place of birth for the foreign-born population - Fiji (%)
Place of birth for the foreign-born population - Micronesia (%)
Place of birth for the foreign-born population - Bahamas (%)
Place of birth for the foreign-born population - Barbados (%)
Place of birth for the foreign-born population - Cuba (%)
Place of birth for the foreign-born population - Dominica (%)
Place of birth for the foreign-born population - Dominican Republic (%)
Place of birth for the foreign-born population - Grenada (%)
Place of birth for the foreign-born population - Haiti (%)
Place of birth for the foreign-born population - Jamaica (%)
Place of birth for the foreign-born population - St. Vincent and the Grenadines (%)
Place of birth for the foreign-born population - Trinidad and Tobago (%)
Place of birth for the foreign-born population - West Indies (%)
Place of birth for the foreign-born population - Other Caribbean (%)
Place of birth for the foreign-born population - Belize (%)
Place of birth for the foreign-born population - Costa Rica (%)
Place of birth for the foreign-born population - El Salvador (%)
Place of birth for the foreign-born population - Guatemala (%)
Place of birth for the foreign-born population - Honduras (%)
Place of birth for the foreign-born population - Mexico (%)
Place of birth for the foreign-born population - Nicaragua (%)
Place of birth for the foreign-born population - Panama (%)
Place of birth for the foreign-born population - Other Central America (%)
Place of birth for the foreign-born population - Argentina (%)
Place of birth for the foreign-born population - Bolivia (%)
Place of birth for the foreign-born population - Brazil (%)
Place of birth for the foreign-born population - Chile (%)
Place of birth for the foreign-born population - Colombia (%)
Place of birth for the foreign-born population - Ecuador (%)
Place of birth for the foreign-born population - Guyana (%)
Place of birth for the foreign-born population - Peru (%)
Place of birth for the foreign-born population - Uruguay (%)
Place of birth for the foreign-born population - Venezuela (%)
Place of birth for the foreign-born population - Other South America (%)
Place of birth for the foreign-born population - Canada (%)
Place of birth for the foreign-born population - Other Northern America (%)
Place of birth for the foreign-born population - Other (%)
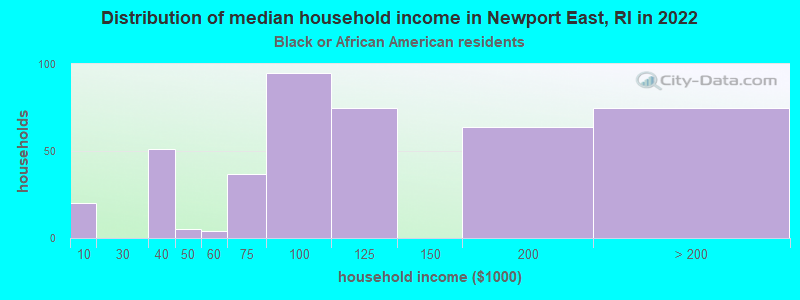
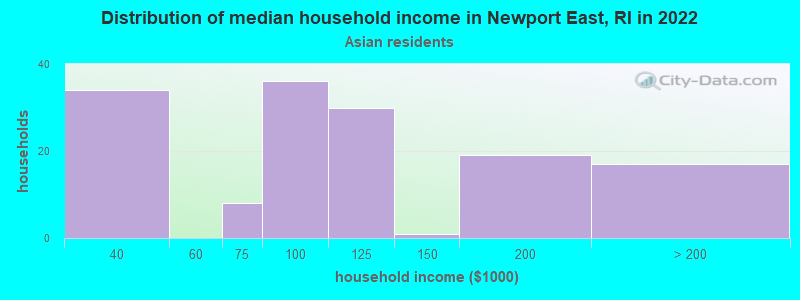
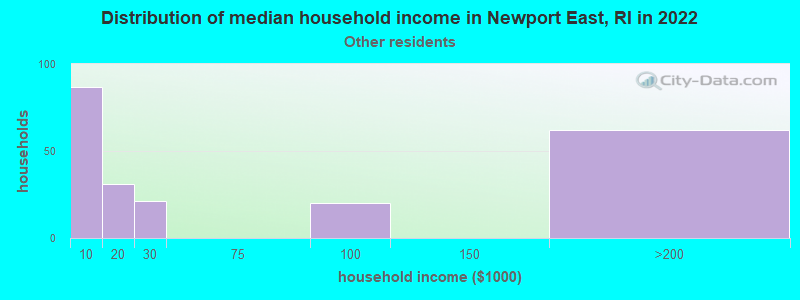
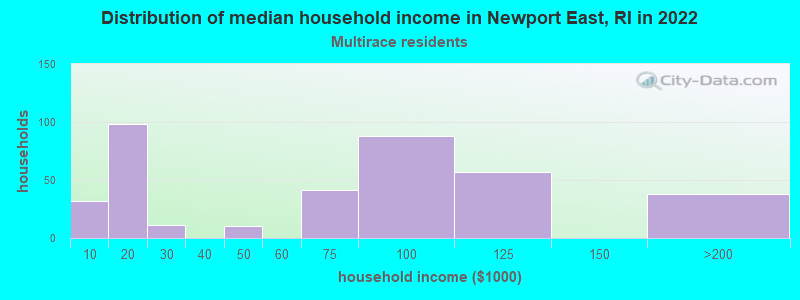
According to 2022 data, the most numerous races in Newport East, RI are White alone (8,717 residents), Hispanic (716 residents), and Two or more races (898 residents). 83.1% of Newport East residents speak English at home. 10.5% of Newport East, RI residents are foreign-born (5.3% born in Latin America, 3.1% born in Europe, 1.3% born in Asia), which is 33.5% less than the foreign-born rate of 14.0% across the entire state of Rhode Island.
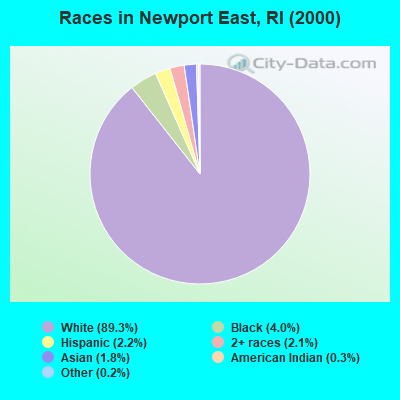
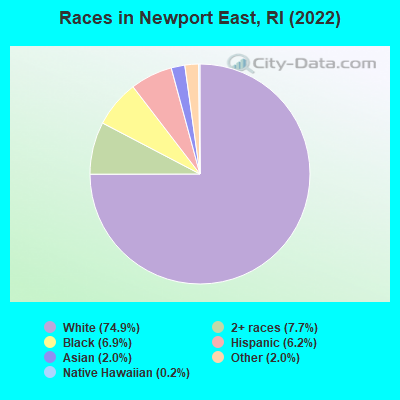
Race distribution in Newport East
2000 2022
858,433 81.9% White alone 90,820 8.7% Hispanic 41,922 4.0% Black alone 23,416 2.2% Asian alone 20,816 2.0% Two or more races 8,411 0.8% Other race alone 4,181 0.4% American Indian alone 320 0.03% Native Hawaiian and Other
745,825 68.2% White alone 191,979 17.6% Hispanic 56,738 5.2% Two or more races 51,326 4.7% Black alone 37,234 3.4% Asian alone 9,514 0.9% Other race alone 978 0.09% American Indian alone 140 0.01% Native Hawaiian and Other
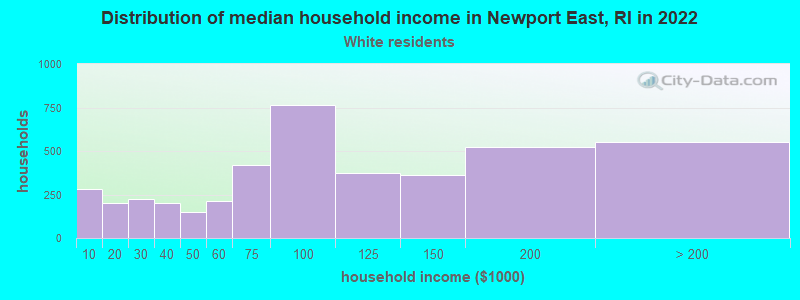
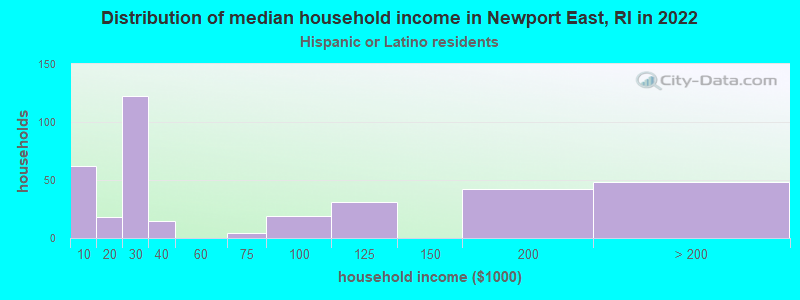
Income and house value in Newport East Median household income in 2022 $86,217 White non-Hispanic householders$124,901 Black householders$103,419 Asian householders$88,283 Two or more races householdersMedian 2022 house value $555,083 White Non-Hispanic householders$527,588 Black or African American householders $417,984 Asian householders$510,869 Some other race householders$510,869 Two or more races householders$510,869 Hispanic or Latino householders
Median age by race in Newport East
51.9 Median age for White residents50.3 53.5 31.7 Median age for Black or African American residents23.2 40.1 83.2 Median age for American Indian / Alaska Native residents-743,837,083.9 -606,811,144.9 57.0 Median age for Asian residents51.6 49.8 -713,991,768.8 Median age for Native Hawaiian / Pacific Islander residents-666,666,666.0 -666,666,666.0 28.2 Median age for Other race residents6.1 33.1 32.3 Median age for Two or more races residents45.8 20.3 52.4 Median age for White alone residents50.6 54.0 29.0 Median age for Hispanic or Latino residents26.8 29.0
Owner/renter occupied households by race in Newport East
House owners and renters - White residents 2,663 61.7% Owner occupied1,654 38.3% Renter occupiedHouse owners and renters - Black or African American residents 179 51.5% Owner occupied169 48.5% Renter occupiedHouse owners and renters - American Indian / Alaska Native residents 4 100.0% Renter occupiedHouse owners and renters - Asian residents 102 61.9% Owner occupied63 38.1% Renter occupiedHouse owners and renters - Other race residents 55 35.2% Owner occupied101 64.8% Renter occupiedHouse owners and renters - Two or more races residents 188 49.5% Owner occupied191 50.5% Renter occupiedHouse owners and renters - White alone residents 2,633 62.1% Owner occupied1,606 37.9% Renter occupiedHouse owners and renters - Hispanic or Latino residents 86 39.1% Owner occupied135 60.9% Renter occupied
Language usage in Newport East
English speakers - Total 83.1% of residents of Newport East speak English at home.
4.5% of residents speak Spanish at home 383 77.8% Speak English very well109 22.2% Speak English less than very well14.4% of residents speak other language at home 957 61.4% Speak English very well602 38.6% Speak English less than very well
English speakers - Born in the United States 95.5% of residents of Newport East speak English at home.
2.0% of residents speak Spanish at home 64 85.3% Speak English very well11 14.7% Speak English less than very well2.1% of residents speak other language at home 82 100.0% Speak English very well
English speakers - Native, born elsewhere 36.4% of residents of Newport East speak English at home.
32.3% of residents speak Spanish at home 34 54.0% Speak English very well29 46.0% Speak English less than very well5.1% of residents speak other language at home 10 100.0% Speak English very well
English speakers - Foreign-born 19.7% of residents of Newport East speak English at home.
7.1% of residents speak Spanish at home 57 54.3% Speak English very well48 45.7% Speak English less than very well76.9% of residents speak other language at home 521 45.5% Speak English very well623 54.5% Speak English less than very well
White (Caucasian) - Speak only English Native:
95.3% (7,573)Foreign-born:
16.6% (80)
White (Caucasian) - Speak another language Native:
4.3% (339)Foreign-born:
88.8% (428)
Black or African American - Speak only English Native:
86.7% (460)Foreign-born:
69.6% (179)
Black or African American - Speak another language Native:
13.3% (71)Foreign-born:
40.7% (105)
Asian - Speak only English Native:
100.0% (85)Foreign-born:
6.6% (20)
Other race - Speak only English Native:
63.5% (211)Foreign-born:
58.5% (25)
Other race - Speak another language Native:
41.5% (138)Foreign-born:
56.7% (24)
Two or more races - Speak only English Native:
78.4% (556)Foreign-born:
25.2% (89)
Two or more races - Speak another language Native:
21.2% (150)Foreign-born:
79.6% (280)
White alone - Speak only English Native:
96.2% (7,560)Foreign-born:
19.4% (80)
White alone - Speak another language Native:
3.7% (294)Foreign-born:
86.4% (356)
Hispanic or Latino - Speak only English Native:
21.0% (69)Foreign-born:
28.7% (50)
Hispanic or Latino - Speak another language Native:
100.0% (330)Foreign-born:
76.4% (133)
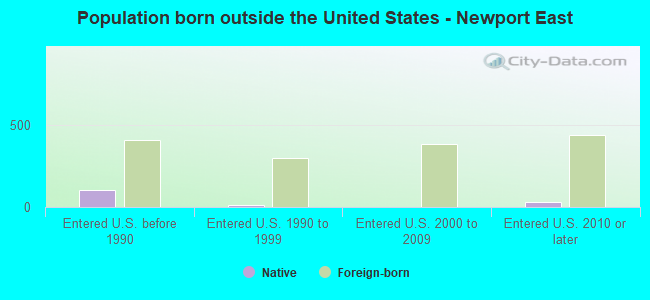
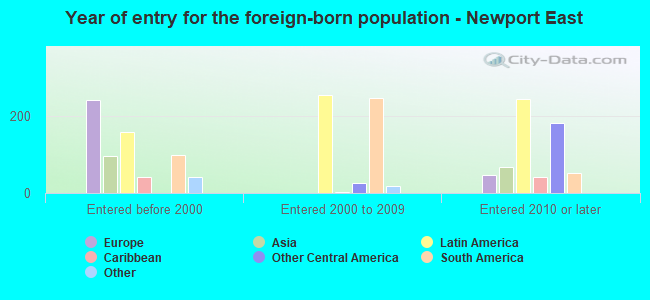
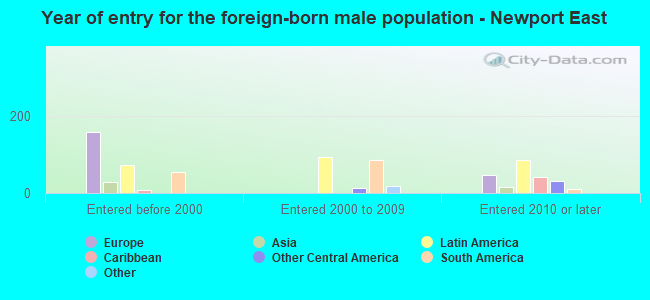
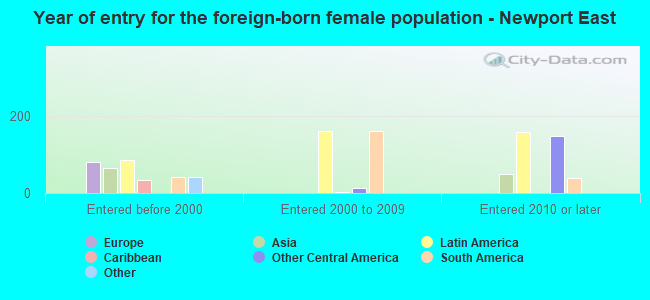
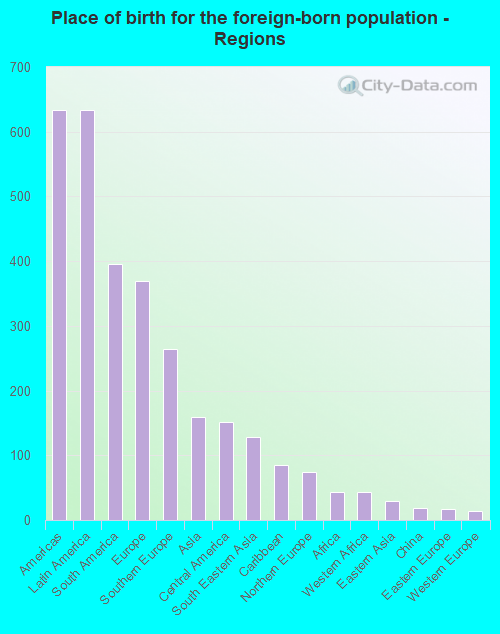
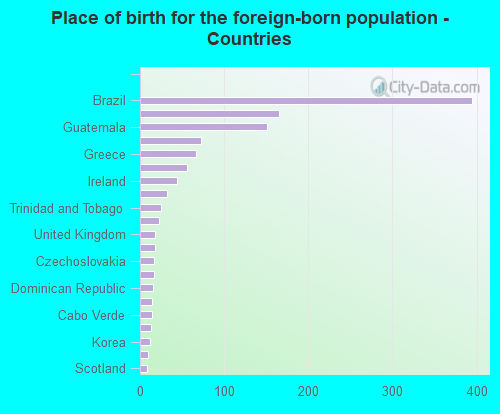
Foreign-born residents in Newport East 1,207 residents are foreign born (5.3% Latin America , 3.1% Europe , 1.3% Asia ).
This city:
10.5%Rhode Island:
14.4%
Marital status for residents in Newport East Marital status - White (Caucasian) population 15 years and over
Males 30.7% Never married48.8% Now married0.8% Separated3.6% Widowed16.1% DivorcedFemales 29.5% Never married42.9% Now married2.2% Separated13.3% Widowed12.1% DivorcedWomen who gave birth in the past 12 months Now married:
48.8% (76)Unmarried:
51.2% (80)
Women who did not give birth in the past 12 months Now married:
35.5% (556)Unmarried:
64.5% (1,008)
Marital status - Black or African American population 15 years and over
Males 44.4% Never married44.4% Now married6.2% Separated2.8% Widowed2.2% DivorcedFemales 29.9% Never married25.1% Now married0.0% Separated19.6% Widowed25.4% DivorcedWomen who did not give birth in the past 12 months Now married:
32.6% (57)Unmarried:
67.4% (117)
Marital status - American Indian / Alaska Native population 15 years and over
Males 42.9% Never married57.1% Now married0.0% Separated0.0% Widowed0.0% DivorcedFemales 0.0% Never married100.0% Now married0.0% Separated0.0% Widowed0.0% DivorcedMarital status - Asian population 15 years and over
Males 51.9% Never married32.1% Now married0.0% Separated0.0% Widowed16.0% DivorcedFemales 23.0% Never married53.9% Now married0.0% Separated14.5% Widowed8.6% DivorcedWomen who did not give birth in the past 12 months Now married:
55.7% (49)Unmarried:
44.3% (39)
Marital status - Other race population 15 years and over
Males 56.9% Never married40.3% Now married0.0% Separated2.8% Widowed0.0% DivorcedFemales 50.3% Never married37.6% Now married0.0% Separated0.0% Widowed12.2% DivorcedWomen who did not give birth in the past 12 months Now married:
23.3% (34)Unmarried:
76.7% (112)
Marital status - Two or more races population 15 years and over
Males 61.2% Never married35.6% Now married0.0% Separated0.0% Widowed3.2% DivorcedFemales 51.1% Never married31.1% Now married0.0% Separated7.2% Widowed10.6% DivorcedWomen who did not give birth in the past 12 months Now married:
36.1% (81)Unmarried:
63.9% (143)
Marital status - White alone, not Hispanic / Latino population 15 years and over
Males 31.4% Never married48.4% Now married0.9% Separated3.6% Widowed15.7% DivorcedFemales 27.8% Never married43.8% Now married1.9% Separated13.9% Widowed12.6% DivorcedWomen who gave birth in the past 12 months Now married:
30.4% (36)Unmarried:
69.6% (82)
Women who did not give birth in the past 12 months Now married:
38.5% (576)Unmarried:
61.5% (919)
Marital status - Hispanic or Latino population 15 years and over
Males 46.9% Never married29.1% Now married0.0% Separated1.1% Widowed22.9% DivorcedFemales 70.6% Never married18.0% Now married5.5% Separated4.5% Widowed1.4% DivorcedWomen who gave birth in the past 12 months Now married:
100.0% (46)Unmarried:
0.0% (0)
Women who did not give birth in the past 12 months Now married:
0.0% (0)Unmarried:
100.0% (214)
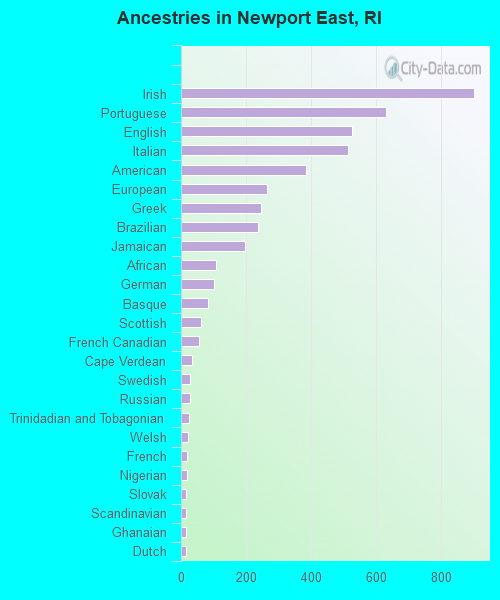
Ancestries in Newport East
902 15.6% Irish631 10.9% Portuguese526 9.1% English513 8.9% Italian385 6.7% American263 4.5% European245 4.2% Greek238 4.1% Brazilian198 3.4% Jamaican107 1.8% African101 1.7% German83 1.4% Basque62 1.1% Scottish56 1.0% French Canadian34 0.6% Cape Verdean29 0.5% Swedish29 0.5% Russian26 0.4% Trinidadian and Tobagonian23 0.4% Welsh17 0.3% French17 0.3% Nigerian16 0.3% Slovak15 0.3% Scandinavian15 0.3% Ghanaian14 0.2% Dutch13 0.2% Hungarian11 0.2% Lebanese10 0.2% Czech10 0.2% British West Indian9 0.2% Scotch-Irish8 0.1% Barbadian7 0.1% Polish5 0.09% Eastern European
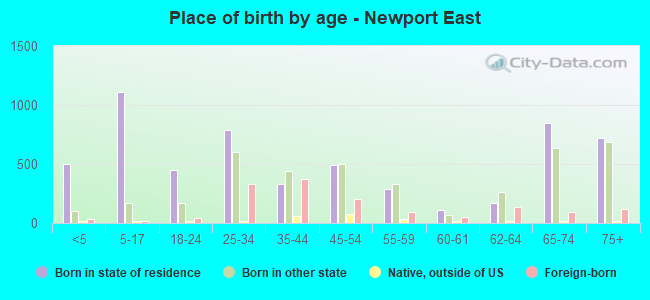
Children Nativity (place of birth) in Newport East
Children under 6 years - Living with two parents Both parents native 191 99.0% Native2 1.0% Foreign-bornBoth parents foreign-born 150 81.6% Native34 18.4% Foreign-bornOne native, one foreign-born parent 163 100.0% NativeChildren under 6 years - Living with one parent Native parent 220 100.0% NativeForeign-born parent 101 100.0% NativeChildren 6 to 17 years - Living with two parents Both parents native 487 100.0% NativeBoth parents foreign-born 175 96.0% Native7 4.0% Foreign-bornOne native, one foreign-born parent 83 100.0% NativeChildren 6 to 17 years - Living with one parent Native parent 262 100.0% NativeForeign-born parent 57 51.3% Native54 48.7% Foreign-born
Grandparents responsible for own grandchildren in Newport East
Grandparents (30 to 59 years) White / Caucasian 57 100.0% Responsible for grandchildrenWhite alone, not Hispanic / Latino 69 100.0% Responsible for grandchildren
Grandparents (60 years and over) White / Caucasian 61 100.0% Not responsible for grandchildrenWhite alone, not Hispanic / Latino 63 100.0% Not responsible for grandchildren