Races in Newport, Kentucky (KY) Detailed Stats
Data:
Races - White alone (%)
Races - White alone (% change since 2000)
Races - Black alone (%)
Races - Black alone (% change since 2000)
Races - American Indian alone (%)
Races - American Indian alone (% change since 2000)
Races - Asian alone (%)
Races - Asian alone (% change since 2000)
Races - Hispanic (%)
Races - Hispanic (% change since 2000)
Races - Native Hawaiian and Other Pacific Islander alone (%)
Races - Native Hawaiian and Other Pacific Islander alone (% change since 2000)
Races - Two or more races(%)
Races - Two or more races(% change since 2000)
Races - Other race alone (%)
Races - Other race alone (% change since 2000)
Racial diversity
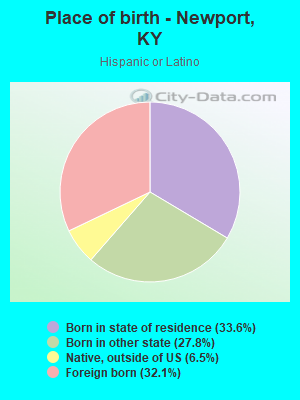
Place of birth - Born in state of residence (%)
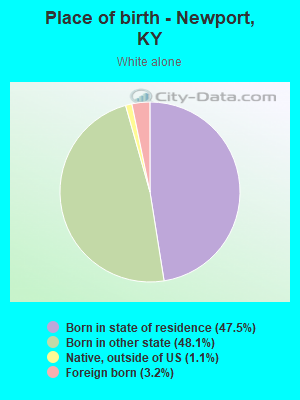
Place of birth - Born in state of residence (%) - White
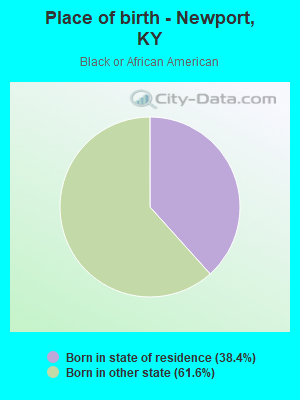
Place of birth - Born in state of residence (%) - Black or African American
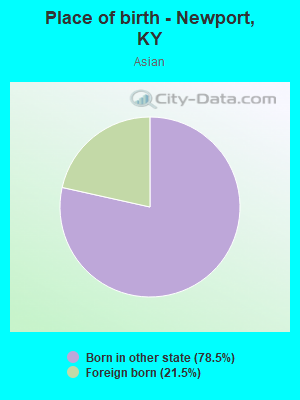
Place of birth - Born in state of residence (%) - Asian
Place of birth - Born in state of residence (%) - Hispanic or Latino
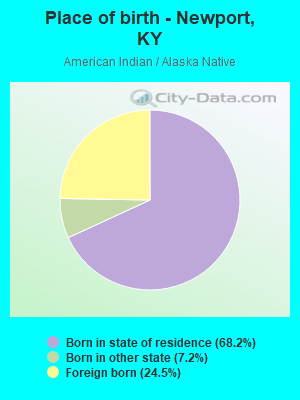
Place of birth - Born in state of residence (%) - American Indian and Alaska Native
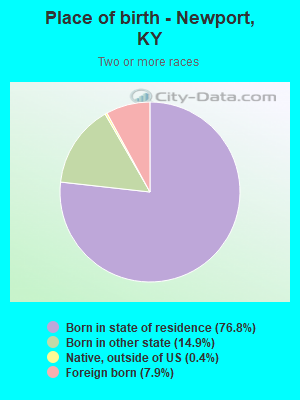
Place of birth - Born in state of residence (%) - Multirace
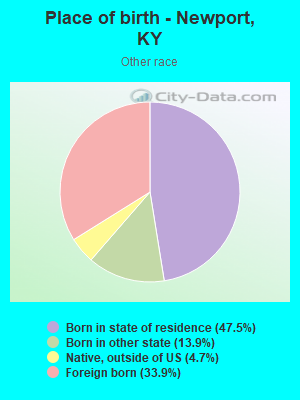
Place of birth - Born in state of residence (%) - Other Race
Place of birth - Born in other state (%)
Place of birth - Born in other state (%) - White
Place of birth - Born in other state (%) - Black or African American
Place of birth - Born in other state (%) - Asian
Place of birth - Born in other state (%) - Hispanic or Latino
Place of birth - Born in other state (%) - American Indian and Alaska Native
Place of birth - Born in other state (%) - Multirace
Place of birth - Born in other state (%) - Other Race
Place of birth - Native, outside of US (%)
Place of birth - Native, outside of US (%) - White
Place of birth - Native, outside of US (%) - Black or African American
Place of birth - Native, outside of US (%) - Asian
Place of birth - Native, outside of US (%) - Hispanic or Latino
Place of birth - Native, outside of US (%) - American Indian and Alaska Native
Place of birth - Native, outside of US (%) - Multirace
Place of birth - Native, outside of US (%) - Other Race
Place of birth - Foreign born (%)
Place of birth - Foreign born (%) - White
Place of birth - Foreign born (%) - Black or African American
Place of birth - Foreign born (%) - Asian
Place of birth - Foreign born (%) - Hispanic or Latino
Place of birth - Foreign born (%) - American Indian and Alaska Native
Place of birth - Foreign born (%) - Multirace
Place of birth - Foreign born (%) - Other Race
Residents speaking English at home (%)
Residents speaking English at home - Born in the United States (%)
Residents speaking English at home - Native, born elsewhere (%)
Residents speaking English at home - Foreign born (%)
Residents speaking Spanish at home (%)
Residents speaking Spanish at home - Born in the United States (%)
Residents speaking Spanish at home - Native, born elsewhere (%)
Residents speaking Spanish at home - Foreign born (%)
Residents speaking other language at home (%)
Residents speaking other language at home - Born in the United States (%)
Residents speaking other language at home - Native, born elsewhere (%)
Residents speaking other language at home - Foreign born (%)
Marital status - Never married (%)
Marital status - Now married (%)
Marital status - Separated (%)
Marital status - Widowed (%)
Marital status - Divorced (%)
Ancestries Reported - Arab (%)
Ancestries Reported - Czech (%)
Ancestries Reported - Danish (%)
Ancestries Reported - Dutch (%)
Ancestries Reported - English (%)
Ancestries Reported - French (%)
Ancestries Reported - French Canadian (%)
Ancestries Reported - German (%)
Ancestries Reported - Greek (%)
Ancestries Reported - Hungarian (%)
Ancestries Reported - Irish (%)
Ancestries Reported - Italian (%)
Ancestries Reported - Lithuanian (%)
Ancestries Reported - Norwegian (%)
Ancestries Reported - Polish (%)
Ancestries Reported - Portuguese (%)
Ancestries Reported - Russian (%)
Ancestries Reported - Scotch-Irish (%)
Ancestries Reported - Scottish (%)
Ancestries Reported - Slovak (%)
Ancestries Reported - Subsaharan African (%)
Ancestries Reported - Swedish (%)
Ancestries Reported - Swiss (%)
Ancestries Reported - Ukrainian (%)
Ancestries Reported - United States (%)
Ancestries Reported - Welsh (%)
Ancestries Reported - West Indian (%)
Ancestries Reported - Other (%)
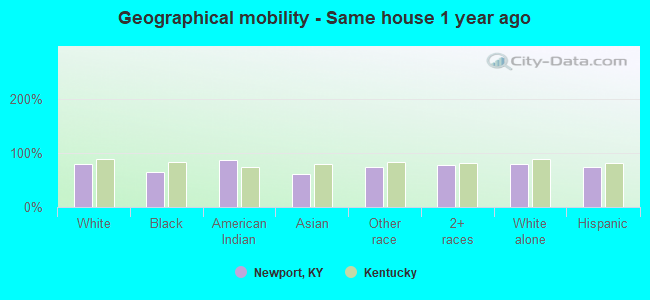
Geographical mobility - Same house 1 year ago (%)
Geographical mobility - Same house 1 year ago (%) - White
Geographical mobility - Same house 1 year ago (%) - Black or African American
Geographical mobility - Same house 1 year ago (%) - Asian
Geographical mobility - Same house 1 year ago (%) - Hispanic or Latino
Geographical mobility - Same house 1 year ago (%) - American Indian and Alaska Native
Geographical mobility - Same house 1 year ago (%) - Multirace
Geographical mobility - Same house 1 year ago (%) - Other Race
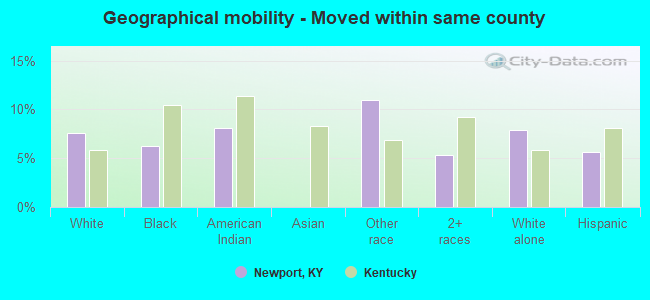
Geographical mobility - Moved within same county (%)
Geographical mobility - Moved within same county (%) - White
Geographical mobility - Moved within same county (%) - Black or African American
Geographical mobility - Moved within same county (%) - Asian
Geographical mobility - Moved within same county (%) - Hispanic or Latino
Geographical mobility - Moved within same county (%) - American Indian and Alaska Native
Geographical mobility - Moved within same county (%) - Multirace
Geographical mobility - Moved within same county (%) - Other Race
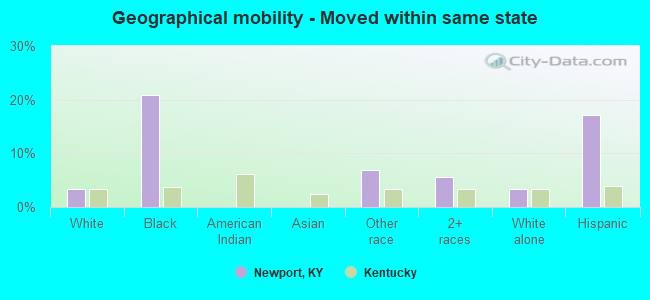
Geographical mobility - Moved from different county within same state (%)
Geographical mobility - Moved from different county within same state (%) - White
Geographical mobility - Moved from different county within same state (%) - Black or African American
Geographical mobility - Moved from different county within same state (%) - Asian
Geographical mobility - Moved from different county within same state (%) - Hispanic or Latino
Geographical mobility - Moved from different county within same state (%) - American Indian and Alaska Native
Geographical mobility - Moved from different county within same state (%) - Multirace
Geographical mobility - Moved from different county within same state (%) - Other Race
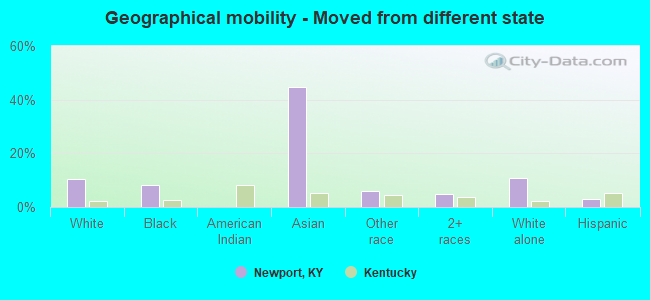
Geographical mobility - Moved from different state (%)
Geographical mobility - Moved from different state (%) - White
Geographical mobility - Moved from different state (%) - Black or African American
Geographical mobility - Moved from different state (%) - Asian
Geographical mobility - Moved from different state (%) - Hispanic or Latino
Geographical mobility - Moved from different state (%) - American Indian and Alaska Native
Geographical mobility - Moved from different state (%) - Multirace
Geographical mobility - Moved from different state (%) - Other Race
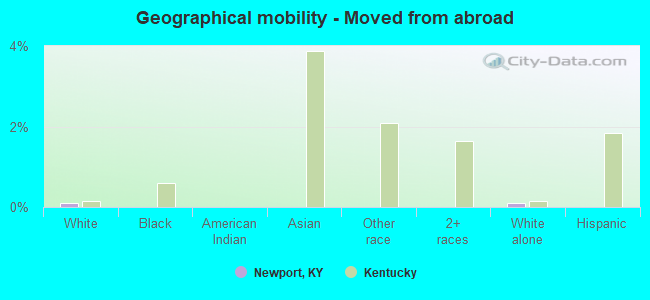
Geographical mobility - Moved from abroad (%)
Geographical mobility - Moved from abroad (%) - White
Geographical mobility - Moved from abroad (%) - Black or African American
Geographical mobility - Moved from abroad (%) - Asian
Geographical mobility - Moved from abroad (%) - Hispanic or Latino
Geographical mobility - Moved from abroad (%) - American Indian and Alaska Native
Geographical mobility - Moved from abroad (%) - Multirace
Geographical mobility - Moved from abroad (%) - Other Race
Place of birth for the foreign-born population - Ireland (%)
Place of birth for the foreign-born population - Denmark (%)
Place of birth for the foreign-born population - Norway (%)
Place of birth for the foreign-born population - Sweden (%)
Place of birth for the foreign-born population - United Kingdom (%)
Place of birth for the foreign-born population - England (%)
Place of birth for the foreign-born population - Scotland (%)
Place of birth for the foreign-born population - Other Northern Europe (%)
Place of birth for the foreign-born population - Austria (%)
Place of birth for the foreign-born population - Belgium (%)
Place of birth for the foreign-born population - France (%)
Place of birth for the foreign-born population - Germany (%)
Place of birth for the foreign-born population - Netherlands (%)
Place of birth for the foreign-born population - Switzerland (%)
Place of birth for the foreign-born population - Other Western Europe (%)
Place of birth for the foreign-born population - Greece (%)
Place of birth for the foreign-born population - Italy (%)
Place of birth for the foreign-born population - Portugal (%)
Place of birth for the foreign-born population - Spain (%)
Place of birth for the foreign-born population - Other Southern Europe (%)
Place of birth for the foreign-born population - Albania (%)
Place of birth for the foreign-born population - Belarus (%)
Place of birth for the foreign-born population - Bosnia and Herzegovina (%)
Place of birth for the foreign-born population - Bulgaria (%)
Place of birth for the foreign-born population - Croatia (%)
Place of birth for the foreign-born population - Czechoslovakia (%)
Place of birth for the foreign-born population - Hungary (%)
Place of birth for the foreign-born population - Latvia (%)
Place of birth for the foreign-born population - Lithuania (%)
Place of birth for the foreign-born population - North Macedonia (Macedonia) (%)
Place of birth for the foreign-born population - Moldova (%)
Place of birth for the foreign-born population - Poland (%)
Place of birth for the foreign-born population - Romania (%)
Place of birth for the foreign-born population - Russia (%)
Place of birth for the foreign-born population - Serbia (%)
Place of birth for the foreign-born population - Ukraine (%)
Place of birth for the foreign-born population - Other Eastern Europe (%)
Place of birth for the foreign-born population - China (%)
Place of birth for the foreign-born population - Hong Kong (%)
Place of birth for the foreign-born population - Taiwan (%)
Place of birth for the foreign-born population - Japan (%)
Place of birth for the foreign-born population - Korea (%)
Place of birth for the foreign-born population - Other Eastern Asia (%)
Place of birth for the foreign-born population - Afghanistan (%)
Place of birth for the foreign-born population - Bangladesh (%)
Place of birth for the foreign-born population - India (%)
Place of birth for the foreign-born population - Iran (%)
Place of birth for the foreign-born population - Kazakhstan (%)
Place of birth for the foreign-born population - Nepal (%)
Place of birth for the foreign-born population - Pakistan (%)
Place of birth for the foreign-born population - Sri Lanka (%)
Place of birth for the foreign-born population - Uzbekistan (%)
Place of birth for the foreign-born population - Other South Central Asia (%)
Place of birth for the foreign-born population - Burma (%)
Place of birth for the foreign-born population - Cambodia (%)
Place of birth for the foreign-born population - Indonesia (%)
Place of birth for the foreign-born population - Laos (%)
Place of birth for the foreign-born population - Malaysia (%)
Place of birth for the foreign-born population - Philippines (%)
Place of birth for the foreign-born population - Singapore (%)
Place of birth for the foreign-born population - Thailand (%)
Place of birth for the foreign-born population - Vietnam (%)
Place of birth for the foreign-born population - Other South Eastern Asia (%)
Place of birth for the foreign-born population - Armenia (%)
Place of birth for the foreign-born population - Iraq (%)
Place of birth for the foreign-born population - Israel (%)
Place of birth for the foreign-born population - Jordan (%)
Place of birth for the foreign-born population - Kuwait (%)
Place of birth for the foreign-born population - Lebanon (%)
Place of birth for the foreign-born population - Saudi Arabia (%)
Place of birth for the foreign-born population - Syria (%)
Place of birth for the foreign-born population - Turkey (%)
Place of birth for the foreign-born population - Yemen (%)
Place of birth for the foreign-born population - Other Western Asia (%)
Place of birth for the foreign-born population - Eritrea (%)
Place of birth for the foreign-born population - Ethiopia (%)
Place of birth for the foreign-born population - Kenya (%)
Place of birth for the foreign-born population - Somalia (%)
Place of birth for the foreign-born population - Uganda (%)
Place of birth for the foreign-born population - Zimbabwe (%)
Place of birth for the foreign-born population - Other Eastern Africa (%)
Place of birth for the foreign-born population - Cameroon (%)
Place of birth for the foreign-born population - Congo (%)
Place of birth for the foreign-born population - Democratic Republic of Congo (Zaire) (%)
Place of birth for the foreign-born population - Other Middle Africa (%)
Place of birth for the foreign-born population - Egypt (%)
Place of birth for the foreign-born population - Morocco (%)
Place of birth for the foreign-born population - Sudan (%)
Place of birth for the foreign-born population - Other Northern Africa (%)
Place of birth for the foreign-born population - South Africa (%)
Place of birth for the foreign-born population - Other Southern Africa (%)
Place of birth for the foreign-born population - Cabo Verde (%)
Place of birth for the foreign-born population - Ghana (%)
Place of birth for the foreign-born population - Liberia (%)
Place of birth for the foreign-born population - Nigeria (%)
Place of birth for the foreign-born population - Senegal (%)
Place of birth for the foreign-born population - Sierra Leone (%)
Place of birth for the foreign-born population - Other Western Africa (%)
Place of birth for the foreign-born population - Australia (%)
Place of birth for the foreign-born population - New Zealand (%)
Place of birth for the foreign-born population - Fiji (%)
Place of birth for the foreign-born population - Micronesia (%)
Place of birth for the foreign-born population - Bahamas (%)
Place of birth for the foreign-born population - Barbados (%)
Place of birth for the foreign-born population - Cuba (%)
Place of birth for the foreign-born population - Dominica (%)
Place of birth for the foreign-born population - Dominican Republic (%)
Place of birth for the foreign-born population - Grenada (%)
Place of birth for the foreign-born population - Haiti (%)
Place of birth for the foreign-born population - Jamaica (%)
Place of birth for the foreign-born population - St. Vincent and the Grenadines (%)
Place of birth for the foreign-born population - Trinidad and Tobago (%)
Place of birth for the foreign-born population - West Indies (%)
Place of birth for the foreign-born population - Other Caribbean (%)
Place of birth for the foreign-born population - Belize (%)
Place of birth for the foreign-born population - Costa Rica (%)
Place of birth for the foreign-born population - El Salvador (%)
Place of birth for the foreign-born population - Guatemala (%)
Place of birth for the foreign-born population - Honduras (%)
Place of birth for the foreign-born population - Mexico (%)
Place of birth for the foreign-born population - Nicaragua (%)
Place of birth for the foreign-born population - Panama (%)
Place of birth for the foreign-born population - Other Central America (%)
Place of birth for the foreign-born population - Argentina (%)
Place of birth for the foreign-born population - Bolivia (%)
Place of birth for the foreign-born population - Brazil (%)
Place of birth for the foreign-born population - Chile (%)
Place of birth for the foreign-born population - Colombia (%)
Place of birth for the foreign-born population - Ecuador (%)
Place of birth for the foreign-born population - Guyana (%)
Place of birth for the foreign-born population - Peru (%)
Place of birth for the foreign-born population - Uruguay (%)
Place of birth for the foreign-born population - Venezuela (%)
Place of birth for the foreign-born population - Other South America (%)
Place of birth for the foreign-born population - Canada (%)
Place of birth for the foreign-born population - Other Northern America (%)
Place of birth for the foreign-born population - Other (%)
Latest news about races in Newport, KY collected exclusively by city-data.com from local newspapers, TV, and radio stations
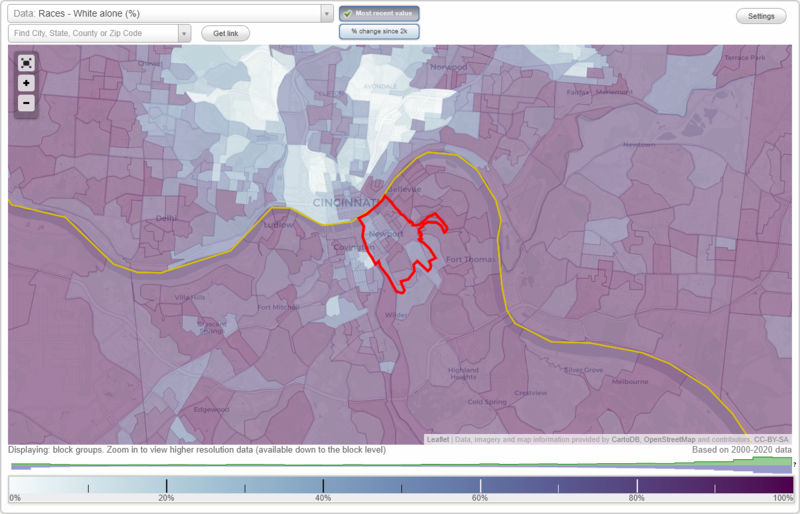
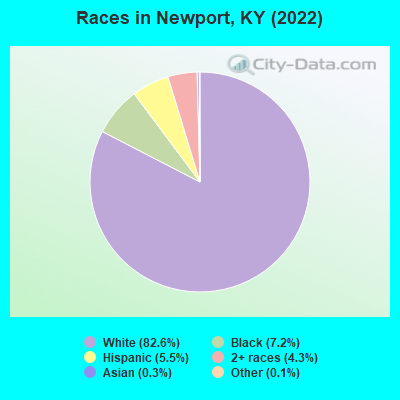
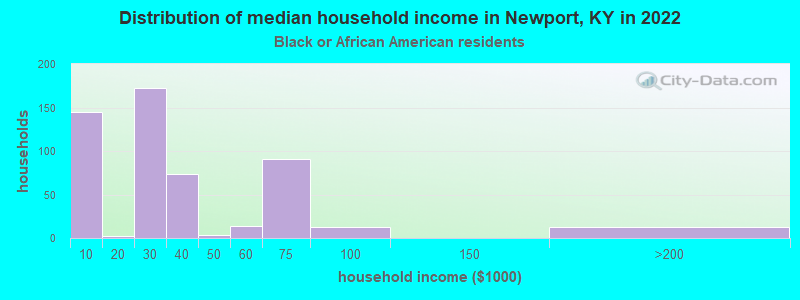
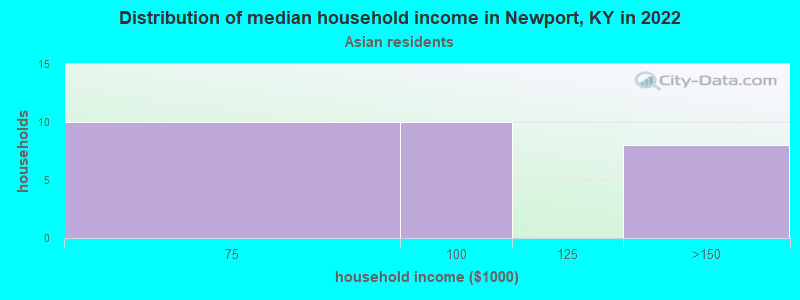
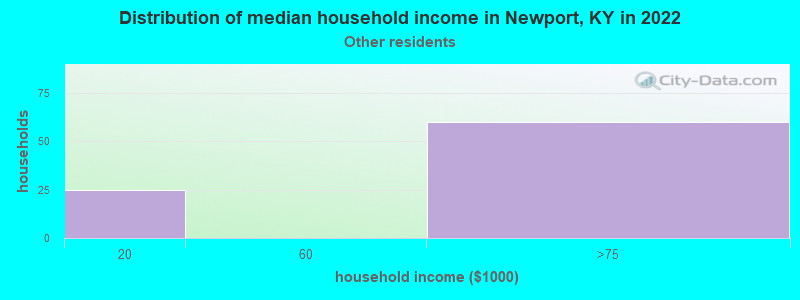
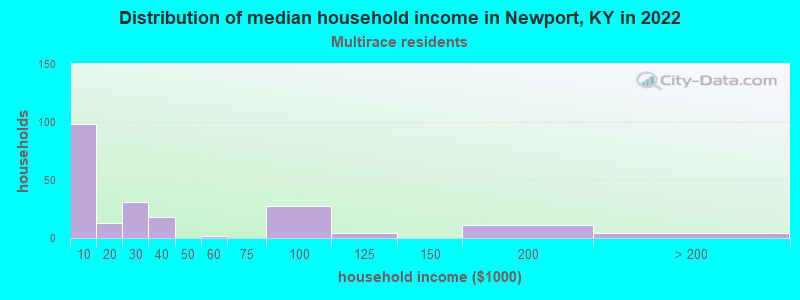
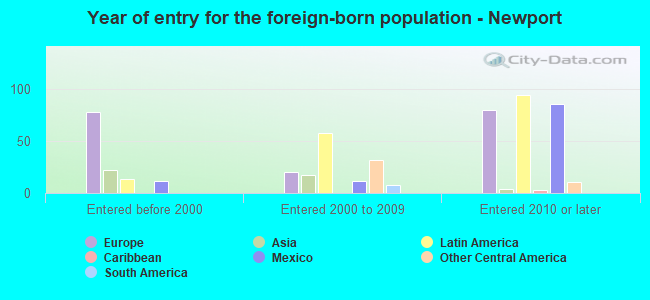
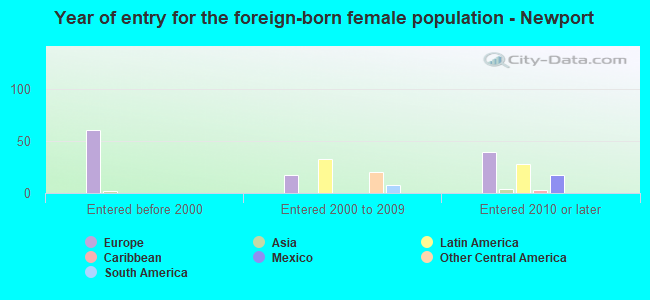
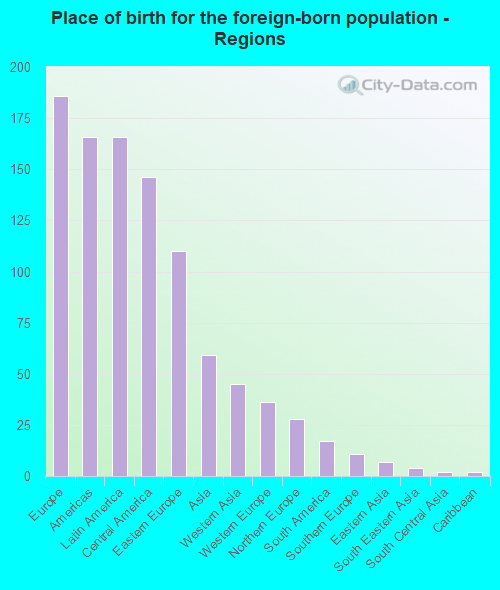
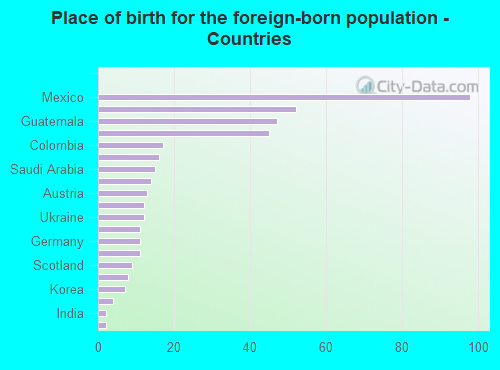
According to 2022 data, the most numerous races in Newport, KY are White alone (11,748 residents), Black alone (1,020 residents), and Hispanic (789 residents). 95.3% of Newport residents speak English at home. 2.9% of Newport, KY residents are foreign-born (1.3% born in Europe, 1.1% born in Latin America, 0.4% born in Asia), which is 38.0% less than the foreign-born rate of 4.0% across the entire state of Kentucky.
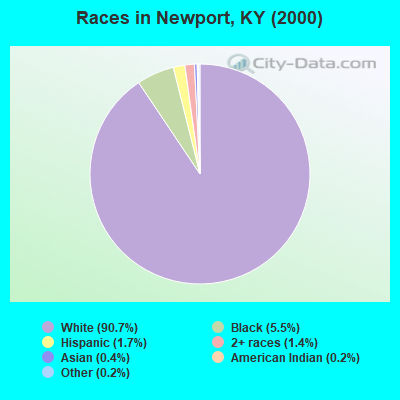
Race distribution in Newport
2000 2022
3,608,013 89.3% White alone 293,639 7.3% Black alone 59,939 1.5% Hispanic 37,750 0.9% Two or more races 29,368 0.7% Asian alone 7,939 0.2% American Indian alone 3,846 0.10% Other race alone 1,275 0.03% Native Hawaiian and Other
3,710,998 82.2% White alone 343,194 7.6% Black alone 187,483 4.2% Hispanic 187,394 4.2% Two or more races 62,240 1.4% Asian alone 13,529 0.3% Other race alone 4,302 0.10% American Indian alone 3,170 0.07% Native Hawaiian and Other
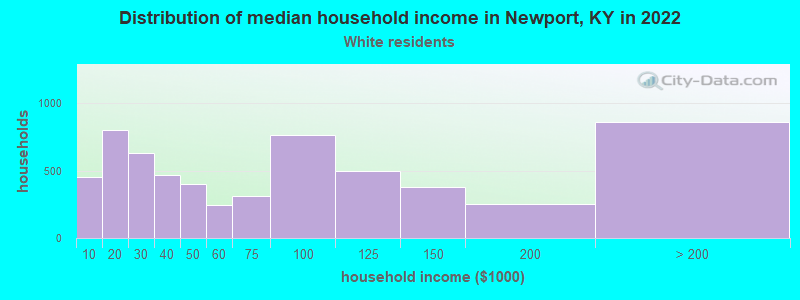
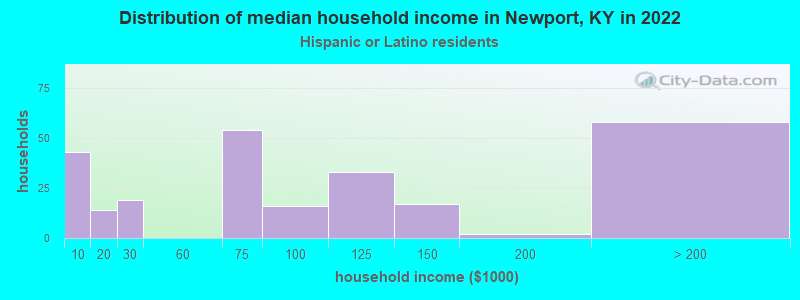
Income and house value in Newport Median household income in 2022 $53,875 White non-Hispanic householders$64,782 Black householders$81,962 Asian householders$35,038 Two or more races householders$57,858 Hispanic or Latino race householdersMedian 2022 house value $227,205 White Non-Hispanic householders$189,506 Black or African American householders$151,470 American Indian or Alaska Native householders $319,770 Asian householders$378,675 Two or more races householders
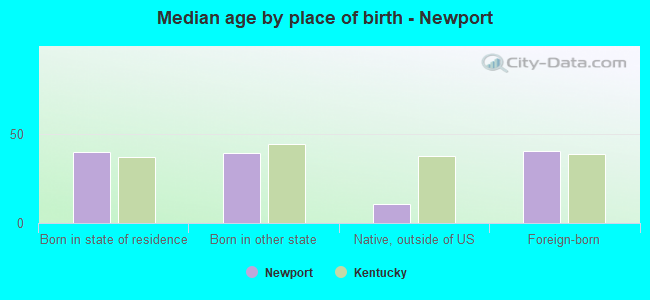
Median age by race in Newport
42.2 Median age for White residents38.2 47.1 33.3 Median age for Black or African American residents40.0 28.3 45.6 Median age for American Indian / Alaska Native residents-607,449,856.1 -630,065,358.8 29.5 Median age for Asian residents28.0 30.5 -666,666,666.0 Median age for Native Hawaiian / Pacific Islander residents-666,666,666.0 -666,666,666.0 26.0 Median age for Other race residents16.4 40.1 20.5 Median age for Two or more races residents21.4 17.8 42.3 Median age for White alone residents38.5 47.5 32.2 Median age for Hispanic or Latino residents31.0 23.1
Owner/renter occupied households by race in Newport
House owners and renters - White residents 3,279 53.8% Owner occupied2,813 46.2% Renter occupiedHouse owners and renters - Black or African American residents 20 4.3% Owner occupied438 95.7% Renter occupiedHouse owners and renters - American Indian / Alaska Native residents 16 100.0% Renter occupiedHouse owners and renters - Asian residents 9 37.0% Owner occupied15 63.0% Renter occupiedHouse owners and renters - Other race residents 43 62.8% Owner occupied26 37.2% Renter occupiedHouse owners and renters - Two or more races residents 29 25.2% Owner occupied85 74.8% Renter occupiedHouse owners and renters - White alone residents 3,244 54.5% Owner occupied2,708 45.5% Renter occupiedHouse owners and renters - Hispanic or Latino residents 92 27.4% Owner occupied243 72.6% Renter occupied
Language usage in Newport
English speakers - Total 95.3% of residents of Newport speak English at home.
3.0% of residents speak Spanish at home 277 69.1% Speak English very well124 30.9% Speak English less than very well1.7% of residents speak other language at home 196 88.3% Speak English very well26 11.7% Speak English less than very well
English speakers - Born in the United States 96.9% of residents of Newport speak English at home.
2.6% of residents speak Spanish at home 169 98.3% Speak English very well3 1.7% Speak English less than very well0.5% of residents speak other language at home 30 100.0% Speak English very well
English speakers - Native, born elsewhere 79.8% of residents of Newport speak English at home.
19.2% of residents speak Spanish at home 37 97.4% Speak English very well1 2.6% Speak English less than very well
English speakers - Foreign-born 35.4% of residents of Newport speak English at home.
25.8% of residents speak Spanish at home 3 2.9% Speak English very well99 97.1% Speak English less than very well39.6% of residents speak other language at home 131 83.4% Speak English very well26 16.6% Speak English less than very well
White (Caucasian) - Speak only English Native:
98.3% (11,033)Foreign-born:
52.3% (162)
White (Caucasian) - Speak another language Native:
1.4% (159)Foreign-born:
40.8% (126)
Asian - Speak only English Native:
79.4% (46)Foreign-born:
72.8% (9)
Asian - Speak another language Native:
7.2% (4)Foreign-born:
30.5% (4)
Other race - Speak only English Native:
51.9% (98)Foreign-born:
2.3% (3)
Other race - Speak another language Native:
47.1% (89)Foreign-born:
96.6% (118)
Two or more races - Speak only English Native:
95.2% (437)Foreign-born:
100.0% (61)
Two or more races - Speak another language Native:
4.1% (19)Foreign-born:
4.7% (3)
White alone - Speak only English Native:
99.7% (10,994)Foreign-born:
45.7% (168)
White alone - Speak another language Native:
0.4% (49)Foreign-born:
46.1% (169)
Hispanic or Latino - Speak only English Native:
46.1% (242)Foreign-born:
27.3% (40)
Hispanic or Latino - Speak another language Native:
53.2% (279)Foreign-born:
71.8% (105)
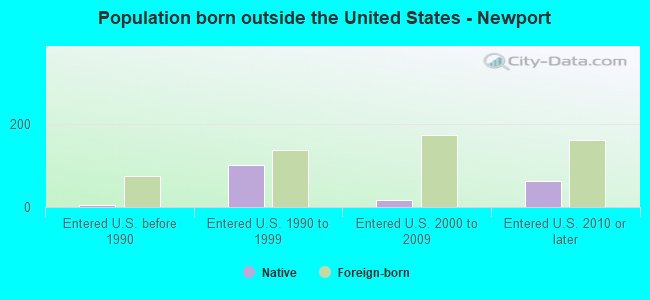
Foreign-born residents in Newport 412 residents are foreign born (1.3% Europe , 1.1% Latin America , 0.4% Asia ).
This city:
2.9%Kentucky:
4.1%
Marital status for residents in Newport Marital status - White (Caucasian) population 15 years and over
Males 41.2% Never married41.1% Now married0.4% Separated2.0% Widowed15.4% DivorcedFemales 24.9% Never married43.7% Now married1.0% Separated12.0% Widowed18.4% DivorcedWomen who gave birth in the past 12 months Now married:
74.0% (170)Unmarried:
26.0% (60)
Women who did not give birth in the past 12 months Now married:
47.1% (1,125)Unmarried:
52.9% (1,265)
Marital status - Black or African American population 15 years and over
Males 69.5% Never married9.6% Now married3.0% Separated1.8% Widowed16.0% DivorcedFemales 77.4% Never married10.9% Now married2.8% Separated3.9% Widowed5.0% DivorcedWomen who gave birth in the past 12 months Now married:
0.0% (0)Unmarried:
100.0% (23)
Women who did not give birth in the past 12 months Now married:
6.3% (16)Unmarried:
93.7% (241)
Marital status - American Indian / Alaska Native population 15 years and over
Males 0.0% Never married29.4% Now married0.0% Separated0.0% Widowed70.6% DivorcedFemales 0.0% Never married0.0% Now married0.0% Separated0.0% Widowed100.0% DivorcedWomen who did not give birth in the past 12 months Now married:
0.0% (0)Unmarried:
100.0% (1)
Marital status - Asian population 15 years and over
Males 54.3% Never married45.7% Now married0.0% Separated0.0% Widowed0.0% DivorcedFemales 0.0% Never married100.0% Now married0.0% Separated0.0% Widowed0.0% DivorcedWomen who did not give birth in the past 12 months Now married:
100.0% (7)Unmarried:
0.0% (0)
Marital status - Other race population 15 years and over
Males 92.7% Never married7.3% Now married0.0% Separated0.0% Widowed0.0% DivorcedFemales 33.3% Never married40.5% Now married0.0% Separated26.1% Widowed0.0% DivorcedWomen who did not give birth in the past 12 months Now married:
53.8% (57)Unmarried:
46.2% (49)
Marital status - Two or more races population 15 years and over
Males 38.0% Never married26.7% Now married29.4% Separated4.8% Widowed1.1% DivorcedFemales 53.3% Never married14.8% Now married0.0% Separated2.5% Widowed29.5% DivorcedWomen who gave birth in the past 12 months Now married:
0.0% (0)Unmarried:
100.0% (1)
Women who did not give birth in the past 12 months Now married:
21.1% (23)Unmarried:
78.9% (86)
Marital status - White alone, not Hispanic / Latino population 15 years and over
Males 41.7% Never married40.3% Now married0.4% Separated2.1% Widowed15.5% DivorcedFemales 24.4% Never married44.2% Now married1.0% Separated11.7% Widowed18.7% DivorcedWomen who gave birth in the past 12 months Now married:
74.0% (172)Unmarried:
26.0% (60)
Women who did not give birth in the past 12 months Now married:
47.6% (1,114)Unmarried:
52.4% (1,224)
Marital status - Hispanic or Latino population 15 years and over
Males 36.1% Never married46.5% Now married13.4% Separated0.0% Widowed4.0% DivorcedFemales 44.0% Never married29.9% Now married0.0% Separated24.4% Widowed1.7% DivorcedWomen who did not give birth in the past 12 months Now married:
38.2% (72)Unmarried:
61.8% (116)
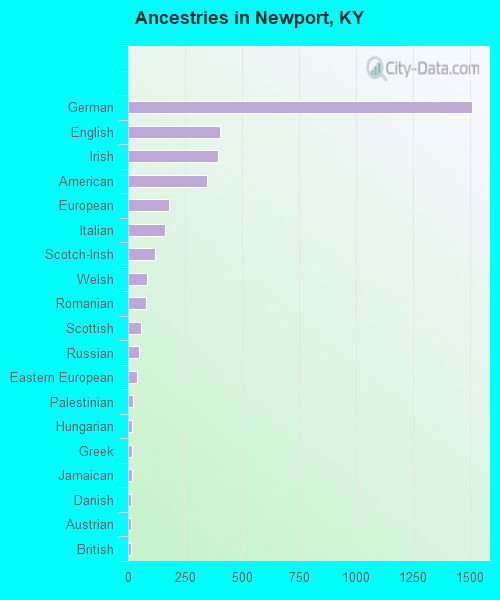
Ancestries in Newport
1,510 29.0% German404 7.8% English396 7.6% Irish347 6.7% American182 3.5% European162 3.1% Italian117 2.2% Scotch-Irish82 1.6% Welsh78 1.5% Romanian55 1.1% Scottish47 0.9% Russian39 0.7% Eastern European20 0.4% Palestinian17 0.3% Hungarian16 0.3% Greek16 0.3% Jamaican15 0.3% Danish14 0.3% Austrian14 0.3% British12 0.2% Carpatho Rusyn12 0.2% French12 0.2% Norwegian10 0.2% Dutch6 0.1% Polish5 0.10% Northern European4 0.08% Ukrainian3 0.06% Swedish
Children Nativity (place of birth) in Newport
Children under 6 years - Living with two parents Both parents native 413 100.0% NativeOne native, one foreign-born parent 91 100.0% NativeChildren under 6 years - Living with one parent Native parent 292 100.0% NativeForeign-born parent 40 100.0% NativeChildren 6 to 17 years - Living with two parents Both parents native 657 100.0% NativeOne native, one foreign-born parent 24 100.0% NativeChildren 6 to 17 years - Living with one parent Native parent 473 100.0% NativeForeign-born parent 58 55.3% Native47 44.7% Foreign-born
Grandparents responsible for own grandchildren in Newport
Grandparents (30 to 59 years) White / Caucasian 86 87.3% Responsible for grandchildren12 12.7% Not responsible for grandchildrenBlack or African American 12 100.0% Responsible for grandchildrenAmerican Indian / Alaska Native 1 100.0% Not responsible for grandchildrenTwo or more races 1 66.8% Not responsible for grandchildrenWhite alone, not Hispanic / Latino 86 87.2% Responsible for grandchildren13 12.8% Not responsible for grandchildren
Grandparents (60 years and over) White / Caucasian 34 100.0% Not responsible for grandchildrenWhite alone, not Hispanic / Latino 34 100.0% Not responsible for grandchildren