Races in Niceville, Florida (FL) Detailed Stats
Data:
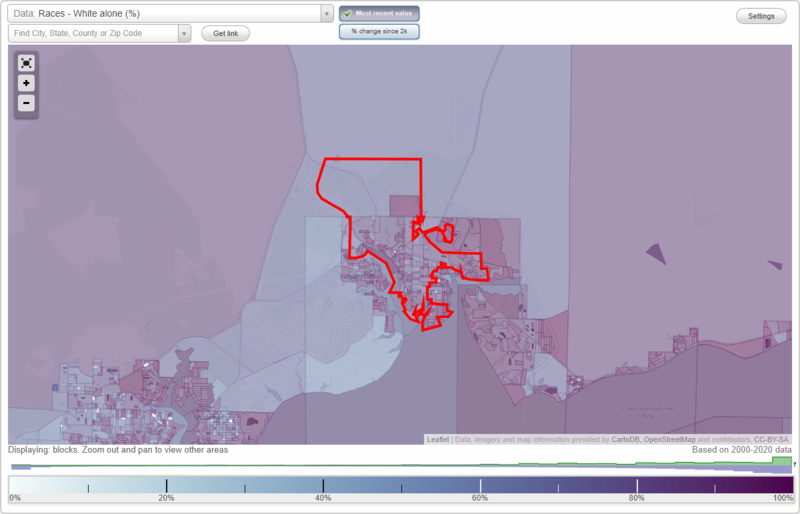
Races - White alone (%)
Races - White alone (% change since 2000)
Races - Black alone (%)
Races - Black alone (% change since 2000)
Races - American Indian alone (%)
Races - American Indian alone (% change since 2000)
Races - Asian alone (%)
Races - Asian alone (% change since 2000)
Races - Hispanic (%)
Races - Hispanic (% change since 2000)
Races - Native Hawaiian and Other Pacific Islander alone (%)
Races - Native Hawaiian and Other Pacific Islander alone (% change since 2000)
Races - Two or more races(%)
Races - Two or more races(% change since 2000)
Races - Other race alone (%)
Races - Other race alone (% change since 2000)
Racial diversity
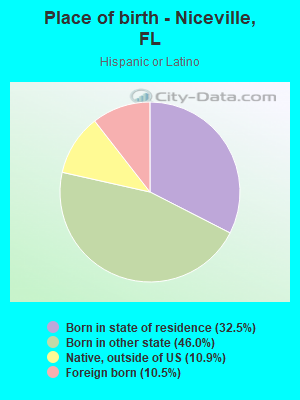
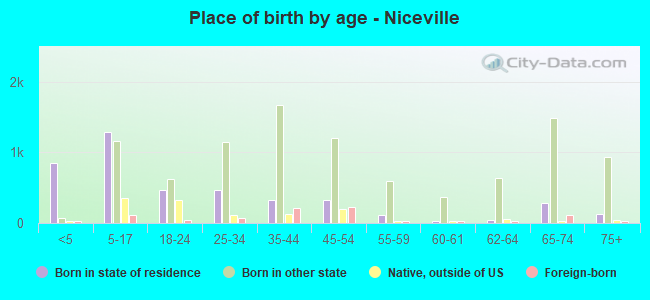
Place of birth - Born in state of residence (%)
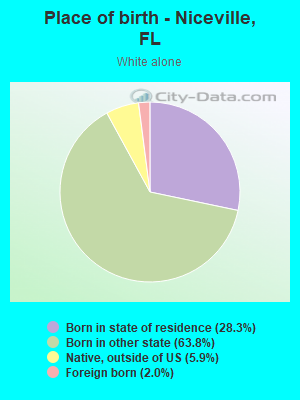
Place of birth - Born in state of residence (%) - White
Place of birth - Born in state of residence (%) - Black or African American
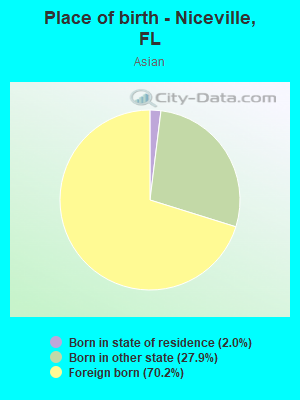
Place of birth - Born in state of residence (%) - Asian
Place of birth - Born in state of residence (%) - Hispanic or Latino
Place of birth - Born in state of residence (%) - American Indian and Alaska Native
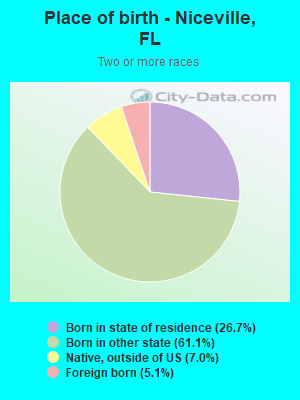
Place of birth - Born in state of residence (%) - Multirace
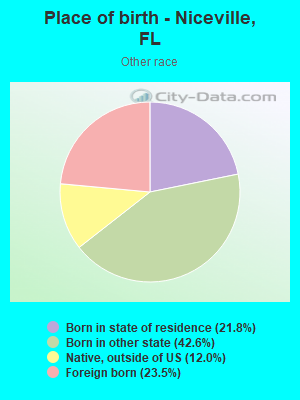
Place of birth - Born in state of residence (%) - Other Race
Place of birth - Born in other state (%)
Place of birth - Born in other state (%) - White
Place of birth - Born in other state (%) - Black or African American
Place of birth - Born in other state (%) - Asian
Place of birth - Born in other state (%) - Hispanic or Latino
Place of birth - Born in other state (%) - American Indian and Alaska Native
Place of birth - Born in other state (%) - Multirace
Place of birth - Born in other state (%) - Other Race
Place of birth - Native, outside of US (%)
Place of birth - Native, outside of US (%) - White
Place of birth - Native, outside of US (%) - Black or African American
Place of birth - Native, outside of US (%) - Asian
Place of birth - Native, outside of US (%) - Hispanic or Latino
Place of birth - Native, outside of US (%) - American Indian and Alaska Native
Place of birth - Native, outside of US (%) - Multirace
Place of birth - Native, outside of US (%) - Other Race
Place of birth - Foreign born (%)
Place of birth - Foreign born (%) - White
Place of birth - Foreign born (%) - Black or African American
Place of birth - Foreign born (%) - Asian
Place of birth - Foreign born (%) - Hispanic or Latino
Place of birth - Foreign born (%) - American Indian and Alaska Native
Place of birth - Foreign born (%) - Multirace
Place of birth - Foreign born (%) - Other Race
Residents speaking English at home (%)
Residents speaking English at home - Born in the United States (%)
Residents speaking English at home - Native, born elsewhere (%)
Residents speaking English at home - Foreign born (%)
Residents speaking Spanish at home (%)
Residents speaking Spanish at home - Born in the United States (%)
Residents speaking Spanish at home - Native, born elsewhere (%)
Residents speaking Spanish at home - Foreign born (%)
Residents speaking other language at home (%)
Residents speaking other language at home - Born in the United States (%)
Residents speaking other language at home - Native, born elsewhere (%)
Residents speaking other language at home - Foreign born (%)
Marital status - Never married (%)
Marital status - Now married (%)
Marital status - Separated (%)
Marital status - Widowed (%)
Marital status - Divorced (%)
Ancestries Reported - Arab (%)
Ancestries Reported - Czech (%)
Ancestries Reported - Danish (%)
Ancestries Reported - Dutch (%)
Ancestries Reported - English (%)
Ancestries Reported - French (%)
Ancestries Reported - French Canadian (%)
Ancestries Reported - German (%)
Ancestries Reported - Greek (%)
Ancestries Reported - Hungarian (%)
Ancestries Reported - Irish (%)
Ancestries Reported - Italian (%)
Ancestries Reported - Lithuanian (%)
Ancestries Reported - Norwegian (%)
Ancestries Reported - Polish (%)
Ancestries Reported - Portuguese (%)
Ancestries Reported - Russian (%)
Ancestries Reported - Scotch-Irish (%)
Ancestries Reported - Scottish (%)
Ancestries Reported - Slovak (%)
Ancestries Reported - Subsaharan African (%)
Ancestries Reported - Swedish (%)
Ancestries Reported - Swiss (%)
Ancestries Reported - Ukrainian (%)
Ancestries Reported - United States (%)
Ancestries Reported - Welsh (%)
Ancestries Reported - West Indian (%)
Ancestries Reported - Other (%)
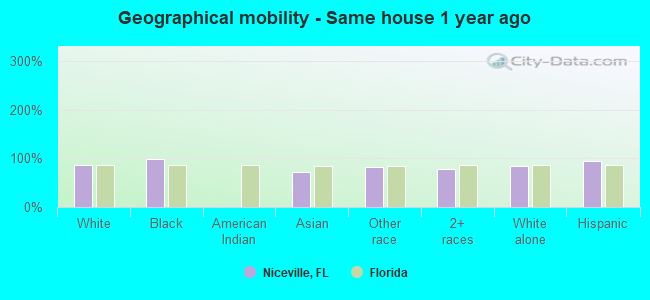
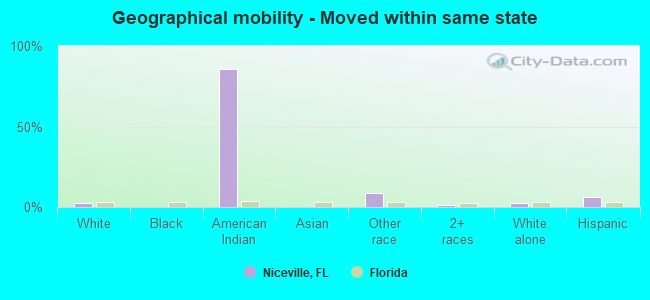
Geographical mobility - Same house 1 year ago (%)
Geographical mobility - Same house 1 year ago (%) - White
Geographical mobility - Same house 1 year ago (%) - Black or African American
Geographical mobility - Same house 1 year ago (%) - Asian
Geographical mobility - Same house 1 year ago (%) - Hispanic or Latino
Geographical mobility - Same house 1 year ago (%) - American Indian and Alaska Native
Geographical mobility - Same house 1 year ago (%) - Multirace
Geographical mobility - Same house 1 year ago (%) - Other Race
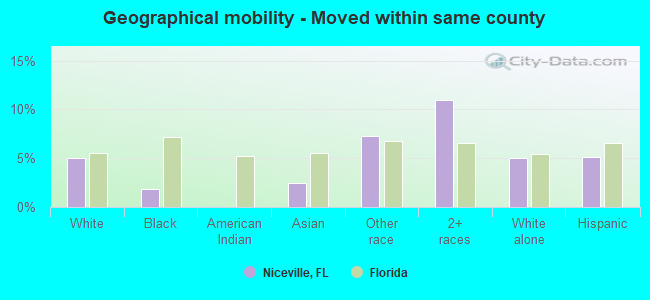
Geographical mobility - Moved within same county (%)
Geographical mobility - Moved within same county (%) - White
Geographical mobility - Moved within same county (%) - Black or African American
Geographical mobility - Moved within same county (%) - Asian
Geographical mobility - Moved within same county (%) - Hispanic or Latino
Geographical mobility - Moved within same county (%) - American Indian and Alaska Native
Geographical mobility - Moved within same county (%) - Multirace
Geographical mobility - Moved within same county (%) - Other Race
Geographical mobility - Moved from different county within same state (%)
Geographical mobility - Moved from different county within same state (%) - White
Geographical mobility - Moved from different county within same state (%) - Black or African American
Geographical mobility - Moved from different county within same state (%) - Asian
Geographical mobility - Moved from different county within same state (%) - Hispanic or Latino
Geographical mobility - Moved from different county within same state (%) - American Indian and Alaska Native
Geographical mobility - Moved from different county within same state (%) - Multirace
Geographical mobility - Moved from different county within same state (%) - Other Race
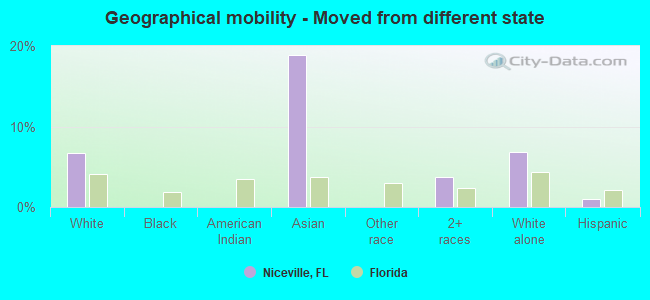
Geographical mobility - Moved from different state (%)
Geographical mobility - Moved from different state (%) - White
Geographical mobility - Moved from different state (%) - Black or African American
Geographical mobility - Moved from different state (%) - Asian
Geographical mobility - Moved from different state (%) - Hispanic or Latino
Geographical mobility - Moved from different state (%) - American Indian and Alaska Native
Geographical mobility - Moved from different state (%) - Multirace
Geographical mobility - Moved from different state (%) - Other Race
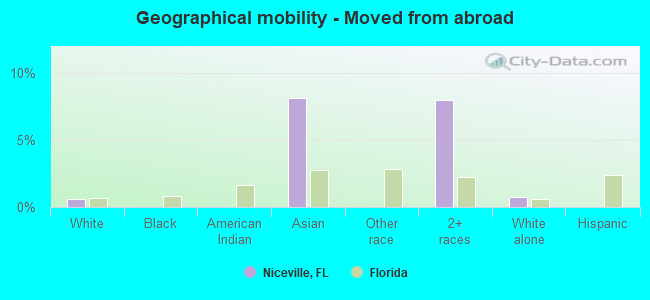
Geographical mobility - Moved from abroad (%)
Geographical mobility - Moved from abroad (%) - White
Geographical mobility - Moved from abroad (%) - Black or African American
Geographical mobility - Moved from abroad (%) - Asian
Geographical mobility - Moved from abroad (%) - Hispanic or Latino
Geographical mobility - Moved from abroad (%) - American Indian and Alaska Native
Geographical mobility - Moved from abroad (%) - Multirace
Geographical mobility - Moved from abroad (%) - Other Race
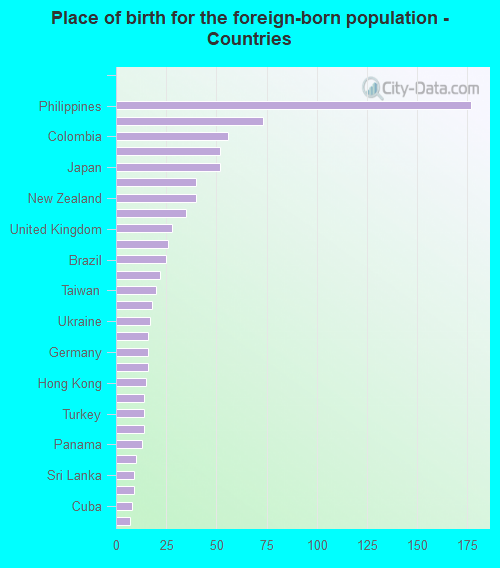
Place of birth for the foreign-born population - Ireland (%)
Place of birth for the foreign-born population - Denmark (%)
Place of birth for the foreign-born population - Norway (%)
Place of birth for the foreign-born population - Sweden (%)
Place of birth for the foreign-born population - United Kingdom (%)
Place of birth for the foreign-born population - England (%)
Place of birth for the foreign-born population - Scotland (%)
Place of birth for the foreign-born population - Other Northern Europe (%)
Place of birth for the foreign-born population - Austria (%)
Place of birth for the foreign-born population - Belgium (%)
Place of birth for the foreign-born population - France (%)
Place of birth for the foreign-born population - Germany (%)
Place of birth for the foreign-born population - Netherlands (%)
Place of birth for the foreign-born population - Switzerland (%)
Place of birth for the foreign-born population - Other Western Europe (%)
Place of birth for the foreign-born population - Greece (%)
Place of birth for the foreign-born population - Italy (%)
Place of birth for the foreign-born population - Portugal (%)
Place of birth for the foreign-born population - Spain (%)
Place of birth for the foreign-born population - Other Southern Europe (%)
Place of birth for the foreign-born population - Albania (%)
Place of birth for the foreign-born population - Belarus (%)
Place of birth for the foreign-born population - Bosnia and Herzegovina (%)
Place of birth for the foreign-born population - Bulgaria (%)
Place of birth for the foreign-born population - Croatia (%)
Place of birth for the foreign-born population - Czechoslovakia (%)
Place of birth for the foreign-born population - Hungary (%)
Place of birth for the foreign-born population - Latvia (%)
Place of birth for the foreign-born population - Lithuania (%)
Place of birth for the foreign-born population - North Macedonia (Macedonia) (%)
Place of birth for the foreign-born population - Moldova (%)
Place of birth for the foreign-born population - Poland (%)
Place of birth for the foreign-born population - Romania (%)
Place of birth for the foreign-born population - Russia (%)
Place of birth for the foreign-born population - Serbia (%)
Place of birth for the foreign-born population - Ukraine (%)
Place of birth for the foreign-born population - Other Eastern Europe (%)
Place of birth for the foreign-born population - China (%)
Place of birth for the foreign-born population - Hong Kong (%)
Place of birth for the foreign-born population - Taiwan (%)
Place of birth for the foreign-born population - Japan (%)
Place of birth for the foreign-born population - Korea (%)
Place of birth for the foreign-born population - Other Eastern Asia (%)
Place of birth for the foreign-born population - Afghanistan (%)
Place of birth for the foreign-born population - Bangladesh (%)
Place of birth for the foreign-born population - India (%)
Place of birth for the foreign-born population - Iran (%)
Place of birth for the foreign-born population - Kazakhstan (%)
Place of birth for the foreign-born population - Nepal (%)
Place of birth for the foreign-born population - Pakistan (%)
Place of birth for the foreign-born population - Sri Lanka (%)
Place of birth for the foreign-born population - Uzbekistan (%)
Place of birth for the foreign-born population - Other South Central Asia (%)
Place of birth for the foreign-born population - Burma (%)
Place of birth for the foreign-born population - Cambodia (%)
Place of birth for the foreign-born population - Indonesia (%)
Place of birth for the foreign-born population - Laos (%)
Place of birth for the foreign-born population - Malaysia (%)
Place of birth for the foreign-born population - Philippines (%)
Place of birth for the foreign-born population - Singapore (%)
Place of birth for the foreign-born population - Thailand (%)
Place of birth for the foreign-born population - Vietnam (%)
Place of birth for the foreign-born population - Other South Eastern Asia (%)
Place of birth for the foreign-born population - Armenia (%)
Place of birth for the foreign-born population - Iraq (%)
Place of birth for the foreign-born population - Israel (%)
Place of birth for the foreign-born population - Jordan (%)
Place of birth for the foreign-born population - Kuwait (%)
Place of birth for the foreign-born population - Lebanon (%)
Place of birth for the foreign-born population - Saudi Arabia (%)
Place of birth for the foreign-born population - Syria (%)
Place of birth for the foreign-born population - Turkey (%)
Place of birth for the foreign-born population - Yemen (%)
Place of birth for the foreign-born population - Other Western Asia (%)
Place of birth for the foreign-born population - Eritrea (%)
Place of birth for the foreign-born population - Ethiopia (%)
Place of birth for the foreign-born population - Kenya (%)
Place of birth for the foreign-born population - Somalia (%)
Place of birth for the foreign-born population - Uganda (%)
Place of birth for the foreign-born population - Zimbabwe (%)
Place of birth for the foreign-born population - Other Eastern Africa (%)
Place of birth for the foreign-born population - Cameroon (%)
Place of birth for the foreign-born population - Congo (%)
Place of birth for the foreign-born population - Democratic Republic of Congo (Zaire) (%)
Place of birth for the foreign-born population - Other Middle Africa (%)
Place of birth for the foreign-born population - Egypt (%)
Place of birth for the foreign-born population - Morocco (%)
Place of birth for the foreign-born population - Sudan (%)
Place of birth for the foreign-born population - Other Northern Africa (%)
Place of birth for the foreign-born population - South Africa (%)
Place of birth for the foreign-born population - Other Southern Africa (%)
Place of birth for the foreign-born population - Cabo Verde (%)
Place of birth for the foreign-born population - Ghana (%)
Place of birth for the foreign-born population - Liberia (%)
Place of birth for the foreign-born population - Nigeria (%)
Place of birth for the foreign-born population - Senegal (%)
Place of birth for the foreign-born population - Sierra Leone (%)
Place of birth for the foreign-born population - Other Western Africa (%)
Place of birth for the foreign-born population - Australia (%)
Place of birth for the foreign-born population - New Zealand (%)
Place of birth for the foreign-born population - Fiji (%)
Place of birth for the foreign-born population - Micronesia (%)
Place of birth for the foreign-born population - Bahamas (%)
Place of birth for the foreign-born population - Barbados (%)
Place of birth for the foreign-born population - Cuba (%)
Place of birth for the foreign-born population - Dominica (%)
Place of birth for the foreign-born population - Dominican Republic (%)
Place of birth for the foreign-born population - Grenada (%)
Place of birth for the foreign-born population - Haiti (%)
Place of birth for the foreign-born population - Jamaica (%)
Place of birth for the foreign-born population - St. Vincent and the Grenadines (%)
Place of birth for the foreign-born population - Trinidad and Tobago (%)
Place of birth for the foreign-born population - West Indies (%)
Place of birth for the foreign-born population - Other Caribbean (%)
Place of birth for the foreign-born population - Belize (%)
Place of birth for the foreign-born population - Costa Rica (%)
Place of birth for the foreign-born population - El Salvador (%)
Place of birth for the foreign-born population - Guatemala (%)
Place of birth for the foreign-born population - Honduras (%)
Place of birth for the foreign-born population - Mexico (%)
Place of birth for the foreign-born population - Nicaragua (%)
Place of birth for the foreign-born population - Panama (%)
Place of birth for the foreign-born population - Other Central America (%)
Place of birth for the foreign-born population - Argentina (%)
Place of birth for the foreign-born population - Bolivia (%)
Place of birth for the foreign-born population - Brazil (%)
Place of birth for the foreign-born population - Chile (%)
Place of birth for the foreign-born population - Colombia (%)
Place of birth for the foreign-born population - Ecuador (%)
Place of birth for the foreign-born population - Guyana (%)
Place of birth for the foreign-born population - Peru (%)
Place of birth for the foreign-born population - Uruguay (%)
Place of birth for the foreign-born population - Venezuela (%)
Place of birth for the foreign-born population - Other South America (%)
Place of birth for the foreign-born population - Canada (%)
Place of birth for the foreign-born population - Other Northern America (%)
Place of birth for the foreign-born population - Other (%)
Latest news about races in Niceville, FL collected exclusively by city-data.com from local newspapers, TV, and radio stations
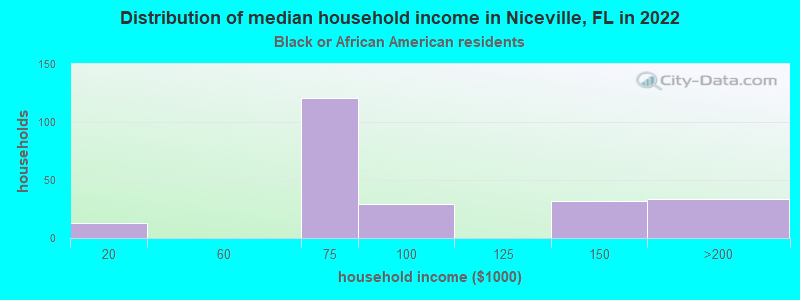
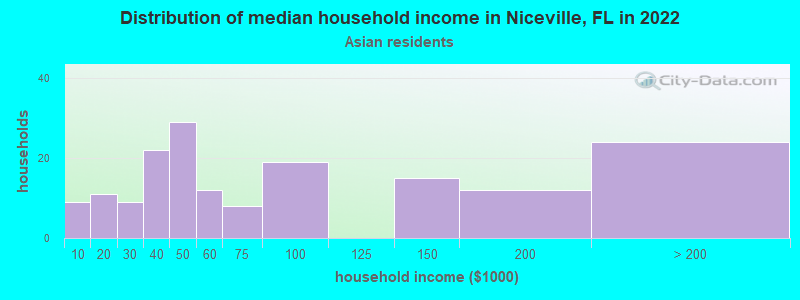
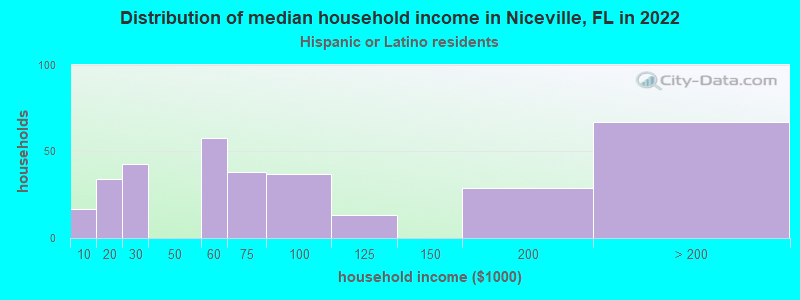
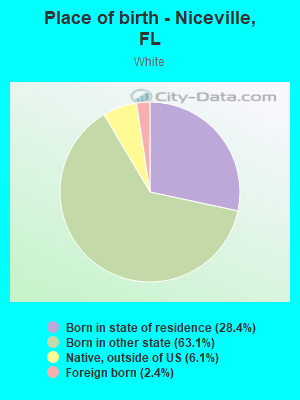
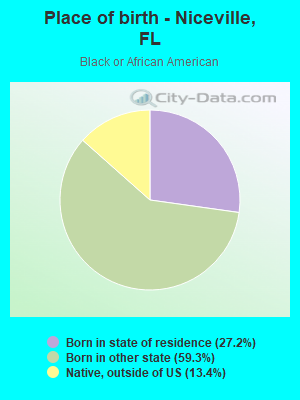
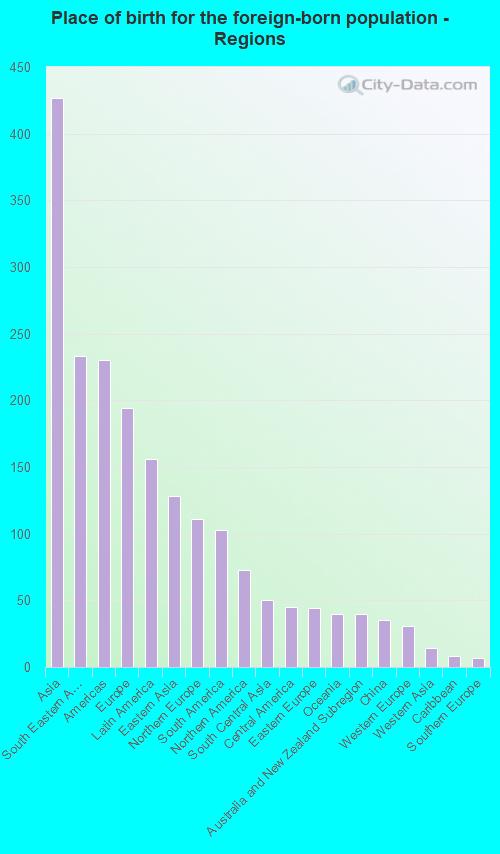
According to 2022 data, the most numerous races in Niceville, FL are White alone (12,472 residents), Hispanic (959 residents), and Black alone (1,101 residents). 93.1% of Niceville residents speak English at home. 5.5% of Niceville, FL residents are foreign-born (2.6% born in Asia, 1.2% born in Europe, 0.9% born in Latin America), which is 279.1% less than the foreign-born rate of 21.0% across the entire state of Florida.
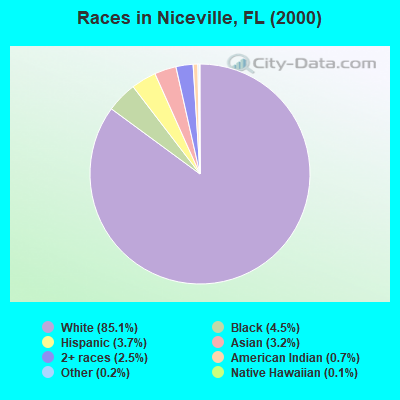
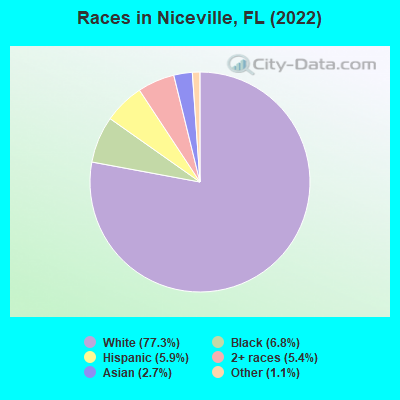
Race distribution in Niceville
2000 2022
10,458,509 65.4% White alone 2,682,715 16.8% Hispanic 2,264,268 14.2% Black alone 261,693 1.6% Asian alone 236,954 1.5% Two or more races 42,358 0.3% American Indian alone 28,994 0.2% Other race alone 6,887 0.04% Native Hawaiian and Other
11,309,403 50.8% White alone 6,025,039 27.1% Hispanic 3,241,015 14.6% Black alone 861,630 3.9% Two or more races 623,692 2.8% Asian alone 152,054 0.7% Other race alone 22,504 0.1% American Indian alone 9,486 0.04% Native Hawaiian and Other
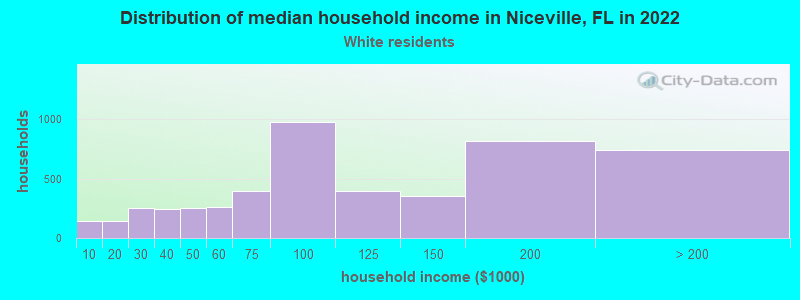
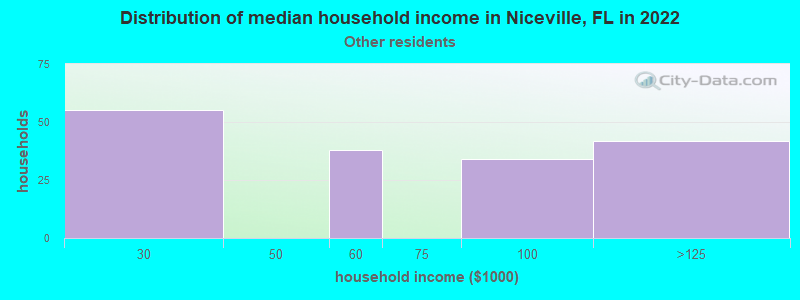
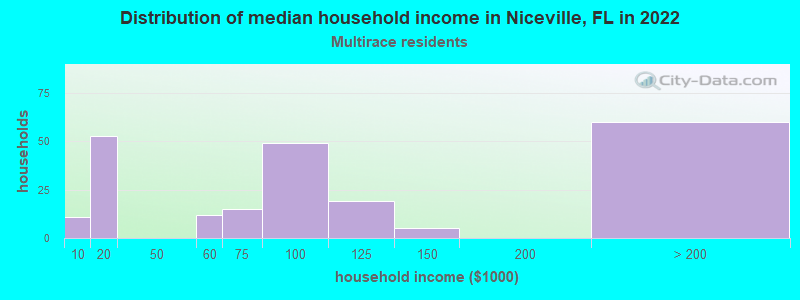
Income and house value in Niceville Median household income in 2022 $98,387 White non-Hispanic householders$80,823 Black householders$75,666 Asian householders$59,924 Some other race householders$81,949 Two or more races householders$62,235 Hispanic or Latino race householdersMedian 2022 house value $431,440 White Non-Hispanic householders$483,461 Black or African American householders $380,245 Asian householders$392,218 Some other race householders$397,998 Two or more races householders$438,872 Hispanic or Latino householders
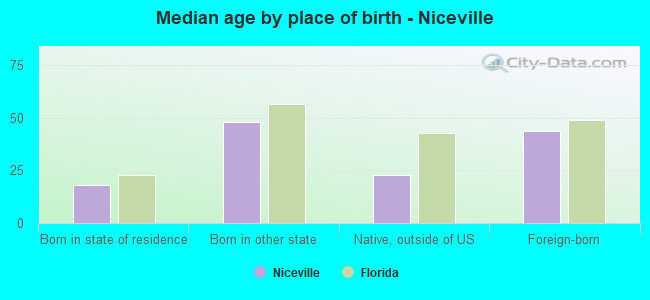
Median age by race in Niceville
42.0 Median age for White residents41.7 43.8 17.8 Median age for Black or African American residents33.0 14.9 -598,566,307.6 Median age for American Indian / Alaska Native residents-611,418,047.3 -594,925,633.7 37.3 Median age for Asian residents17.2 40.2 -570,491,802.7 Median age for Native Hawaiian / Pacific Islander residents-588,888,888.3 -402,088,772.4 27.1 Median age for Other race residents27.5 33.3 28.2 Median age for Two or more races residents17.6 40.2 43.3 Median age for White alone residents42.0 43.9 30.9 Median age for Hispanic or Latino residents33.0 30.2
Owner/renter occupied households by race in Niceville
House owners and renters - White residents 3,747 74.8% Owner occupied1,261 25.2% Renter occupiedHouse owners and renters - Black or African American residents 155 61.0% Owner occupied99 39.0% Renter occupiedHouse owners and renters - American Indian / Alaska Native residents 14 100.0% Renter occupiedHouse owners and renters - Asian residents 96 51.4% Owner occupied91 48.6% Renter occupiedHouse owners and renters - Other race residents 66 43.1% Owner occupied87 56.9% Renter occupiedHouse owners and renters - Two or more races residents 180 81.7% Owner occupied40 18.3% Renter occupiedHouse owners and renters - White alone residents 3,621 74.3% Owner occupied1,250 25.7% Renter occupiedHouse owners and renters - Hispanic or Latino residents 190 58.6% Owner occupied134 41.4% Renter occupied
Language usage in Niceville
English speakers - Total 93.1% of residents of Niceville speak English at home.
3.8% of residents speak Spanish at home 464 79.2% Speak English very well122 20.8% Speak English less than very well3.0% of residents speak other language at home 308 67.2% Speak English very well150 32.8% Speak English less than very well
English speakers - Born in the United States 98.1% of residents of Niceville speak English at home.
2.1% of residents speak Spanish at home 174 83.3% Speak English very well35 16.7% Speak English less than very well0.3% of residents speak other language at home 31 100.0% Speak English very well
English speakers - Native, born elsewhere 72.3% of residents of Niceville speak English at home.
22.3% of residents speak Spanish at home 213 80.7% Speak English very well51 19.3% Speak English less than very well4.6% of residents speak other language at home 55 100.0% Speak English very well
English speakers - Foreign-born 40.9% of residents of Niceville speak English at home.
9.1% of residents speak Spanish at home 27 35.5% Speak English very well49 64.5% Speak English less than very well46.9% of residents speak other language at home 239 60.8% Speak English very well154 39.2% Speak English less than very well
White (Caucasian) - Speak only English Native:
96.3% (11,641)Foreign-born:
56.2% (172)
White (Caucasian) - Speak another language Native:
2.8% (340)Foreign-born:
42.2% (129)
Asian - Speak only English Native:
100.0% (116)Foreign-born:
12.0% (40)
Asian - Speak another language Native:
23.8% (28)Foreign-born:
86.9% (289)
Other race - Speak only English Native:
57.7% (174)Foreign-born:
34.8% (34)
Other race - Speak another language Native:
13.2% (40)Foreign-born:
78.6% (78)
Two or more races - Speak only English Native:
100.0% (925)Foreign-born:
77.3% (46)
Two or more races - Speak another language Native:
1.2% (11)Foreign-born:
51.8% (31)
White alone - Speak only English Native:
97.5% (11,482)Foreign-born:
70.1% (178)
White alone - Speak another language Native:
2.1% (252)Foreign-born:
32.5% (82)
Hispanic or Latino - Speak only English Native:
59.8% (423)Foreign-born:
56.3% (59)
Hispanic or Latino - Speak another language Native:
40.2% (285)Foreign-born:
61.0% (63)
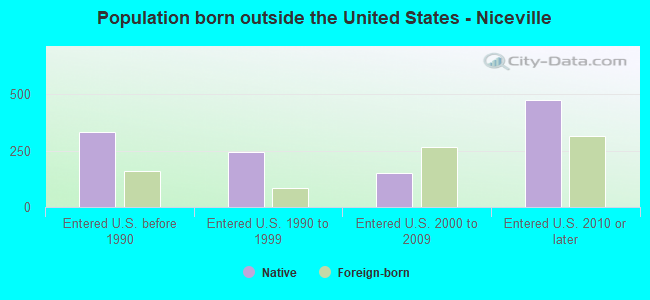
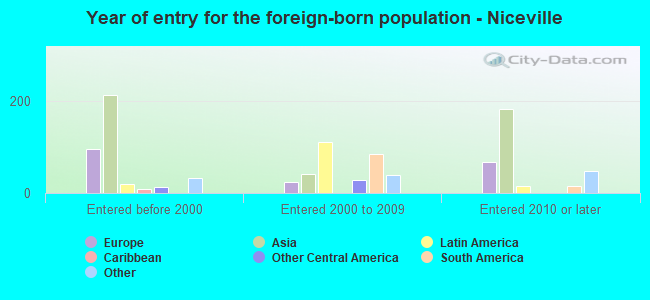
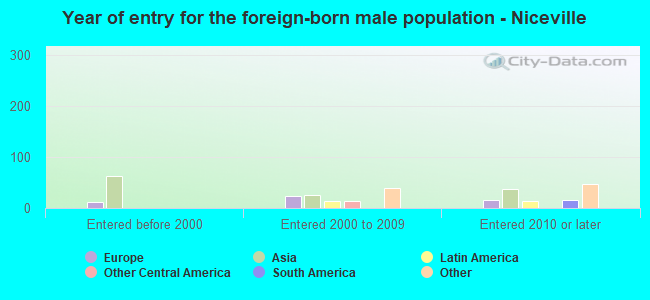
Foreign-born residents in Niceville 894 residents are foreign born (2.6% Asia , 1.2% Europe , 0.9% Latin America ).
This city:
5.5%Florida:
21.1%
Marital status for residents in Niceville Marital status - White (Caucasian) population 15 years and over
Males 28.5% Never married60.7% Now married1.7% Separated4.7% Widowed4.5% DivorcedFemales 21.6% Never married54.6% Now married0.5% Separated10.1% Widowed13.1% DivorcedWomen who gave birth in the past 12 months Now married:
100.0% (147)Unmarried:
0.0% (0)
Women who did not give birth in the past 12 months Now married:
46.2% (1,266)Unmarried:
53.8% (1,476)
Marital status - Black or African American population 15 years and over
Males 28.3% Never married57.9% Now married2.4% Separated0.0% Widowed11.4% DivorcedFemales 32.2% Never married62.1% Now married0.0% Separated0.0% Widowed5.7% DivorcedWomen who gave birth in the past 12 months Now married:
86.5% (109)Unmarried:
13.5% (17)
Women who did not give birth in the past 12 months Now married:
0.0% (0)Unmarried:
100.0% (65)
Marital status - Asian population 15 years and over
Males 24.8% Never married55.2% Now married0.0% Separated0.0% Widowed20.0% DivorcedFemales 25.8% Never married58.0% Now married0.0% Separated6.7% Widowed9.5% DivorcedWomen who gave birth in the past 12 months Now married:
100.0% (10)Unmarried:
0.0% (0)
Women who did not give birth in the past 12 months Now married:
48.3% (88)Unmarried:
51.7% (94)
Marital status - Other race population 15 years and over
Males 70.0% Never married30.0% Now married0.0% Separated0.0% Widowed0.0% DivorcedFemales 10.2% Never married53.4% Now married0.0% Separated0.0% Widowed36.4% DivorcedWomen who did not give birth in the past 12 months Now married:
34.5% (39)Unmarried:
65.5% (74)
Marital status - Two or more races population 15 years and over
Males 50.0% Never married50.0% Now married0.0% Separated0.0% Widowed0.0% DivorcedFemales 33.8% Never married54.7% Now married0.0% Separated2.5% Widowed9.0% DivorcedWomen who gave birth in the past 12 months Now married:
100.0% (21)Unmarried:
0.0% (0)
Women who did not give birth in the past 12 months Now married:
46.8% (94)Unmarried:
53.2% (107)
Marital status - White alone, not Hispanic / Latino population 15 years and over
Males 27.7% Never married61.3% Now married1.7% Separated4.6% Widowed4.7% DivorcedFemales 21.7% Never married53.7% Now married0.6% Separated10.5% Widowed13.6% DivorcedWomen who gave birth in the past 12 months Now married:
100.0% (111)Unmarried:
0.0% (0)
Women who did not give birth in the past 12 months Now married:
45.1% (1,185)Unmarried:
54.9% (1,443)
Marital status - Hispanic or Latino population 15 years and over
Males 45.4% Never married49.2% Now married0.0% Separated5.4% Widowed0.0% DivorcedFemales 16.1% Never married70.6% Now married0.0% Separated0.0% Widowed13.3% DivorcedWomen who gave birth in the past 12 months Now married:
100.0% (60)Unmarried:
0.0% (0)
Women who did not give birth in the past 12 months Now married:
56.2% (128)Unmarried:
43.8% (100)
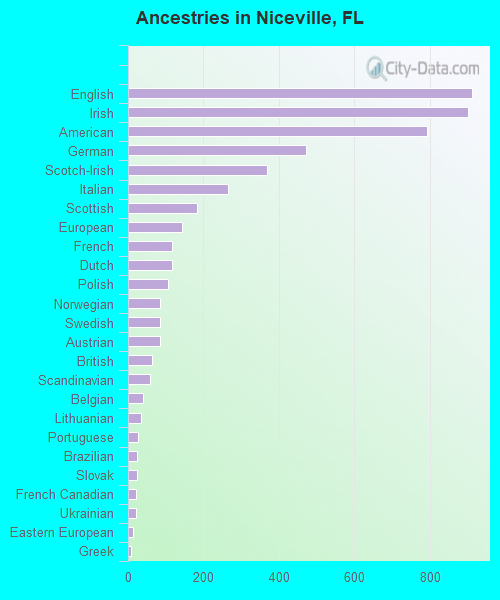
Ancestries in Niceville
912 12.6% English901 12.4% Irish794 11.0% American471 6.5% German368 5.1% Scotch-Irish266 3.7% Italian182 2.5% Scottish144 2.0% European118 1.6% French117 1.6% Dutch105 1.4% Polish86 1.2% Norwegian86 1.2% Swedish85 1.2% Austrian64 0.9% British58 0.8% Scandinavian39 0.5% Belgian35 0.5% Lithuanian27 0.4% Portuguese24 0.3% Brazilian23 0.3% Slovak22 0.3% French Canadian22 0.3% Ukrainian14 0.2% Eastern European9 0.1% Greek7 0.10% African5 0.07% Pennsylvania German
Children Nativity (place of birth) in Niceville
Children under 6 years - Living with two parents Both parents native 679 100.0% NativeBoth parents foreign-born 9 100.0% NativeOne native, one foreign-born parent 49 100.0% NativeChildren under 6 years - Living with one parent Native parent 217 100.0% NativeForeign-born parent 53 100.0% NativeChildren 6 to 17 years - Living with two parents Both parents native 1,886 97.8% Native42 2.2% Foreign-bornBoth parents foreign-born 72 100.0% NativeOne native, one foreign-born parent 170 100.0% NativeChildren 6 to 17 years - Living with one parent Native parent 412 100.0% NativeForeign-born parent 156 60.6% Native102 39.4% Foreign-born
Grandparents responsible for own grandchildren in Niceville
Grandparents (30 to 59 years) White / Caucasian 23 56.3% Responsible for grandchildren18 43.7% Not responsible for grandchildrenWhite alone, not Hispanic / Latino 23 74.1% Responsible for grandchildren8 25.9% Not responsible for grandchildren
Grandparents (60 years and over) White / Caucasian 17 100.0% Not responsible for grandchildrenWhite alone, not Hispanic / Latino 17 100.0% Not responsible for grandchildren