Races in Norfolk, Virginia (VA) Detailed Stats
Data:
Races - White alone (%)
Races - White alone (% change since 2000)
Races - Black alone (%)
Races - Black alone (% change since 2000)
Races - American Indian alone (%)
Races - American Indian alone (% change since 2000)
Races - Asian alone (%)
Races - Asian alone (% change since 2000)
Races - Hispanic (%)
Races - Hispanic (% change since 2000)
Races - Native Hawaiian and Other Pacific Islander alone (%)
Races - Native Hawaiian and Other Pacific Islander alone (% change since 2000)
Races - Two or more races(%)
Races - Two or more races(% change since 2000)
Races - Other race alone (%)
Races - Other race alone (% change since 2000)
Racial diversity
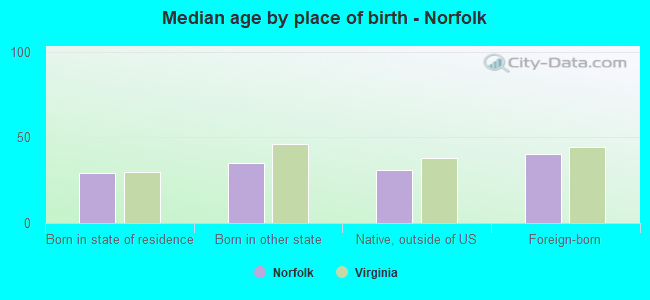
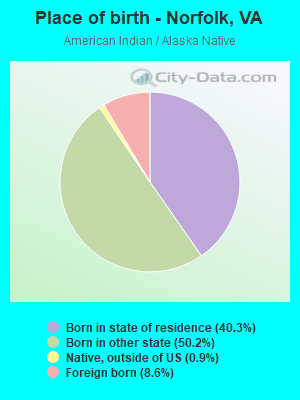
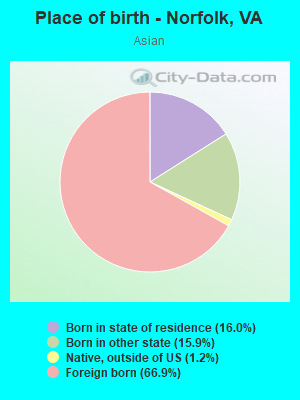
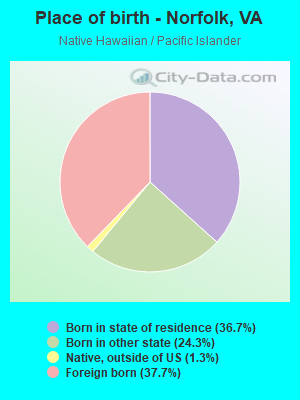
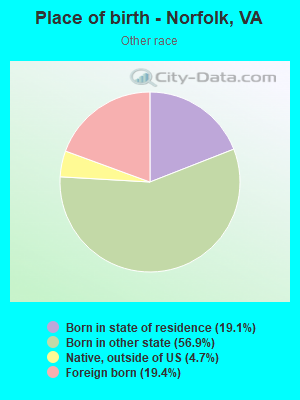
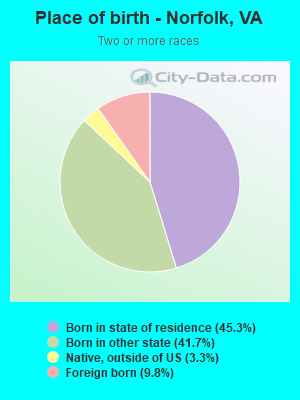
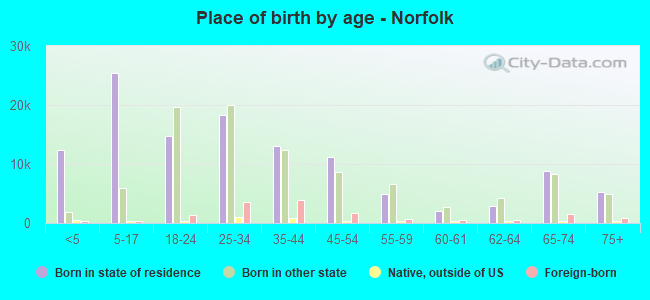
Place of birth - Born in state of residence (%)
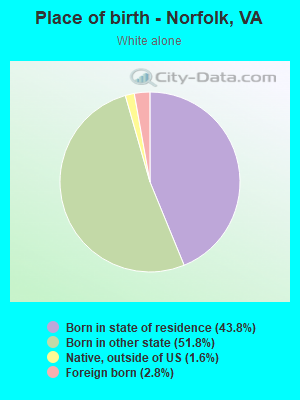
Place of birth - Born in state of residence (%) - White
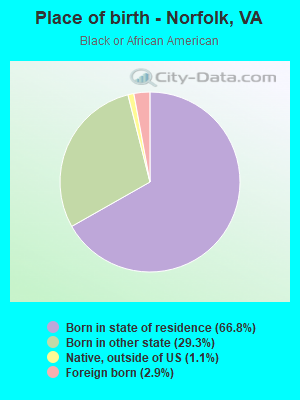
Place of birth - Born in state of residence (%) - Black or African American
Place of birth - Born in state of residence (%) - Asian
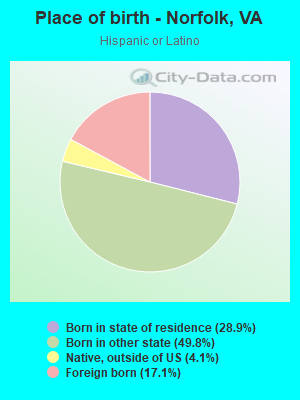
Place of birth - Born in state of residence (%) - Hispanic or Latino
Place of birth - Born in state of residence (%) - American Indian and Alaska Native
Place of birth - Born in state of residence (%) - Multirace
Place of birth - Born in state of residence (%) - Other Race
Place of birth - Born in other state (%)
Place of birth - Born in other state (%) - White
Place of birth - Born in other state (%) - Black or African American
Place of birth - Born in other state (%) - Asian
Place of birth - Born in other state (%) - Hispanic or Latino
Place of birth - Born in other state (%) - American Indian and Alaska Native
Place of birth - Born in other state (%) - Multirace
Place of birth - Born in other state (%) - Other Race
Place of birth - Native, outside of US (%)
Place of birth - Native, outside of US (%) - White
Place of birth - Native, outside of US (%) - Black or African American
Place of birth - Native, outside of US (%) - Asian
Place of birth - Native, outside of US (%) - Hispanic or Latino
Place of birth - Native, outside of US (%) - American Indian and Alaska Native
Place of birth - Native, outside of US (%) - Multirace
Place of birth - Native, outside of US (%) - Other Race
Place of birth - Foreign born (%)
Place of birth - Foreign born (%) - White
Place of birth - Foreign born (%) - Black or African American
Place of birth - Foreign born (%) - Asian
Place of birth - Foreign born (%) - Hispanic or Latino
Place of birth - Foreign born (%) - American Indian and Alaska Native
Place of birth - Foreign born (%) - Multirace
Place of birth - Foreign born (%) - Other Race
Residents speaking English at home (%)
Residents speaking English at home - Born in the United States (%)
Residents speaking English at home - Native, born elsewhere (%)
Residents speaking English at home - Foreign born (%)
Residents speaking Spanish at home (%)
Residents speaking Spanish at home - Born in the United States (%)
Residents speaking Spanish at home - Native, born elsewhere (%)
Residents speaking Spanish at home - Foreign born (%)
Residents speaking other language at home (%)
Residents speaking other language at home - Born in the United States (%)
Residents speaking other language at home - Native, born elsewhere (%)
Residents speaking other language at home - Foreign born (%)
Marital status - Never married (%)
Marital status - Now married (%)
Marital status - Separated (%)
Marital status - Widowed (%)
Marital status - Divorced (%)
Ancestries Reported - Arab (%)
Ancestries Reported - Czech (%)
Ancestries Reported - Danish (%)
Ancestries Reported - Dutch (%)
Ancestries Reported - English (%)
Ancestries Reported - French (%)
Ancestries Reported - French Canadian (%)
Ancestries Reported - German (%)
Ancestries Reported - Greek (%)
Ancestries Reported - Hungarian (%)
Ancestries Reported - Irish (%)
Ancestries Reported - Italian (%)
Ancestries Reported - Lithuanian (%)
Ancestries Reported - Norwegian (%)
Ancestries Reported - Polish (%)
Ancestries Reported - Portuguese (%)
Ancestries Reported - Russian (%)
Ancestries Reported - Scotch-Irish (%)
Ancestries Reported - Scottish (%)
Ancestries Reported - Slovak (%)
Ancestries Reported - Subsaharan African (%)
Ancestries Reported - Swedish (%)
Ancestries Reported - Swiss (%)
Ancestries Reported - Ukrainian (%)
Ancestries Reported - United States (%)
Ancestries Reported - Welsh (%)
Ancestries Reported - West Indian (%)
Ancestries Reported - Other (%)
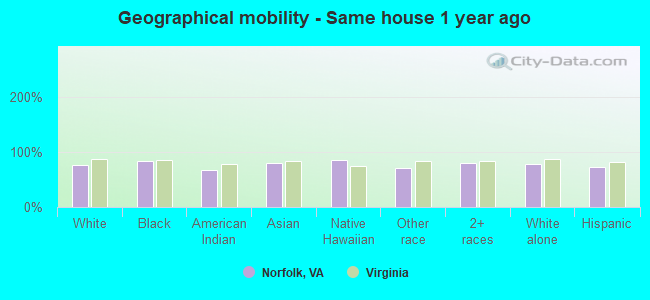
Geographical mobility - Same house 1 year ago (%)
Geographical mobility - Same house 1 year ago (%) - White
Geographical mobility - Same house 1 year ago (%) - Black or African American
Geographical mobility - Same house 1 year ago (%) - Asian
Geographical mobility - Same house 1 year ago (%) - Hispanic or Latino
Geographical mobility - Same house 1 year ago (%) - American Indian and Alaska Native
Geographical mobility - Same house 1 year ago (%) - Multirace
Geographical mobility - Same house 1 year ago (%) - Other Race
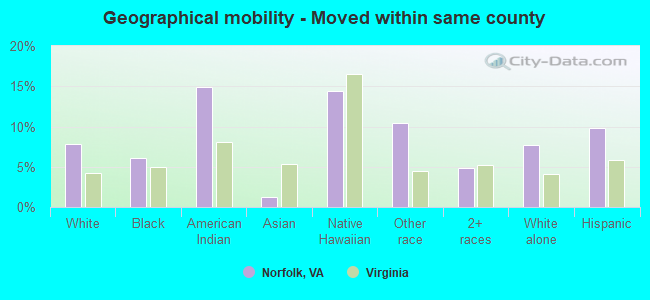
Geographical mobility - Moved within same county (%)
Geographical mobility - Moved within same county (%) - White
Geographical mobility - Moved within same county (%) - Black or African American
Geographical mobility - Moved within same county (%) - Asian
Geographical mobility - Moved within same county (%) - Hispanic or Latino
Geographical mobility - Moved within same county (%) - American Indian and Alaska Native
Geographical mobility - Moved within same county (%) - Multirace
Geographical mobility - Moved within same county (%) - Other Race
Geographical mobility - Moved from different county within same state (%)
Geographical mobility - Moved from different county within same state (%) - White
Geographical mobility - Moved from different county within same state (%) - Black or African American
Geographical mobility - Moved from different county within same state (%) - Asian
Geographical mobility - Moved from different county within same state (%) - Hispanic or Latino
Geographical mobility - Moved from different county within same state (%) - American Indian and Alaska Native
Geographical mobility - Moved from different county within same state (%) - Multirace
Geographical mobility - Moved from different county within same state (%) - Other Race
Geographical mobility - Moved from different state (%)
Geographical mobility - Moved from different state (%) - White
Geographical mobility - Moved from different state (%) - Black or African American
Geographical mobility - Moved from different state (%) - Asian
Geographical mobility - Moved from different state (%) - Hispanic or Latino
Geographical mobility - Moved from different state (%) - American Indian and Alaska Native
Geographical mobility - Moved from different state (%) - Multirace
Geographical mobility - Moved from different state (%) - Other Race
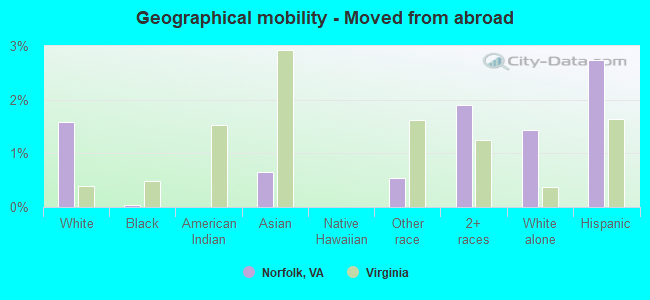
Geographical mobility - Moved from abroad (%)
Geographical mobility - Moved from abroad (%) - White
Geographical mobility - Moved from abroad (%) - Black or African American
Geographical mobility - Moved from abroad (%) - Asian
Geographical mobility - Moved from abroad (%) - Hispanic or Latino
Geographical mobility - Moved from abroad (%) - American Indian and Alaska Native
Geographical mobility - Moved from abroad (%) - Multirace
Geographical mobility - Moved from abroad (%) - Other Race
Place of birth for the foreign-born population - Ireland (%)
Place of birth for the foreign-born population - Denmark (%)
Place of birth for the foreign-born population - Norway (%)
Place of birth for the foreign-born population - Sweden (%)
Place of birth for the foreign-born population - United Kingdom (%)
Place of birth for the foreign-born population - England (%)
Place of birth for the foreign-born population - Scotland (%)
Place of birth for the foreign-born population - Other Northern Europe (%)
Place of birth for the foreign-born population - Austria (%)
Place of birth for the foreign-born population - Belgium (%)
Place of birth for the foreign-born population - France (%)
Place of birth for the foreign-born population - Germany (%)
Place of birth for the foreign-born population - Netherlands (%)
Place of birth for the foreign-born population - Switzerland (%)
Place of birth for the foreign-born population - Other Western Europe (%)
Place of birth for the foreign-born population - Greece (%)
Place of birth for the foreign-born population - Italy (%)
Place of birth for the foreign-born population - Portugal (%)
Place of birth for the foreign-born population - Spain (%)
Place of birth for the foreign-born population - Other Southern Europe (%)
Place of birth for the foreign-born population - Albania (%)
Place of birth for the foreign-born population - Belarus (%)
Place of birth for the foreign-born population - Bosnia and Herzegovina (%)
Place of birth for the foreign-born population - Bulgaria (%)
Place of birth for the foreign-born population - Croatia (%)
Place of birth for the foreign-born population - Czechoslovakia (%)
Place of birth for the foreign-born population - Hungary (%)
Place of birth for the foreign-born population - Latvia (%)
Place of birth for the foreign-born population - Lithuania (%)
Place of birth for the foreign-born population - North Macedonia (Macedonia) (%)
Place of birth for the foreign-born population - Moldova (%)
Place of birth for the foreign-born population - Poland (%)
Place of birth for the foreign-born population - Romania (%)
Place of birth for the foreign-born population - Russia (%)
Place of birth for the foreign-born population - Serbia (%)
Place of birth for the foreign-born population - Ukraine (%)
Place of birth for the foreign-born population - Other Eastern Europe (%)
Place of birth for the foreign-born population - China (%)
Place of birth for the foreign-born population - Hong Kong (%)
Place of birth for the foreign-born population - Taiwan (%)
Place of birth for the foreign-born population - Japan (%)
Place of birth for the foreign-born population - Korea (%)
Place of birth for the foreign-born population - Other Eastern Asia (%)
Place of birth for the foreign-born population - Afghanistan (%)
Place of birth for the foreign-born population - Bangladesh (%)
Place of birth for the foreign-born population - India (%)
Place of birth for the foreign-born population - Iran (%)
Place of birth for the foreign-born population - Kazakhstan (%)
Place of birth for the foreign-born population - Nepal (%)
Place of birth for the foreign-born population - Pakistan (%)
Place of birth for the foreign-born population - Sri Lanka (%)
Place of birth for the foreign-born population - Uzbekistan (%)
Place of birth for the foreign-born population - Other South Central Asia (%)
Place of birth for the foreign-born population - Burma (%)
Place of birth for the foreign-born population - Cambodia (%)
Place of birth for the foreign-born population - Indonesia (%)
Place of birth for the foreign-born population - Laos (%)
Place of birth for the foreign-born population - Malaysia (%)
Place of birth for the foreign-born population - Philippines (%)
Place of birth for the foreign-born population - Singapore (%)
Place of birth for the foreign-born population - Thailand (%)
Place of birth for the foreign-born population - Vietnam (%)
Place of birth for the foreign-born population - Other South Eastern Asia (%)
Place of birth for the foreign-born population - Armenia (%)
Place of birth for the foreign-born population - Iraq (%)
Place of birth for the foreign-born population - Israel (%)
Place of birth for the foreign-born population - Jordan (%)
Place of birth for the foreign-born population - Kuwait (%)
Place of birth for the foreign-born population - Lebanon (%)
Place of birth for the foreign-born population - Saudi Arabia (%)
Place of birth for the foreign-born population - Syria (%)
Place of birth for the foreign-born population - Turkey (%)
Place of birth for the foreign-born population - Yemen (%)
Place of birth for the foreign-born population - Other Western Asia (%)
Place of birth for the foreign-born population - Eritrea (%)
Place of birth for the foreign-born population - Ethiopia (%)
Place of birth for the foreign-born population - Kenya (%)
Place of birth for the foreign-born population - Somalia (%)
Place of birth for the foreign-born population - Uganda (%)
Place of birth for the foreign-born population - Zimbabwe (%)
Place of birth for the foreign-born population - Other Eastern Africa (%)
Place of birth for the foreign-born population - Cameroon (%)
Place of birth for the foreign-born population - Congo (%)
Place of birth for the foreign-born population - Democratic Republic of Congo (Zaire) (%)
Place of birth for the foreign-born population - Other Middle Africa (%)
Place of birth for the foreign-born population - Egypt (%)
Place of birth for the foreign-born population - Morocco (%)
Place of birth for the foreign-born population - Sudan (%)
Place of birth for the foreign-born population - Other Northern Africa (%)
Place of birth for the foreign-born population - South Africa (%)
Place of birth for the foreign-born population - Other Southern Africa (%)
Place of birth for the foreign-born population - Cabo Verde (%)
Place of birth for the foreign-born population - Ghana (%)
Place of birth for the foreign-born population - Liberia (%)
Place of birth for the foreign-born population - Nigeria (%)
Place of birth for the foreign-born population - Senegal (%)
Place of birth for the foreign-born population - Sierra Leone (%)
Place of birth for the foreign-born population - Other Western Africa (%)
Place of birth for the foreign-born population - Australia (%)
Place of birth for the foreign-born population - New Zealand (%)
Place of birth for the foreign-born population - Fiji (%)
Place of birth for the foreign-born population - Micronesia (%)
Place of birth for the foreign-born population - Bahamas (%)
Place of birth for the foreign-born population - Barbados (%)
Place of birth for the foreign-born population - Cuba (%)
Place of birth for the foreign-born population - Dominica (%)
Place of birth for the foreign-born population - Dominican Republic (%)
Place of birth for the foreign-born population - Grenada (%)
Place of birth for the foreign-born population - Haiti (%)
Place of birth for the foreign-born population - Jamaica (%)
Place of birth for the foreign-born population - St. Vincent and the Grenadines (%)
Place of birth for the foreign-born population - Trinidad and Tobago (%)
Place of birth for the foreign-born population - West Indies (%)
Place of birth for the foreign-born population - Other Caribbean (%)
Place of birth for the foreign-born population - Belize (%)
Place of birth for the foreign-born population - Costa Rica (%)
Place of birth for the foreign-born population - El Salvador (%)
Place of birth for the foreign-born population - Guatemala (%)
Place of birth for the foreign-born population - Honduras (%)
Place of birth for the foreign-born population - Mexico (%)
Place of birth for the foreign-born population - Nicaragua (%)
Place of birth for the foreign-born population - Panama (%)
Place of birth for the foreign-born population - Other Central America (%)
Place of birth for the foreign-born population - Argentina (%)
Place of birth for the foreign-born population - Bolivia (%)
Place of birth for the foreign-born population - Brazil (%)
Place of birth for the foreign-born population - Chile (%)
Place of birth for the foreign-born population - Colombia (%)
Place of birth for the foreign-born population - Ecuador (%)
Place of birth for the foreign-born population - Guyana (%)
Place of birth for the foreign-born population - Peru (%)
Place of birth for the foreign-born population - Uruguay (%)
Place of birth for the foreign-born population - Venezuela (%)
Place of birth for the foreign-born population - Other South America (%)
Place of birth for the foreign-born population - Canada (%)
Place of birth for the foreign-born population - Other Northern America (%)
Place of birth for the foreign-born population - Other (%)
Latest news about races in Norfolk, VA collected exclusively by city-data.com from local newspapers, TV, and radio stations
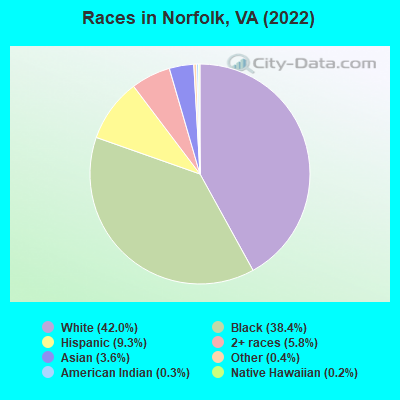
According to 2022 data, the most numerous races in Norfolk, VA are White alone (97,925 residents), Black alone (89,528 residents), and Hispanic (21,628 residents). 88.8% of Norfolk residents speak English at home. 7.6% of Norfolk, VA residents are foreign-born (2.8% born in Asia, 2.5% born in Latin America, 1.1% born in Europe), which is 57.7% less than the foreign-born rate of 12.0% across the entire state of Virginia.
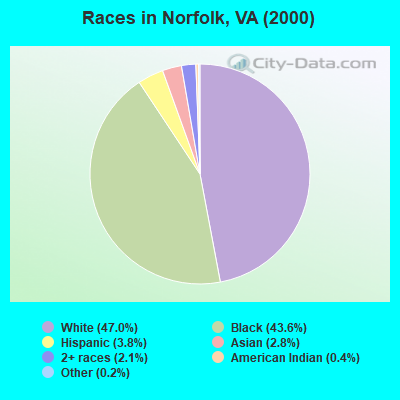
Race distribution in Norfolk
2000 2022
110,221 47.0% White alone 102,268 43.6% Black alone 8,915 3.8% Hispanic 6,477 2.8% Asian alone 4,848 2.1% Two or more races 971 0.4% American Indian alone 483 0.2% Other race alone 220 0.09% Native Hawaiian and Other
97,925 42.0% White alone 89,528 38.4% Black alone 21,628 9.3% Hispanic 13,514 5.8% Two or more races 8,391 3.6% Asian alone 847 0.4% Other race alone 708 0.3% American Indian alone 454 0.2% Native Hawaiian and Other
2000 2022
4,965,637 70.2% White alone 1,376,378 19.4% Black alone 329,540 4.7% Hispanic 259,277 3.7% Asian alone 114,022 1.6% Two or more races 18,596 0.3% American Indian alone 11,685 0.2% Other race alone 3,380 0.05% Native Hawaiian and Other
5,095,130 58.7% White alone 1,594,785 18.4% Black alone 905,750 10.4% Hispanic 602,881 6.9% Asian alone 406,047 4.7% Two or more races 60,419 0.7% Other race alone 11,738 0.1% American Indian alone 6,869 0.08% Native Hawaiian and Other
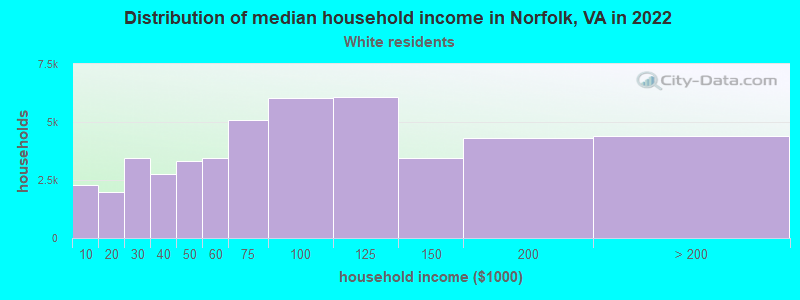
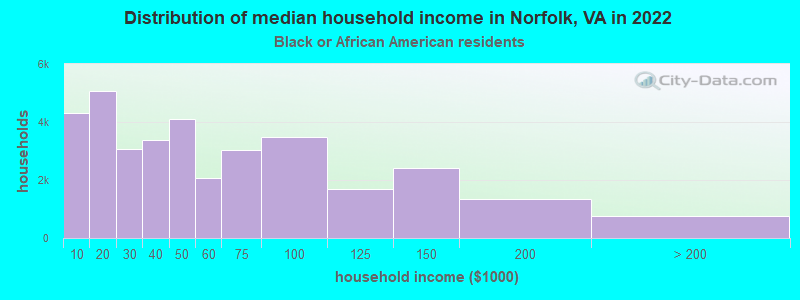
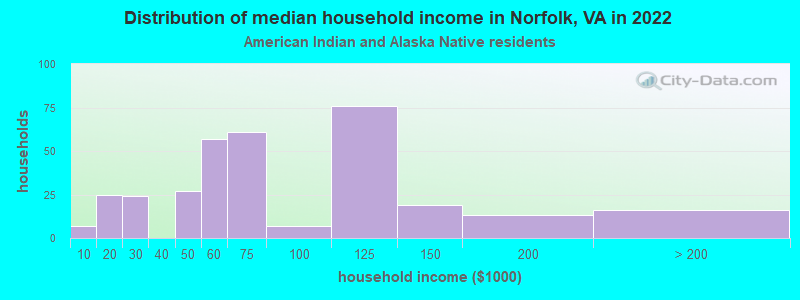
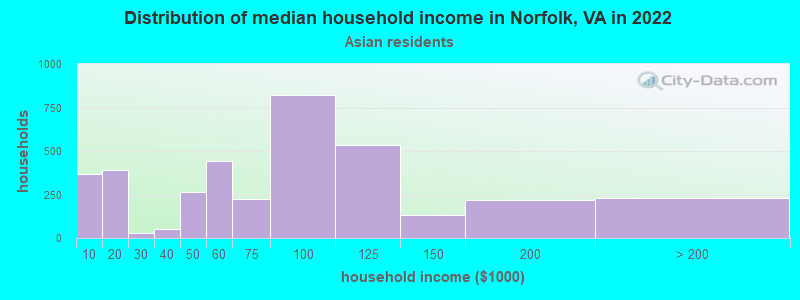
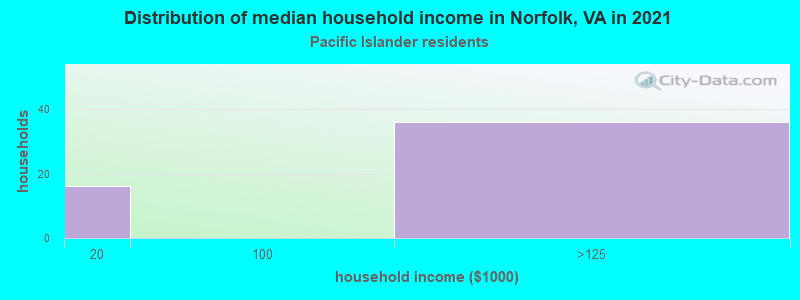
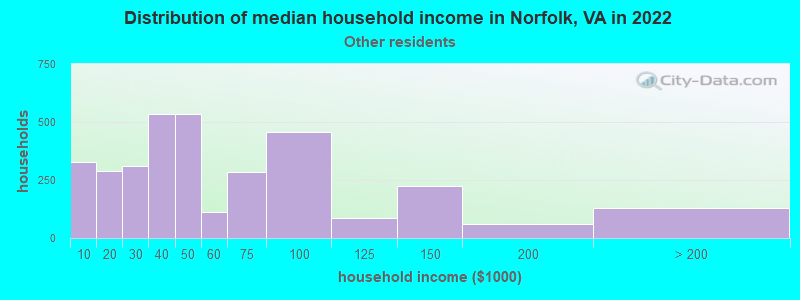
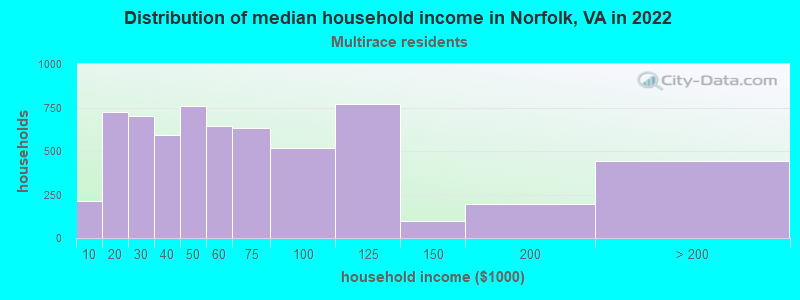
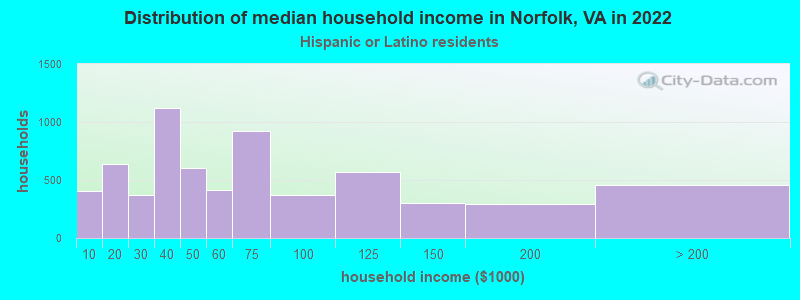
Income and house value in Norfolk Median household income in 2022 $79,139 White non-Hispanic householders$44,001 Black householders$69,420 American Indian and Alaska Native householders$80,293 Asian householders$41,388 Some other race householders$55,029 Two or more races householders$52,225 Hispanic or Latino race householdersMedian 2022 house value $290,864 White Non-Hispanic householders$233,485 Black or African American householders$245,083 American Indian or Alaska Native householders $275,298 Asian householders$247,219 Native Hawaiian and other Pacific Islander householders$272,857 Some other race householders$254,544 Two or more races householders$277,740 Hispanic or Latino householders
Median age by race in Norfolk
35.0 Median age for White residents33.3 36.7 32.0 Median age for Black or African American residents30.5 33.5 26.3 Median age for American Indian / Alaska Native residents26.4 24.0 40.1 Median age for Asian residents38.9 40.8 27.6 Median age for Native Hawaiian / Pacific Islander residents28.3 27.2 27.5 Median age for Other race residents25.9 27.9 23.7 Median age for Two or more races residents23.1 24.2 35.7 Median age for White alone residents34.2 38.1 25.9 Median age for Hispanic or Latino residents25.4 26.7
Owner/renter occupied households by race in Norfolk
House owners and renters - White residents 28,329 60.7% Owner occupied18,315 39.3% Renter occupiedHouse owners and renters - Black or African American residents 10,864 31.3% Owner occupied23,839 68.7% Renter occupiedHouse owners and renters - American Indian / Alaska Native residents 120 34.8% Owner occupied225 65.2% Renter occupiedHouse owners and renters - Asian residents 2,129 57.4% Owner occupied1,582 42.6% Renter occupiedHouse owners and renters - Native Hawaiian / Pacific Islander residents 66 41.9% Owner occupied92 58.1% Renter occupiedHouse owners and renters - Other race residents 1,092 40.2% Owner occupied1,624 59.8% Renter occupiedHouse owners and renters - Two or more races residents 2,619 41.6% Owner occupied3,670 58.4% Renter occupiedHouse owners and renters - White alone residents 27,823 61.4% Owner occupied17,462 38.6% Renter occupiedHouse owners and renters - Hispanic or Latino residents 2,348 36.3% Owner occupied4,120 63.7% Renter occupied
Language usage in Norfolk
English speakers - Total 88.8% of residents of Norfolk speak English at home.
5.3% of residents speak Spanish at home 8,331 71.5% Speak English very well3,319 28.5% Speak English less than very well5.8% of residents speak other language at home 9,918 78.0% Speak English very well2,797 22.0% Speak English less than very well
English speakers - Born in the United States 92.5% of residents of Norfolk speak English at home.
5.5% of residents speak Spanish at home 4,274 83.9% Speak English very well818 16.1% Speak English less than very well2.0% of residents speak other language at home 1,775 93.7% Speak English very well120 6.3% Speak English less than very well
English speakers - Native, born elsewhere 61.8% of residents of Norfolk speak English at home.
23.2% of residents speak Spanish at home 538 69.6% Speak English very well235 30.4% Speak English less than very well15.1% of residents speak other language at home 346 68.8% Speak English very well157 31.2% Speak English less than very well
English speakers - Foreign-born 19.5% of residents of Norfolk speak English at home.
20.9% of residents speak Spanish at home 1,701 54.2% Speak English very well1,436 45.8% Speak English less than very well59.6% of residents speak other language at home 6,680 74.7% Speak English very well2,267 25.3% Speak English less than very well
White (Caucasian) - Speak only English Native:
96.2% (91,163)Foreign-born:
41.9% (1,183)
White (Caucasian) - Speak another language Native:
3.8% (3,561)Foreign-born:
58.1% (1,642)
Black or African American - Speak only English Native:
97.2% (81,822)Foreign-born:
34.1% (899)
Black or African American - Speak another language Native:
2.8% (2,322)Foreign-born:
65.9% (1,735)
American Indian / Alaska Native - Speak only English Native:
84.5% (701)Foreign-born:
10.5% (9)
American Indian / Alaska Native - Speak another language Native:
16.2% (135)Foreign-born:
76.7% (64)
Asian - Speak only English Native:
62.5% (1,643)Foreign-born:
6.3% (359)
Asian - Speak another language Native:
37.5% (987)Foreign-born:
93.7% (5,369)
Other race - Speak only English Native:
58.4% (3,604)Foreign-born:
12.4% (193)
Other race - Speak another language Native:
41.6% (2,572)Foreign-born:
87.6% (1,364)
Two or more races - Speak only English Native:
81.6% (11,927)Foreign-born:
12.0% (219)
Two or more races - Speak another language Native:
18.4% (2,691)Foreign-born:
88.0% (1,600)
White alone - Speak only English Native:
97.6% (88,301)Foreign-born:
43.3% (1,183)
White alone - Speak another language Native:
2.4% (2,183)Foreign-born:
56.7% (1,547)
Hispanic or Latino - Speak only English Native:
58.3% (9,172)Foreign-born:
13.3% (478)
Hispanic or Latino - Speak another language Native:
41.7% (6,553)Foreign-born:
86.7% (3,111)
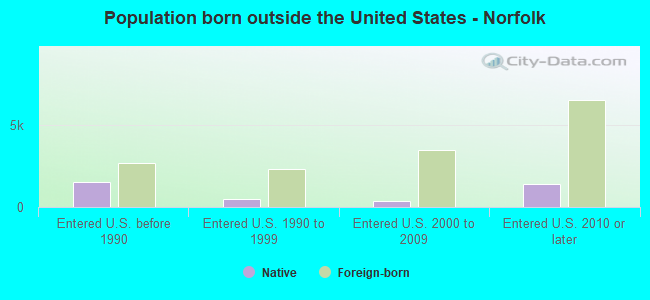
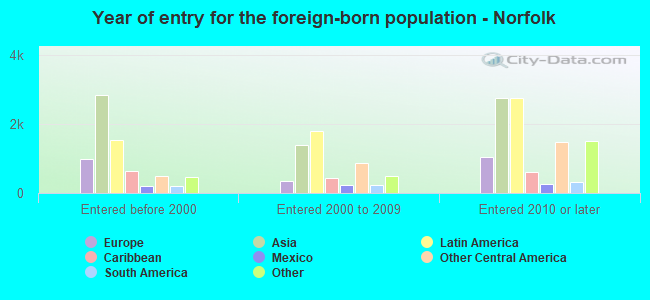
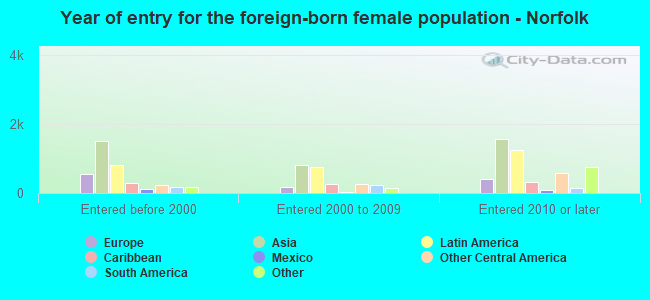
Foreign-born residents in Norfolk 17,734 residents are foreign born (2.8% Asia , 2.5% Latin America , 1.1% Europe ).
This city:
7.6%Virginia:
12.6%
Marital status for residents in Norfolk Marital status - White (Caucasian) population 15 years and over
Males 42.0% Never married45.7% Now married0.8% Separated2.1% Widowed9.4% DivorcedFemales 29.2% Never married44.8% Now married1.8% Separated8.3% Widowed15.9% DivorcedWomen who gave birth in the past 12 months Now married:
72.6% (1,171)Unmarried:
27.4% (442)
Women who did not give birth in the past 12 months Now married:
43.9% (9,890)Unmarried:
56.1% (12,639)
Marital status - Black or African American population 15 years and over
Males 61.8% Never married25.5% Now married2.1% Separated2.3% Widowed8.3% DivorcedFemales 54.5% Never married21.2% Now married2.8% Separated7.1% Widowed14.5% DivorcedWomen who gave birth in the past 12 months Now married:
58.6% (744)Unmarried:
41.4% (526)
Women who did not give birth in the past 12 months Now married:
16.9% (4,132)Unmarried:
83.1% (20,311)
Marital status - American Indian / Alaska Native population 15 years and over
Males 63.9% Never married32.7% Now married0.0% Separated0.0% Widowed3.4% DivorcedFemales 54.8% Never married29.5% Now married0.0% Separated8.9% Widowed6.8% DivorcedWomen who gave birth in the past 12 months Now married:
0.0% (0)Unmarried:
100.0% (20)
Women who did not give birth in the past 12 months Now married:
25.0% (50)Unmarried:
75.0% (150)
Marital status - Asian population 15 years and over
Males 49.8% Never married46.3% Now married0.0% Separated0.4% Widowed3.4% DivorcedFemales 28.8% Never married61.9% Now married0.8% Separated5.7% Widowed2.8% DivorcedWomen who gave birth in the past 12 months Now married:
100.0% (87)Unmarried:
0.0% (0)
Women who did not give birth in the past 12 months Now married:
43.0% (952)Unmarried:
57.0% (1,261)
Marital status - Native Hawaiian / Pacific Islander population 15 years and over
Males 41.4% Never married58.6% Now married0.0% Separated0.0% Widowed0.0% DivorcedFemales 53.3% Never married46.7% Now married0.0% Separated0.0% Widowed0.0% DivorcedWomen who did not give birth in the past 12 months Now married:
37.3% (56)Unmarried:
62.7% (94)
Marital status - Other race population 15 years and over
Males 53.9% Never married24.8% Now married1.5% Separated1.0% Widowed18.8% DivorcedFemales 38.4% Never married37.0% Now married3.0% Separated12.2% Widowed9.4% DivorcedWomen who gave birth in the past 12 months Now married:
45.2% (74)Unmarried:
54.8% (89)
Women who did not give birth in the past 12 months Now married:
45.1% (1,240)Unmarried:
54.9% (1,507)
Marital status - Two or more races population 15 years and over
Males 51.7% Never married28.2% Now married1.4% Separated2.4% Widowed16.3% DivorcedFemales 42.5% Never married36.8% Now married0.8% Separated4.9% Widowed14.9% DivorcedWomen who gave birth in the past 12 months Now married:
100.0% (360)Unmarried:
0.0% (0)
Women who did not give birth in the past 12 months Now married:
29.7% (1,391)Unmarried:
70.3% (3,286)
Marital status - White alone, not Hispanic / Latino population 15 years and over
Males 41.9% Never married46.1% Now married0.9% Separated2.2% Widowed9.0% DivorcedFemales 28.7% Never married45.1% Now married1.8% Separated8.6% Widowed15.9% DivorcedWomen who gave birth in the past 12 months Now married:
74.2% (1,121)Unmarried:
25.8% (390)
Women who did not give birth in the past 12 months Now married:
44.4% (9,493)Unmarried:
55.6% (11,908)
Marital status - Hispanic or Latino population 15 years and over
Males 54.2% Never married32.5% Now married0.7% Separated1.0% Widowed11.6% DivorcedFemales 42.4% Never married39.3% Now married1.2% Separated5.8% Widowed11.2% DivorcedWomen who gave birth in the past 12 months Now married:
83.4% (262)Unmarried:
16.6% (52)
Women who did not give birth in the past 12 months Now married:
38.0% (2,074)Unmarried:
62.0% (3,387)
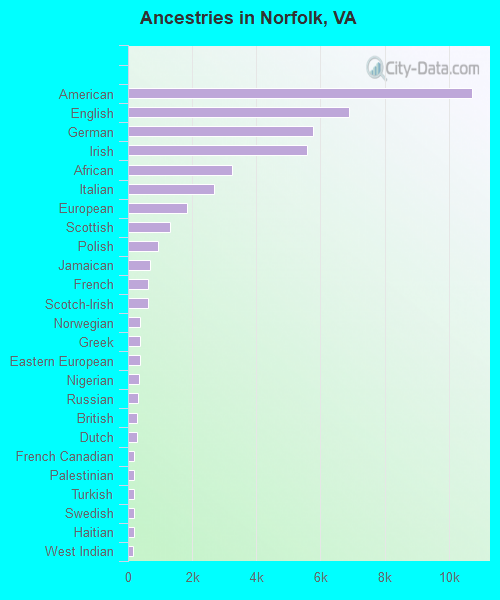
Ancestries in Norfolk
10,717 8.1% American6,885 5.2% English5,756 4.4% German5,579 4.2% Irish3,231 2.4% African2,680 2.0% Italian1,830 1.4% European1,311 1.0% Scottish948 0.7% Polish690 0.5% Jamaican635 0.5% French631 0.5% Scotch-Irish373 0.3% Norwegian370 0.3% Greek362 0.3% Eastern European358 0.3% Nigerian300 0.2% Russian290 0.2% British266 0.2% Dutch199 0.2% French Canadian182 0.1% Palestinian181 0.1% Turkish179 0.1% Swedish179 0.1% Haitian171 0.1% West Indian151 0.1% Ukrainian140 0.1% Scandinavian140 0.1% Welsh135 0.1% Hungarian131 0.10% Danish121 0.09% Lithuanian120 0.09% Trinidadian and Tobagonian118 0.09% Afghan100 0.08% Northern European94 0.07% Ethiopian91 0.07% Ghanaian89 0.07% Iranian89 0.07% Sierra Leonean80 0.06% Guyanese80 0.06% Belizean77 0.06% Canadian69 0.05% Lebanese63 0.05% Finnish62 0.05% Jordanian62 0.05% Austrian55 0.04% Pennsylvania German53 0.04% Senegalese52 0.04% Israeli47 0.04% Romanian46 0.03% Armenian46 0.03% Swiss45 0.03% South African45 0.03% Slovak44 0.03% Brazilian43 0.03% Portuguese37 0.03% Moroccan32 0.02% U.S. Virgin Islander31 0.02% Bahamian31 0.02% Serbian30 0.02% Liberian30 0.02% Czech27 0.02% Arab26 0.02% Zimbabwean26 0.02% Barbadian25 0.02% Albanian24 0.02% Australian19 0.01% Syrian15 0.01% Slovene10 0.01% Czechoslovakian10 0.01% British West Indian9 0.01% Yugoslavian7 0.01% Ugandan7 0.01% Bulgarian7 0.01% Slavic
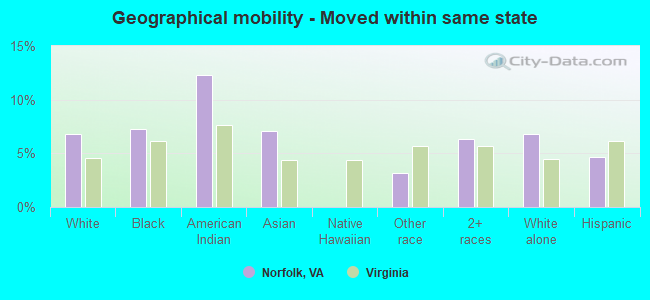
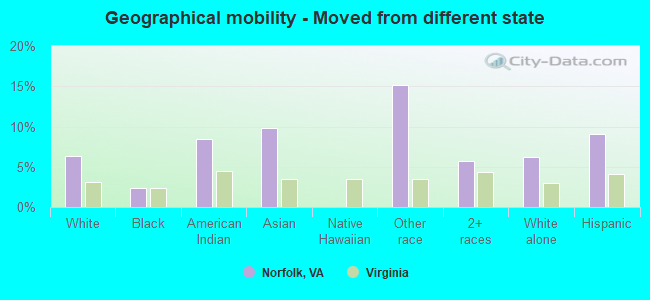
Geographical mobility in Norfolk Same house 1 year ago 79,087 77.5% White (Caucasian)76,704 84.3% Black or African American705 67.0% American Indian / Alaska Native6,912 81.1% Asian444 85.7% Native Hawaiian / Pacific Islander5,674 70.7% Other race14,954 81.1% Two or more races75,558 77.8% White alone, not Hispanic / Latino15,403 73.7% Hispanic or LatinoMoved within same county 8,020 7.9% White / Caucasian5,513 6.1% Black or African American157 14.9% American Indian / Alaska Native111 1.3% Asian75 14.5% Native Hawaiian / Pacific Islander837 10.4% Other race892 4.8% Two or more races7,468 7.7% White alone, not Hispanic / Latino2,051 9.8% Hispanic or LatinoMoved within same state 6,895 6.8% White / Caucasian6,605 7.3% Black or African American129 12.3% American Indian / Alaska Native605 7.1% Asian254 3.2% Other race1,171 6.4% Two or more races6,630 6.8% White alone, not Hispanic / Latino970 4.6% Hispanic or LatinoMoved from different state 6,463 6.3% White / Caucasian2,100 2.3% Black or African American89 8.4% American Indian / Alaska Native841 9.9% Asian1,214 15.1% Other race1,061 5.8% Two or more races6,094 6.3% White alone, not Hispanic / Latino1,904 9.1% Hispanic or LatinoMoved from abroad 1,608 1.6% White26 0.0% Black or African American55 0.6% Asian44 0.5% Other race351 1.9% Two or more races1,399 1.4% White alone, not Hispanic / Latino573 2.7% Hispanic or Latino
Children Nativity (place of birth) in Norfolk
Children under 6 years - Living with two parents Both parents native 7,336 100.0% NativeBoth parents foreign-born 909 88.7% Native116 11.3% Foreign-bornOne native, one foreign-born parent 685 100.0% NativeChildren under 6 years - Living with one parent Native parent 7,191 100.0% NativeForeign-born parent 594 100.0% NativeChildren 6 to 17 years - Living with two parents Both parents native 9,453 100.0% NativeBoth parents foreign-born 266 42.4% Native361 57.6% Foreign-bornOne native, one foreign-born parent 1,299 97.2% Native37 2.8% Foreign-bornChildren 6 to 17 years - Living with one parent Native parent 14,141 100.0% NativeForeign-born parent 1,606 50.0% Native1,606 50.0% Foreign-born
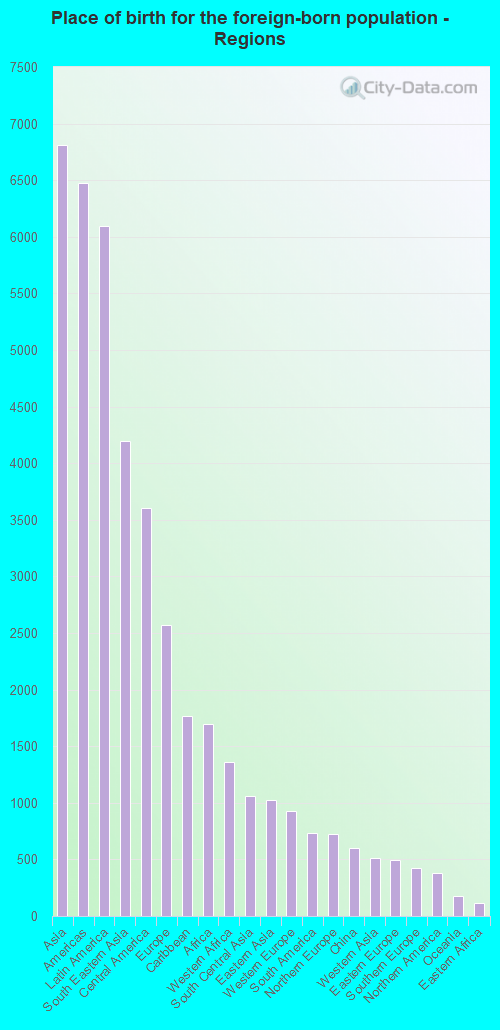
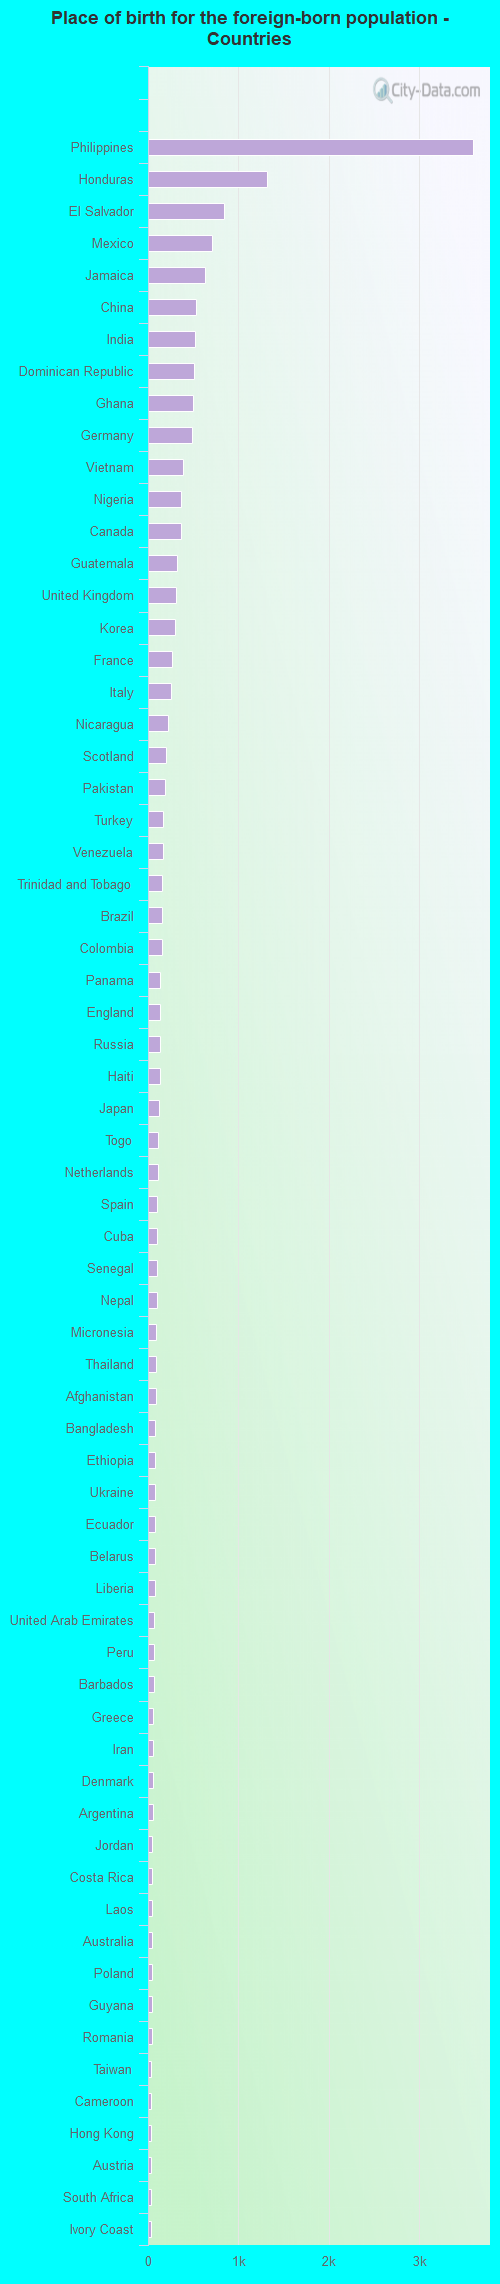
Place of birth for residents in Norfolk 6,809 Asia6,477 Americas6,099 Latin America4,195 South Eastern Asia3,602 Central America2,571 Europe1,763 Caribbean1,698 Africa1,357 Western Africa1,056 South Central Asia1,023 Eastern Asia928 Western Europe733 South America722 Northern Europe602 China508 Western Asia494 Eastern Europe425 Southern Europe378 Northern America177 Oceania115 Eastern Africa47 Australia and New Zealand Subregion43 Middle Africa37 Northern Africa34 Southern Africa3,591 Philippines1,319 Honduras837 El Salvador713 Mexico628 Jamaica529 China521 India506 Dominican Republic497 Ghana486 Germany390 Vietnam370 Nigeria369 Canada316 Guatemala315 United Kingdom301 Korea261 France249 Italy221 Nicaragua199 Scotland191 Pakistan169 Turkey161 Venezuela151 Trinidad and Tobago151 Brazil151 Colombia132 Panama131 England131 Russia128 Haiti119 Japan113 Togo106 Netherlands105 Spain98 Cuba98 Senegal94 Nepal86 Micronesia85 Thailand85 Afghanistan80 Bangladesh78 Ethiopia78 Ukraine77 Ecuador76 Belarus74 Liberia69 United Arab Emirates69 Peru66 Barbados59 Greece57 Iran52 Denmark51 Argentina46 Jordan44 Costa Rica44 Laos42 Australia42 Poland40 Guyana39 Romania37 Taiwan36 Cameroon35 Hong Kong34 Austria34 South Africa34 Ivory Coast32 Fiji32 Cambodia31 Saudi Arabia29 Lebanon29 Burma (Myanmar)28 Czechoslovakia27 Dominica26 Sri Lanka24 Morocco24 Switzerland22 Indonesia20 Uganda19 Serbia18 Armenia16 Bolivia16 Belize16 Cabo Verde16 Hungary15 Belgium13 Sweden12 Albania11 Kuwait11 Portugal11 Georgia11 Iraq11 Marshall Islands10 Bahamas9 Lithuania8 Yemen8 St. Vincent and the Grenadines8 St. Lucia8 Chile8 Bulgaria8 Kenya8 Azerbaijan7 Algeria6 Egypt6 Israel6 Uruguay5 New Zealand2 Tanzania
Grandparents responsible for own grandchildren in Norfolk
Grandparents (30 to 59 years) White / Caucasian 106 28.2% Responsible for grandchildren270 71.8% Not responsible for grandchildrenBlack or African American 803 76.0% Responsible for grandchildren254 24.0% Not responsible for grandchildrenAmerican Indian / Alaska Native 7 24.1% Responsible for grandchildren20 75.9% Not responsible for grandchildrenAsian 10 18.0% Responsible for grandchildren44 82.0% Not responsible for grandchildrenOther race 29 13.2% Responsible for grandchildren188 86.8% Not responsible for grandchildrenTwo or more races 33 54.5% Responsible for grandchildren27 45.5% Not responsible for grandchildrenWhite alone, not Hispanic / Latino 106 30.9% Responsible for grandchildren237 69.1% Not responsible for grandchildrenHispanic or Latino 62 31.1% Responsible for grandchildren138 68.9% Not responsible for grandchildrenGrandparents (60 years and over) White / Caucasian 126 27.5% Responsible for grandchildren333 72.5% Not responsible for grandchildrenBlack or African American 338 33.4% Responsible for grandchildren675 66.6% Not responsible for grandchildrenAmerican Indian / Alaska Native 13 100.0% Not responsible for grandchildrenAsian 14 18.5% Responsible for grandchildren60 81.5% Not responsible for grandchildrenOther race 64 100.0% Not responsible for grandchildrenTwo or more races 10 12.9% Responsible for grandchildren68 87.1% Not responsible for grandchildrenWhite alone, not Hispanic / Latino 126 27.5% Responsible for grandchildren333 72.5% Not responsible for grandchildrenHispanic or Latino 78 100.0% Not responsible for grandchildren
Zip codes: 23502 , 23503 , 23504 , 23505 , 23507 , 23508 , 23509 , 23510 , 23511 , 23513 , 23517 , 23518 , 23523 , 23551 .