Races in North Hampton, New Hampshire (NH) Detailed Stats
Ancestries, Foreign-born residents, place of birth

Recent posts about races in North Hampton, New Hampshire on our local forum with over 2,400,000 registered users:
 | Large NH Estate Home Finally Goes Under Contract And A New One Is Listed (14 replies) |
| North Hampton vs. Rye (4 replies) |
| Seacoast- In Depth (26 replies) |
| Airplane Traffic and Noise - Seacoast, Dover and Exeter Areas (23 replies) |
| Pay attention North Hampton NH (77 replies) |
| Relocating to Seacoast - Any opinions about North Hampton or Rye? (30 replies) |
2.2% of North Hampton, NH residents are foreign-born (1.4% born in Europe, 0.3% born in North America, 0.3% born in Asia), which is 126.5% less than the foreign-born rate of 5.0% across the entire state of New Hampshire.
Race distribution in North Hampton

- 4,16697.8%White alone
- 330.8%Hispanic
- 270.6%Asian alone
- 150.4%Two or more races
- 130.3%Black alone
- 30.07%Other race alone
- 20.05%American Indian alone
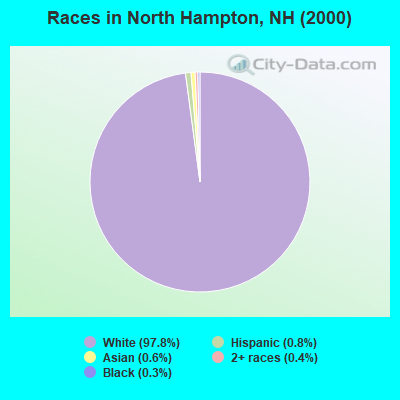
2000
2022
-
- 1,175,25295.1%White alone
- 20,4891.7%Hispanic
- 15,8031.3%Asian alone
- 11,6060.9%Two or more races
- 8,3540.7%Black alone
- 2,6980.2%American Indian alone
- 1,2540.1%Other race alone
- 3300.03%Native Hawaiian and Other
Pacific Islander alone

-
- 1,208,10186.6%White alone
- 63,4794.5%Hispanic
- 60,7244.4%Two or more races
- 36,5192.6%Asian alone
- 17,9311.3%Black alone
- 6,6150.5%Other race alone
- 1,0140.07%American Indian alone
- 8480.06%Native Hawaiian and Other
Pacific Islander alone

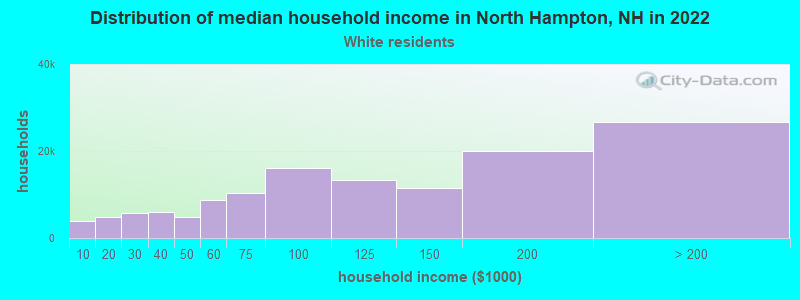
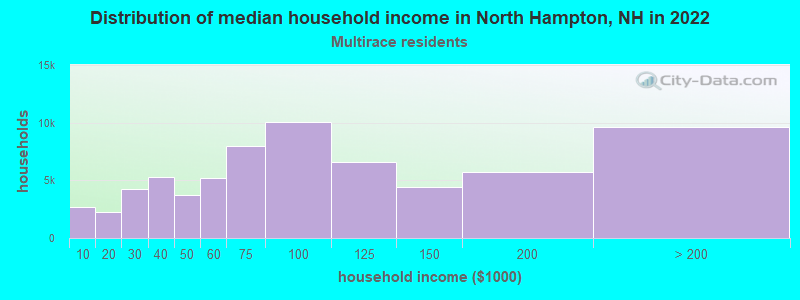
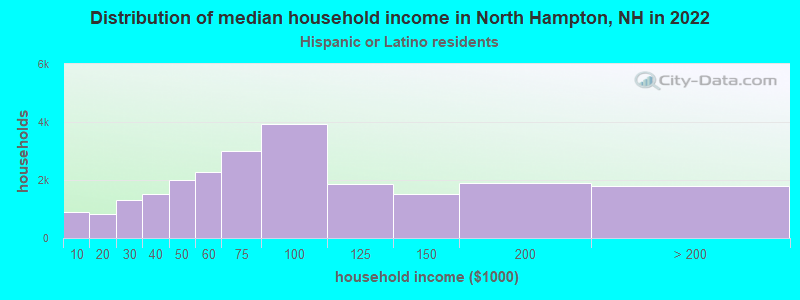
Income and house value in North Hampton
- Median household income in 2022
- $123,017White non-Hispanic householders
- $174,507Some other race householders
- over $200,000Two or more races householders
- $93,333Hispanic or Latino race householders
- Median 2022 house value
- $649,007White Non-Hispanic householders
- $496,533Some other race householders
- $528,311Two or more races householders
- $496,533Hispanic or Latino householders
Household income for White non-Hispanic householders
Household income for Two or more races householders
Household income for Hispanic or Latino race householders
Foreign-born residents in North Hampton
94 residents are foreign born (1.4% Europe, 0.3% North America, 0.3% Asia).
| This city: | 2.2% |
| New Hampshire: | 4.4% |
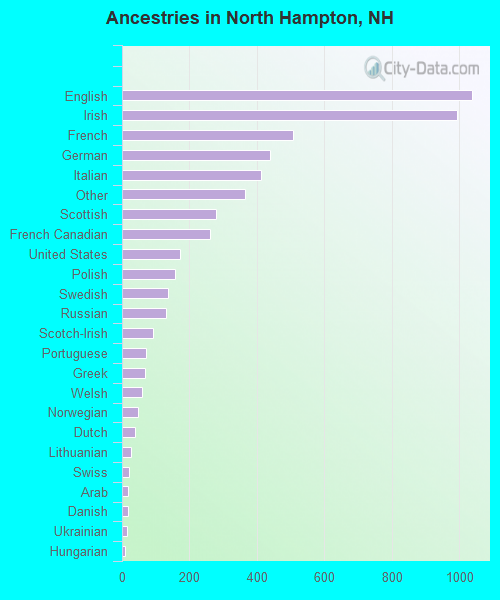
Ancestries in North Hampton

- 1,03719.3%English
- 99518.5%Irish
- 5079.4%French
- 4388.1%German
- 4117.6%Italian
- 3656.8%Other
- 2795.2%Scottish
- 2614.8%French Canadian
- 1733.2%United States
- 1562.9%Polish
- 1372.5%Swedish
- 1302.4%Russian
- 931.7%Scotch-Irish
- 701.3%Portuguese
- 671.2%Greek
- 601.1%Welsh
- 470.9%Norwegian
- 400.7%Dutch
- 280.5%Lithuanian
- 220.4%Swiss
- 180.3%Arab
- 170.3%Danish
- 150.3%Ukrainian
- 100.2%Hungarian
- 70.1%Czech
Zip codes: 03862.