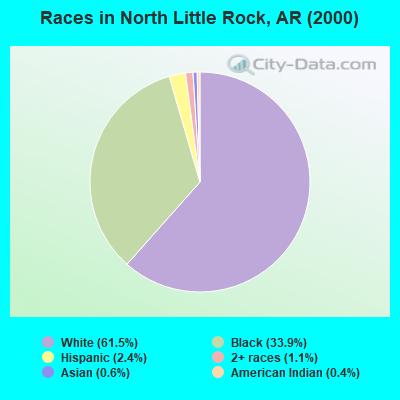
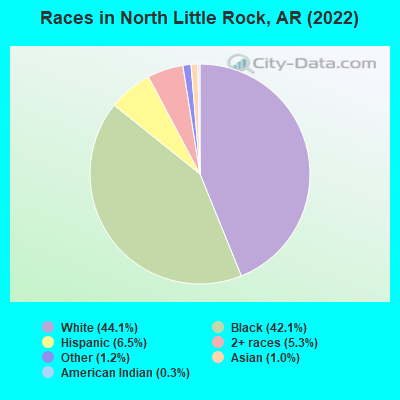
Races in North Little Rock, Arkansas (AR) Detailed Stats
Data:
Races - White alone (%)
Races - White alone (% change since 2000)
Races - Black alone (%)
Races - Black alone (% change since 2000)
Races - American Indian alone (%)
Races - American Indian alone (% change since 2000)
Races - Asian alone (%)
Races - Asian alone (% change since 2000)
Races - Hispanic (%)
Races - Hispanic (% change since 2000)
Races - Native Hawaiian and Other Pacific Islander alone (%)
Races - Native Hawaiian and Other Pacific Islander alone (% change since 2000)
Races - Two or more races(%)
Races - Two or more races(% change since 2000)
Races - Other race alone (%)
Races - Other race alone (% change since 2000)
Racial diversity
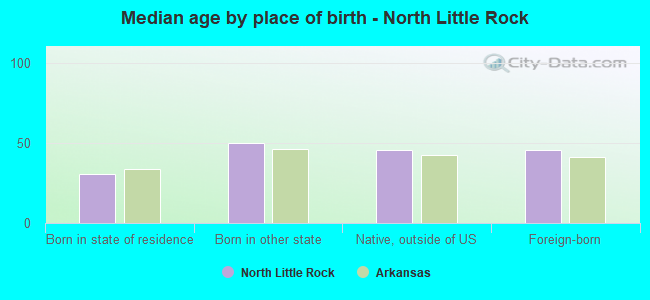
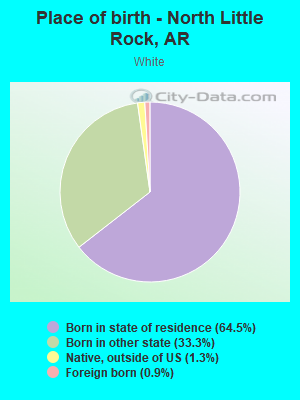
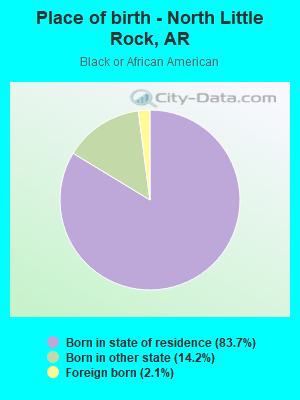
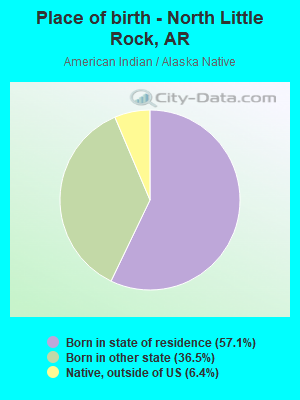
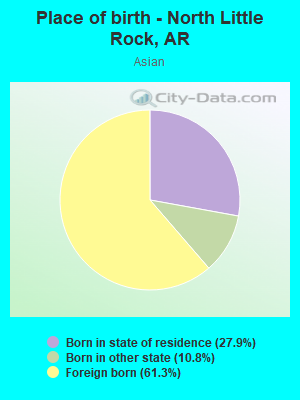
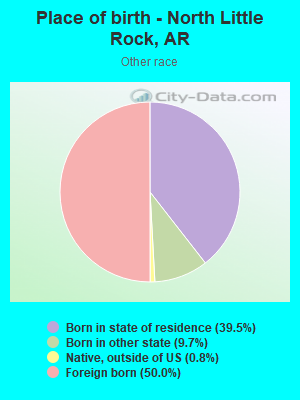
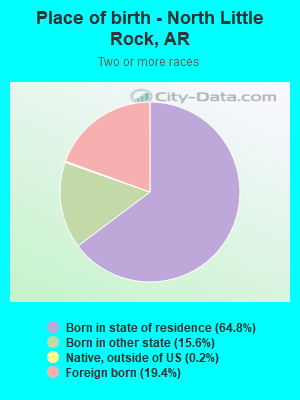
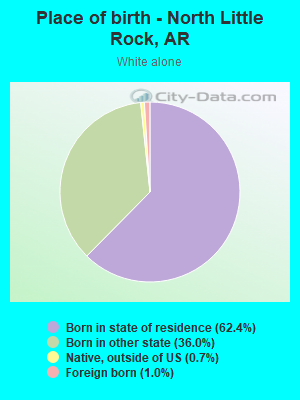
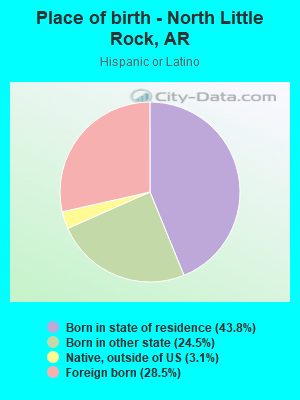
Place of birth - Born in state of residence (%)
Place of birth - Born in state of residence (%) - White
Place of birth - Born in state of residence (%) - Black or African American
Place of birth - Born in state of residence (%) - Asian
Place of birth - Born in state of residence (%) - Hispanic or Latino
Place of birth - Born in state of residence (%) - American Indian and Alaska Native
Place of birth - Born in state of residence (%) - Multirace
Place of birth - Born in state of residence (%) - Other Race
Place of birth - Born in other state (%)
Place of birth - Born in other state (%) - White
Place of birth - Born in other state (%) - Black or African American
Place of birth - Born in other state (%) - Asian
Place of birth - Born in other state (%) - Hispanic or Latino
Place of birth - Born in other state (%) - American Indian and Alaska Native
Place of birth - Born in other state (%) - Multirace
Place of birth - Born in other state (%) - Other Race
Place of birth - Native, outside of US (%)
Place of birth - Native, outside of US (%) - White
Place of birth - Native, outside of US (%) - Black or African American
Place of birth - Native, outside of US (%) - Asian
Place of birth - Native, outside of US (%) - Hispanic or Latino
Place of birth - Native, outside of US (%) - American Indian and Alaska Native
Place of birth - Native, outside of US (%) - Multirace
Place of birth - Native, outside of US (%) - Other Race
Place of birth - Foreign born (%)
Place of birth - Foreign born (%) - White
Place of birth - Foreign born (%) - Black or African American
Place of birth - Foreign born (%) - Asian
Place of birth - Foreign born (%) - Hispanic or Latino
Place of birth - Foreign born (%) - American Indian and Alaska Native
Place of birth - Foreign born (%) - Multirace
Place of birth - Foreign born (%) - Other Race
Residents speaking English at home (%)
Residents speaking English at home - Born in the United States (%)
Residents speaking English at home - Native, born elsewhere (%)
Residents speaking English at home - Foreign born (%)
Residents speaking Spanish at home (%)
Residents speaking Spanish at home - Born in the United States (%)
Residents speaking Spanish at home - Native, born elsewhere (%)
Residents speaking Spanish at home - Foreign born (%)
Residents speaking other language at home (%)
Residents speaking other language at home - Born in the United States (%)
Residents speaking other language at home - Native, born elsewhere (%)
Residents speaking other language at home - Foreign born (%)
Marital status - Never married (%)
Marital status - Now married (%)
Marital status - Separated (%)
Marital status - Widowed (%)
Marital status - Divorced (%)
Ancestries Reported - Arab (%)
Ancestries Reported - Czech (%)
Ancestries Reported - Danish (%)
Ancestries Reported - Dutch (%)
Ancestries Reported - English (%)
Ancestries Reported - French (%)
Ancestries Reported - French Canadian (%)
Ancestries Reported - German (%)
Ancestries Reported - Greek (%)
Ancestries Reported - Hungarian (%)
Ancestries Reported - Irish (%)
Ancestries Reported - Italian (%)
Ancestries Reported - Lithuanian (%)
Ancestries Reported - Norwegian (%)
Ancestries Reported - Polish (%)
Ancestries Reported - Portuguese (%)
Ancestries Reported - Russian (%)
Ancestries Reported - Scotch-Irish (%)
Ancestries Reported - Scottish (%)
Ancestries Reported - Slovak (%)
Ancestries Reported - Subsaharan African (%)
Ancestries Reported - Swedish (%)
Ancestries Reported - Swiss (%)
Ancestries Reported - Ukrainian (%)
Ancestries Reported - United States (%)
Ancestries Reported - Welsh (%)
Ancestries Reported - West Indian (%)
Ancestries Reported - Other (%)
Geographical mobility - Same house 1 year ago (%)
Geographical mobility - Same house 1 year ago (%) - White
Geographical mobility - Same house 1 year ago (%) - Black or African American
Geographical mobility - Same house 1 year ago (%) - Asian
Geographical mobility - Same house 1 year ago (%) - Hispanic or Latino
Geographical mobility - Same house 1 year ago (%) - American Indian and Alaska Native
Geographical mobility - Same house 1 year ago (%) - Multirace
Geographical mobility - Same house 1 year ago (%) - Other Race
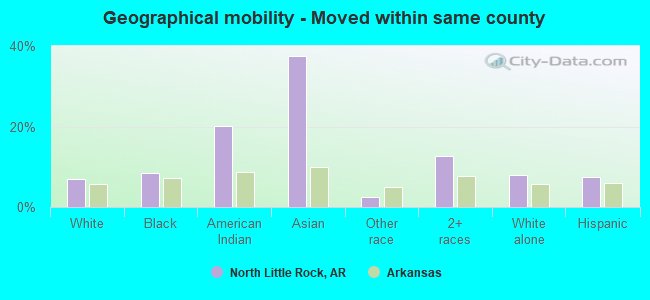
Geographical mobility - Moved within same county (%)
Geographical mobility - Moved within same county (%) - White
Geographical mobility - Moved within same county (%) - Black or African American
Geographical mobility - Moved within same county (%) - Asian
Geographical mobility - Moved within same county (%) - Hispanic or Latino
Geographical mobility - Moved within same county (%) - American Indian and Alaska Native
Geographical mobility - Moved within same county (%) - Multirace
Geographical mobility - Moved within same county (%) - Other Race
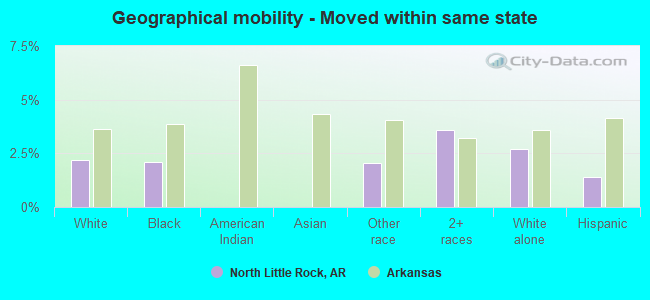
Geographical mobility - Moved from different county within same state (%)
Geographical mobility - Moved from different county within same state (%) - White
Geographical mobility - Moved from different county within same state (%) - Black or African American
Geographical mobility - Moved from different county within same state (%) - Asian
Geographical mobility - Moved from different county within same state (%) - Hispanic or Latino
Geographical mobility - Moved from different county within same state (%) - American Indian and Alaska Native
Geographical mobility - Moved from different county within same state (%) - Multirace
Geographical mobility - Moved from different county within same state (%) - Other Race
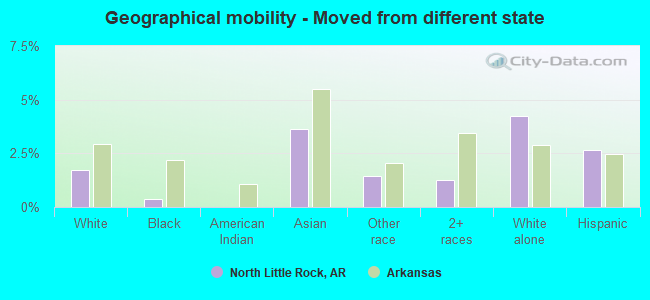
Geographical mobility - Moved from different state (%)
Geographical mobility - Moved from different state (%) - White
Geographical mobility - Moved from different state (%) - Black or African American
Geographical mobility - Moved from different state (%) - Asian
Geographical mobility - Moved from different state (%) - Hispanic or Latino
Geographical mobility - Moved from different state (%) - American Indian and Alaska Native
Geographical mobility - Moved from different state (%) - Multirace
Geographical mobility - Moved from different state (%) - Other Race
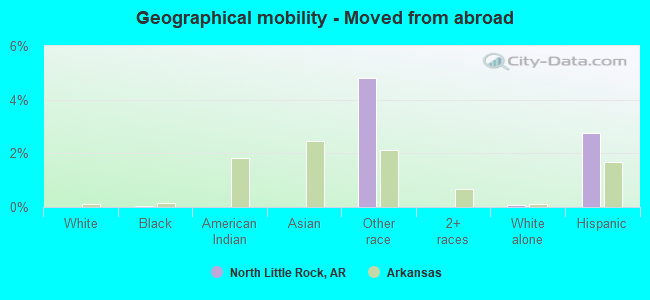
Geographical mobility - Moved from abroad (%)
Geographical mobility - Moved from abroad (%) - White
Geographical mobility - Moved from abroad (%) - Black or African American
Geographical mobility - Moved from abroad (%) - Asian
Geographical mobility - Moved from abroad (%) - Hispanic or Latino
Geographical mobility - Moved from abroad (%) - American Indian and Alaska Native
Geographical mobility - Moved from abroad (%) - Multirace
Geographical mobility - Moved from abroad (%) - Other Race
Place of birth for the foreign-born population - Ireland (%)
Place of birth for the foreign-born population - Denmark (%)
Place of birth for the foreign-born population - Norway (%)
Place of birth for the foreign-born population - Sweden (%)
Place of birth for the foreign-born population - United Kingdom (%)
Place of birth for the foreign-born population - England (%)
Place of birth for the foreign-born population - Scotland (%)
Place of birth for the foreign-born population - Other Northern Europe (%)
Place of birth for the foreign-born population - Austria (%)
Place of birth for the foreign-born population - Belgium (%)
Place of birth for the foreign-born population - France (%)
Place of birth for the foreign-born population - Germany (%)
Place of birth for the foreign-born population - Netherlands (%)
Place of birth for the foreign-born population - Switzerland (%)
Place of birth for the foreign-born population - Other Western Europe (%)
Place of birth for the foreign-born population - Greece (%)
Place of birth for the foreign-born population - Italy (%)
Place of birth for the foreign-born population - Portugal (%)
Place of birth for the foreign-born population - Spain (%)
Place of birth for the foreign-born population - Other Southern Europe (%)
Place of birth for the foreign-born population - Albania (%)
Place of birth for the foreign-born population - Belarus (%)
Place of birth for the foreign-born population - Bosnia and Herzegovina (%)
Place of birth for the foreign-born population - Bulgaria (%)
Place of birth for the foreign-born population - Croatia (%)
Place of birth for the foreign-born population - Czechoslovakia (%)
Place of birth for the foreign-born population - Hungary (%)
Place of birth for the foreign-born population - Latvia (%)
Place of birth for the foreign-born population - Lithuania (%)
Place of birth for the foreign-born population - North Macedonia (Macedonia) (%)
Place of birth for the foreign-born population - Moldova (%)
Place of birth for the foreign-born population - Poland (%)
Place of birth for the foreign-born population - Romania (%)
Place of birth for the foreign-born population - Russia (%)
Place of birth for the foreign-born population - Serbia (%)
Place of birth for the foreign-born population - Ukraine (%)
Place of birth for the foreign-born population - Other Eastern Europe (%)
Place of birth for the foreign-born population - China (%)
Place of birth for the foreign-born population - Hong Kong (%)
Place of birth for the foreign-born population - Taiwan (%)
Place of birth for the foreign-born population - Japan (%)
Place of birth for the foreign-born population - Korea (%)
Place of birth for the foreign-born population - Other Eastern Asia (%)
Place of birth for the foreign-born population - Afghanistan (%)
Place of birth for the foreign-born population - Bangladesh (%)
Place of birth for the foreign-born population - India (%)
Place of birth for the foreign-born population - Iran (%)
Place of birth for the foreign-born population - Kazakhstan (%)
Place of birth for the foreign-born population - Nepal (%)
Place of birth for the foreign-born population - Pakistan (%)
Place of birth for the foreign-born population - Sri Lanka (%)
Place of birth for the foreign-born population - Uzbekistan (%)
Place of birth for the foreign-born population - Other South Central Asia (%)
Place of birth for the foreign-born population - Burma (%)
Place of birth for the foreign-born population - Cambodia (%)
Place of birth for the foreign-born population - Indonesia (%)
Place of birth for the foreign-born population - Laos (%)
Place of birth for the foreign-born population - Malaysia (%)
Place of birth for the foreign-born population - Philippines (%)
Place of birth for the foreign-born population - Singapore (%)
Place of birth for the foreign-born population - Thailand (%)
Place of birth for the foreign-born population - Vietnam (%)
Place of birth for the foreign-born population - Other South Eastern Asia (%)
Place of birth for the foreign-born population - Armenia (%)
Place of birth for the foreign-born population - Iraq (%)
Place of birth for the foreign-born population - Israel (%)
Place of birth for the foreign-born population - Jordan (%)
Place of birth for the foreign-born population - Kuwait (%)
Place of birth for the foreign-born population - Lebanon (%)
Place of birth for the foreign-born population - Saudi Arabia (%)
Place of birth for the foreign-born population - Syria (%)
Place of birth for the foreign-born population - Turkey (%)
Place of birth for the foreign-born population - Yemen (%)
Place of birth for the foreign-born population - Other Western Asia (%)
Place of birth for the foreign-born population - Eritrea (%)
Place of birth for the foreign-born population - Ethiopia (%)
Place of birth for the foreign-born population - Kenya (%)
Place of birth for the foreign-born population - Somalia (%)
Place of birth for the foreign-born population - Uganda (%)
Place of birth for the foreign-born population - Zimbabwe (%)
Place of birth for the foreign-born population - Other Eastern Africa (%)
Place of birth for the foreign-born population - Cameroon (%)
Place of birth for the foreign-born population - Congo (%)
Place of birth for the foreign-born population - Democratic Republic of Congo (Zaire) (%)
Place of birth for the foreign-born population - Other Middle Africa (%)
Place of birth for the foreign-born population - Egypt (%)
Place of birth for the foreign-born population - Morocco (%)
Place of birth for the foreign-born population - Sudan (%)
Place of birth for the foreign-born population - Other Northern Africa (%)
Place of birth for the foreign-born population - South Africa (%)
Place of birth for the foreign-born population - Other Southern Africa (%)
Place of birth for the foreign-born population - Cabo Verde (%)
Place of birth for the foreign-born population - Ghana (%)
Place of birth for the foreign-born population - Liberia (%)
Place of birth for the foreign-born population - Nigeria (%)
Place of birth for the foreign-born population - Senegal (%)
Place of birth for the foreign-born population - Sierra Leone (%)
Place of birth for the foreign-born population - Other Western Africa (%)
Place of birth for the foreign-born population - Australia (%)
Place of birth for the foreign-born population - New Zealand (%)
Place of birth for the foreign-born population - Fiji (%)
Place of birth for the foreign-born population - Micronesia (%)
Place of birth for the foreign-born population - Bahamas (%)
Place of birth for the foreign-born population - Barbados (%)
Place of birth for the foreign-born population - Cuba (%)
Place of birth for the foreign-born population - Dominica (%)
Place of birth for the foreign-born population - Dominican Republic (%)
Place of birth for the foreign-born population - Grenada (%)
Place of birth for the foreign-born population - Haiti (%)
Place of birth for the foreign-born population - Jamaica (%)
Place of birth for the foreign-born population - St. Vincent and the Grenadines (%)
Place of birth for the foreign-born population - Trinidad and Tobago (%)
Place of birth for the foreign-born population - West Indies (%)
Place of birth for the foreign-born population - Other Caribbean (%)
Place of birth for the foreign-born population - Belize (%)
Place of birth for the foreign-born population - Costa Rica (%)
Place of birth for the foreign-born population - El Salvador (%)
Place of birth for the foreign-born population - Guatemala (%)
Place of birth for the foreign-born population - Honduras (%)
Place of birth for the foreign-born population - Mexico (%)
Place of birth for the foreign-born population - Nicaragua (%)
Place of birth for the foreign-born population - Panama (%)
Place of birth for the foreign-born population - Other Central America (%)
Place of birth for the foreign-born population - Argentina (%)
Place of birth for the foreign-born population - Bolivia (%)
Place of birth for the foreign-born population - Brazil (%)
Place of birth for the foreign-born population - Chile (%)
Place of birth for the foreign-born population - Colombia (%)
Place of birth for the foreign-born population - Ecuador (%)
Place of birth for the foreign-born population - Guyana (%)
Place of birth for the foreign-born population - Peru (%)
Place of birth for the foreign-born population - Uruguay (%)
Place of birth for the foreign-born population - Venezuela (%)
Place of birth for the foreign-born population - Other South America (%)
Place of birth for the foreign-born population - Canada (%)
Place of birth for the foreign-born population - Other Northern America (%)
Place of birth for the foreign-born population - Other (%)
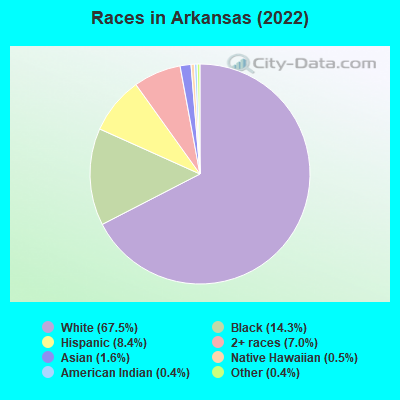
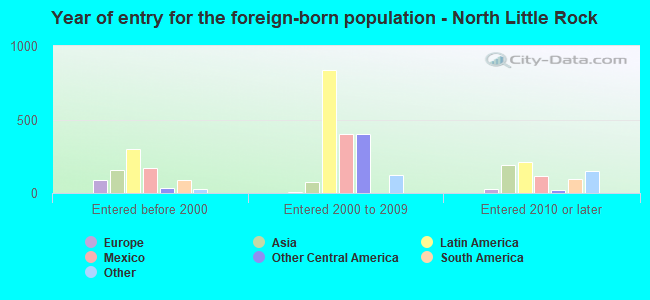
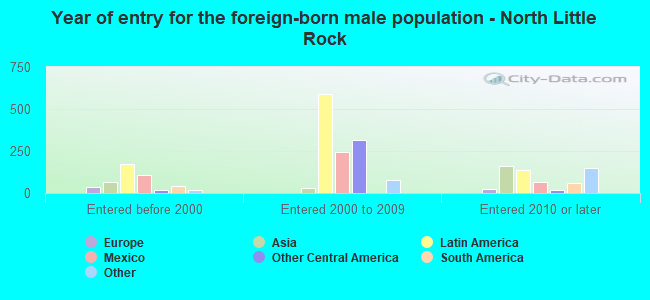
According to 2022 data, the most numerous races in North Little Rock, AR are White alone (28,782 residents), Black alone (29,244 residents), and Hispanic (4,553 residents). 94.5% of North Little Rock residents speak English at home. 3.3% of North Little Rock, AR residents are foreign-born (2.1% born in Latin America, 0.6% born in Asia), which is 20.0% less than the foreign-born rate of 4.0% across the entire state of Arkansas.
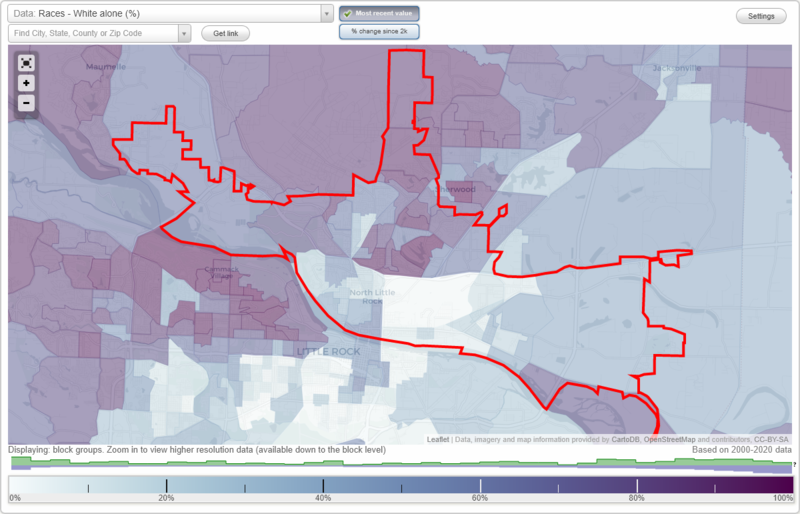
Race distribution in North Little Rock
2000 2022
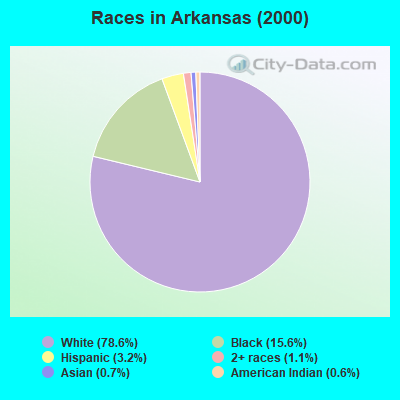
2,100,135 78.6% White alone 416,615 15.6% Black alone 86,866 3.2% Hispanic 30,364 1.1% Two or more races 19,892 0.7% Asian alone 16,702 0.6% American Indian alone 1,494 0.06% Native Hawaiian and Other 1,332 0.05% Other race alone
2,054,922 67.5% White alone 435,637 14.3% Black alone 255,416 8.4% Hispanic 213,684 7.0% Two or more races 47,592 1.6% Asian alone 14,176 0.5% Native Hawaiian and Other 12,680 0.4% American Indian alone 11,530 0.4% Other race alone
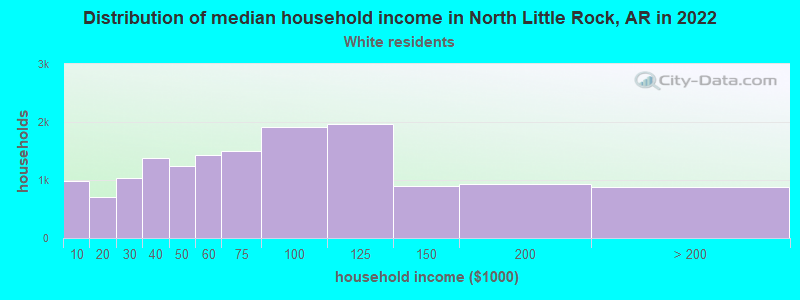
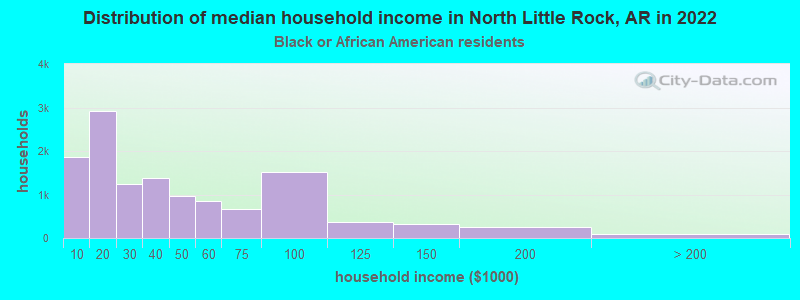
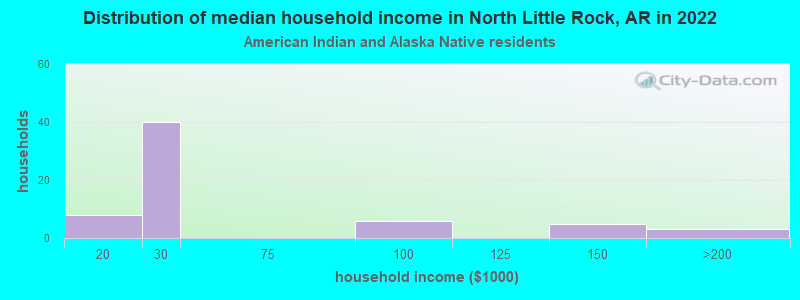
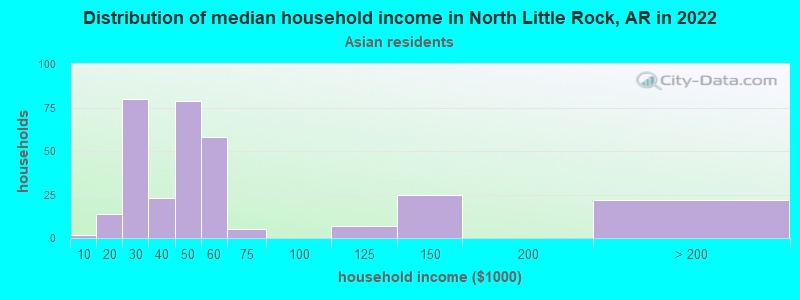
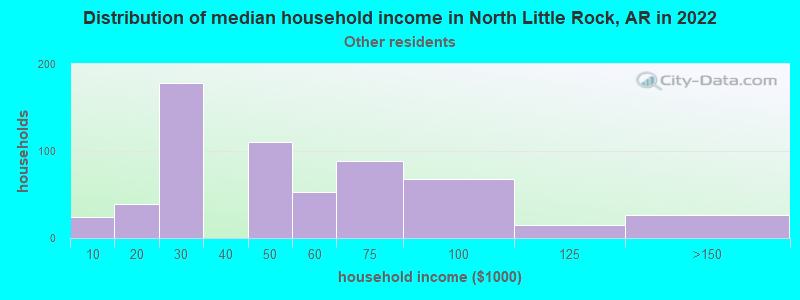
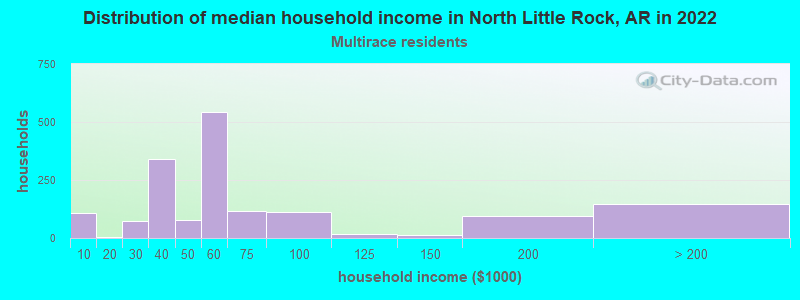
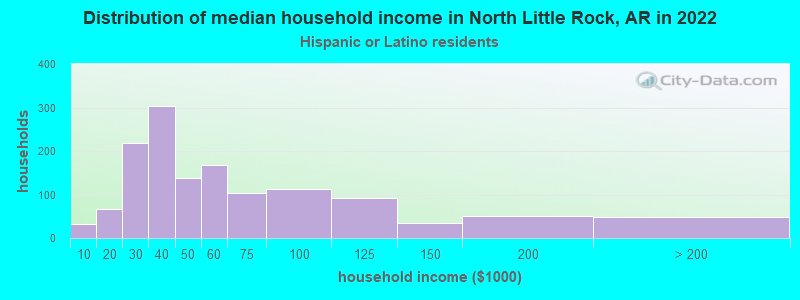
Income and house value in North Little Rock Median household income in 2022 $67,061 White non-Hispanic householders$39,123 Black householders$152,105 American Indian and Alaska Native householders$36,614 Asian householders$14,781 Native Hawaiian and other Pacific Islander householders$29,634 Some other race householders$78,143 Two or more races householders$56,406 Hispanic or Latino race householdersMedian 2022 house value $222,215 White Non-Hispanic householders$127,780 Black or African American householders$426,024 American Indian or Alaska Native householders $151,256 Asian householders$173,397 Native Hawaiian and other Pacific Islander householders$132,048 Some other race householders$247,558 Two or more races householders$240,089 Hispanic or Latino householders
Median age by race in North Little Rock
46.1 Median age for White residents47.1 44.9 30.3 Median age for Black or African American residents30.1 30.8 33.6 Median age for American Indian / Alaska Native residents39.0 33.0 34.4 Median age for Asian residents33.4 33.3 32.0 Median age for Other race residents38.3 18.0 15.1 Median age for Two or more races residents15.8 11.4 46.9 Median age for White alone residents48.6 45.2 18.4 Median age for Hispanic or Latino residents16.8 20.5
Owner/renter occupied households by race in North Little Rock
House owners and renters - White residents 10,439 69.0% Owner occupied4,697 31.0% Renter occupiedHouse owners and renters - Black or African American residents 3,898 36.8% Owner occupied6,708 63.2% Renter occupiedHouse owners and renters - American Indian / Alaska Native residents 26 38.0% Owner occupied43 62.0% Renter occupiedHouse owners and renters - Asian residents 73 21.3% Owner occupied271 78.7% Renter occupiedHouse owners and renters - Other race residents 196 48.1% Owner occupied212 51.9% Renter occupiedHouse owners and renters - Two or more races residents 628 52.7% Owner occupied563 47.3% Renter occupiedHouse owners and renters - White alone residents 10,144 68.0% Owner occupied4,781 32.0% Renter occupiedHouse owners and renters - Hispanic or Latino residents 509 55.6% Owner occupied406 44.4% Renter occupied
Language usage in North Little Rock
English speakers - Total 94.5% of residents of North Little Rock speak English at home.
4.2% of residents speak Spanish at home 1,371 53.1% Speak English very well1,213 46.9% Speak English less than very well1.2% of residents speak other language at home 529 68.8% Speak English very well240 31.2% Speak English less than very well
English speakers - Born in the United States 97.0% of residents of North Little Rock speak English at home.
2.4% of residents speak Spanish at home 367 87.8% Speak English very well51 12.2% Speak English less than very well0.5% of residents speak other language at home 90 100.0% Speak English very well
English speakers - Native, born elsewhere 52.1% of residents of North Little Rock speak English at home.
36.2% of residents speak Spanish at home 63 46.3% Speak English very well73 53.7% Speak English less than very well12.0% of residents speak other language at home 35 77.8% Speak English very well10 22.2% Speak English less than very well
English speakers - Foreign-born 24.4% of residents of North Little Rock speak English at home.
49.8% of residents speak Spanish at home 245 22.4% Speak English very well850 77.6% Speak English less than very well25.3% of residents speak other language at home 362 65.2% Speak English very well193 34.8% Speak English less than very well
White (Caucasian) - Speak only English Native:
97.9% (27,849)Foreign-born:
45.2% (173)
White (Caucasian) - Speak another language Native:
2.1% (592)Foreign-born:
60.0% (229)
Black or African American - Speak only English Native:
99.2% (26,746)Foreign-born:
7.6% (15)
Black or African American - Speak another language Native:
0.8% (204)Foreign-born:
100.0% (192)
Asian - Speak only English Native:
90.4% (150)Foreign-born:
28.9% (112)
Asian - Speak another language Native:
17.4% (29)Foreign-born:
70.9% (275)
Other race - Speak only English Native:
21.9% (155)Foreign-born:
38.2% (305)
Other race - Speak another language Native:
75.1% (531)Foreign-born:
73.6% (587)
Two or more races - Speak another language Native:
9.4% (449)Foreign-born:
80.3% (1,055)
White alone - Speak only English Native:
99.1% (27,157)Foreign-born:
73.4% (169)
White alone - Speak another language Native:
1.0% (262)Foreign-born:
33.1% (76)
Hispanic or Latino - Speak only English Native:
57.9% (1,532)Foreign-born:
35.5% (469)
Hispanic or Latino - Speak another language Native:
43.6% (1,155)Foreign-born:
73.3% (967)
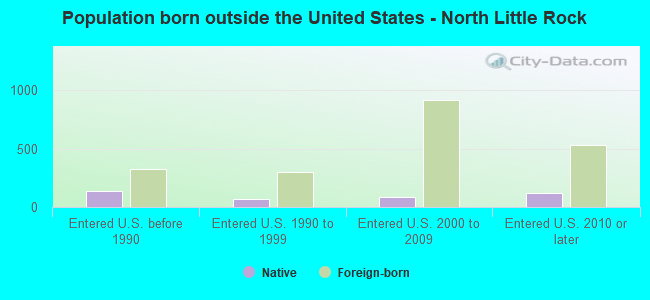
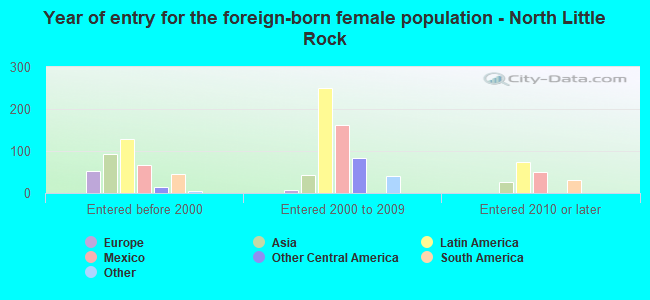
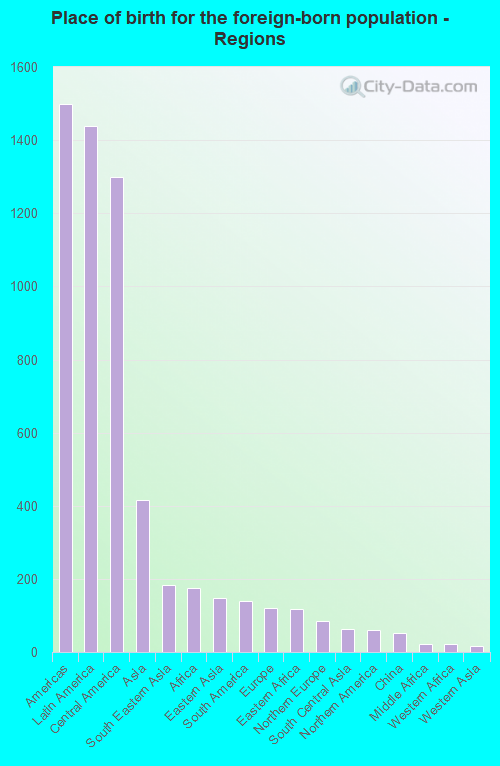
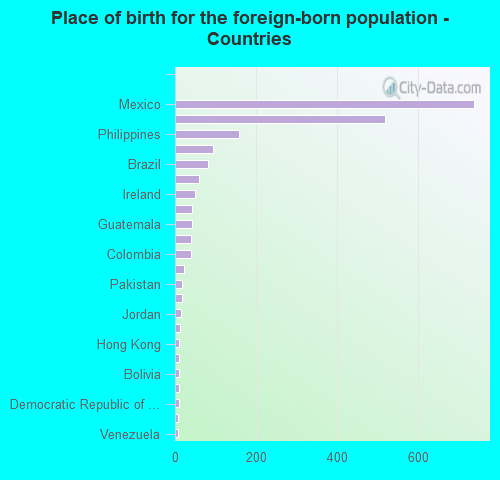
Foreign-born residents in North Little Rock 2,211 residents are foreign born (2.1% Latin America , 0.6% Asia ).
This city:
3.3%Arkansas:
100.0%
Marital status for residents in North Little Rock Marital status - White (Caucasian) population 15 years and over
Males 21.7% Never married54.9% Now married4.4% Separated2.1% Widowed17.1% DivorcedFemales 24.2% Never married46.9% Now married1.8% Separated15.4% Widowed11.6% DivorcedWomen who gave birth in the past 12 months Now married:
100.0% (274)Unmarried:
0.0% (0)
Women who did not give birth in the past 12 months Now married:
45.4% (3,034)Unmarried:
54.6% (3,652)
Marital status - Black or African American population 15 years and over
Males 46.5% Never married27.6% Now married0.0% Separated3.2% Widowed22.7% DivorcedFemales 49.0% Never married24.4% Now married5.4% Separated3.3% Widowed17.9% DivorcedWomen who gave birth in the past 12 months Now married:
100.0% (520)Unmarried:
0.0% (0)
Women who did not give birth in the past 12 months Now married:
22.8% (1,520)Unmarried:
77.2% (5,134)
Marital status - American Indian / Alaska Native population 15 years and over
Males 0.0% Never married76.1% Now married16.4% Separated0.0% Widowed7.5% DivorcedFemales 53.3% Never married28.0% Now married13.3% Separated0.0% Widowed5.3% DivorcedWomen who did not give birth in the past 12 months Now married:
21.4% (9)Unmarried:
78.6% (34)
Marital status - Asian population 15 years and over
Males 53.1% Never married37.2% Now married0.0% Separated0.0% Widowed9.7% DivorcedFemales 33.2% Never married58.6% Now married0.0% Separated0.0% Widowed8.2% DivorcedWomen who gave birth in the past 12 months Now married:
100.0% (50)Unmarried:
0.0% (0)
Women who did not give birth in the past 12 months Now married:
34.9% (45)Unmarried:
65.1% (85)
Marital status - Other race population 15 years and over
Males 62.0% Never married29.2% Now married6.0% Separated0.9% Widowed1.9% DivorcedFemales 26.7% Never married50.7% Now married7.2% Separated6.6% Widowed8.9% DivorcedWomen who gave birth in the past 12 months Now married:
0.0% (0)Unmarried:
100.0% (16)
Women who did not give birth in the past 12 months Now married:
56.0% (207)Unmarried:
44.0% (163)
Marital status - Two or more races population 15 years and over
Males 53.7% Never married22.2% Now married1.5% Separated0.0% Widowed22.6% DivorcedFemales 80.6% Never married7.8% Now married3.7% Separated1.0% Widowed6.9% DivorcedWomen who gave birth in the past 12 months Now married:
6.6% (20)Unmarried:
93.4% (289)
Women who did not give birth in the past 12 months Now married:
2.8% (50)Unmarried:
97.2% (1,699)
Marital status - White alone, not Hispanic / Latino population 15 years and over
Males 22.1% Never married54.4% Now married4.5% Separated2.1% Widowed16.9% DivorcedFemales 24.4% Never married46.7% Now married1.9% Separated15.7% Widowed11.4% DivorcedWomen who gave birth in the past 12 months Now married:
100.0% (280)Unmarried:
0.0% (0)
Women who did not give birth in the past 12 months Now married:
44.8% (2,935)Unmarried:
55.2% (3,611)
Marital status - Hispanic or Latino population 15 years and over
Males 52.5% Never married36.6% Now married1.4% Separated1.1% Widowed8.4% DivorcedFemales 28.3% Never married53.1% Now married3.8% Separated3.5% Widowed11.3% DivorcedWomen who gave birth in the past 12 months Now married:
88.3% (61)Unmarried:
11.7% (8)
Women who did not give birth in the past 12 months Now married:
46.8% (392)Unmarried:
53.2% (445)
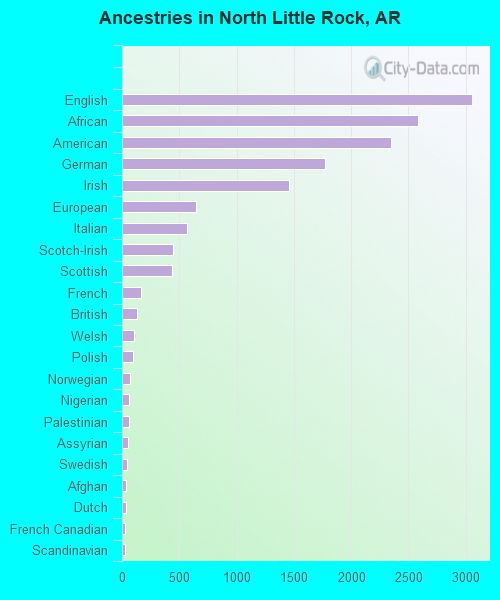
Ancestries in North Little Rock
2,702 6.8% American2,386 6.0% English2,340 5.9% African1,559 3.9% Irish1,250 3.2% German1,102 2.8% European455 1.1% Italian270 0.7% Scotch-Irish233 0.6% Scottish164 0.4% French146 0.4% Polish111 0.3% British90 0.2% Norwegian85 0.2% Northern European68 0.2% Welsh66 0.2% Dutch58 0.1% Swiss53 0.1% Swedish51 0.1% Scandinavian41 0.1% Assyrian35 0.09% Greek33 0.08% Russian32 0.08% Nigerian21 0.05% Austrian20 0.05% French Canadian18 0.05% Lebanese14 0.04% Finnish12 0.03% Ghanaian11 0.03% Danish10 0.03% Hungarian9 0.02% Palestinian8 0.02% Slovak6 0.02% Eastern European5 0.01% Canadian5 0.01% Portuguese5 0.01% Armenian4 0.01% Romanian3 0.01% Cajun
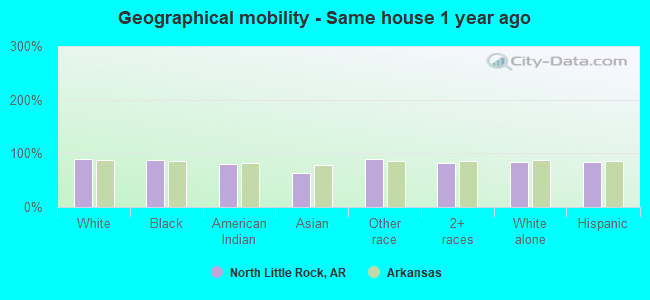
Geographical mobility in North Little Rock Same house 1 year ago 27,392 89.1% White (Caucasian)25,723 88.1% Black or African American97 79.9% American Indian / Alaska Native389 63.2% Asian1,594 88.9% Other race4,770 81.5% Two or more races24,699 84.9% White alone, not Hispanic / Latino3,574 84.9% Hispanic or LatinoMoved within same county 2,171 7.1% White / Caucasian2,481 8.5% Black or African American24 20.2% American Indian / Alaska Native231 37.6% Asian46 2.5% Other race745 12.7% Two or more races2,301 7.9% White alone, not Hispanic / Latino318 7.6% Hispanic or LatinoMoved within same state 668 2.2% White / Caucasian610 2.1% Black or African American37 2.0% Other race209 3.6% Two or more races791 2.7% White alone, not Hispanic / Latino59 1.4% Hispanic or LatinoMoved from different state 527 1.7% White / Caucasian109 0.4% Black or African American22 3.6% Asian26 1.4% Other race75 1.3% Two or more races1,233 4.2% White alone, not Hispanic / Latino112 2.7% Hispanic or LatinoMoved from abroad 7 0.0% Black or African American86 4.8% Other race23 0.1% White alone, not Hispanic / Latino116 2.8% Hispanic or Latino
Children Nativity (place of birth) in North Little Rock
Children under 6 years - Living with two parents Both parents native 1,933 100.0% NativeBoth parents foreign-born 174 100.0% NativeOne native, one foreign-born parent 129 100.0% NativeChildren under 6 years - Living with one parent Native parent 2,689 99.5% Native12 0.5% Foreign-bornForeign-born parent 119 100.0% NativeChildren 6 to 17 years - Living with two parents Both parents native 3,598 100.0% NativeBoth parents foreign-born 481 96.5% Native18 3.5% Foreign-bornOne native, one foreign-born parent 371 100.0% NativeChildren 6 to 17 years - Living with one parent Native parent 5,191 100.0% NativeForeign-born parent 135 51.3% Native128 48.7% Foreign-born
Grandparents responsible for own grandchildren in North Little Rock
Grandparents (30 to 59 years) White / Caucasian 35 15.2% Responsible for grandchildren198 84.8% Not responsible for grandchildrenBlack or African American 41 17.6% Responsible for grandchildren190 82.4% Not responsible for grandchildrenAsian 5 100.0% Responsible for grandchildrenWhite alone, not Hispanic / Latino 39 16.2% Responsible for grandchildren200 83.8% Not responsible for grandchildrenHispanic or Latino 17 100.0% Not responsible for grandchildrenGrandparents (60 years and over) White / Caucasian 73 57.6% Responsible for grandchildren54 42.4% Not responsible for grandchildrenBlack or African American 186 45.8% Responsible for grandchildren220 54.2% Not responsible for grandchildrenWhite alone, not Hispanic / Latino 83 56.6% Responsible for grandchildren64 43.4% Not responsible for grandchildren