Races in North Salt Lake, Utah (UT) Detailed Stats
Data:
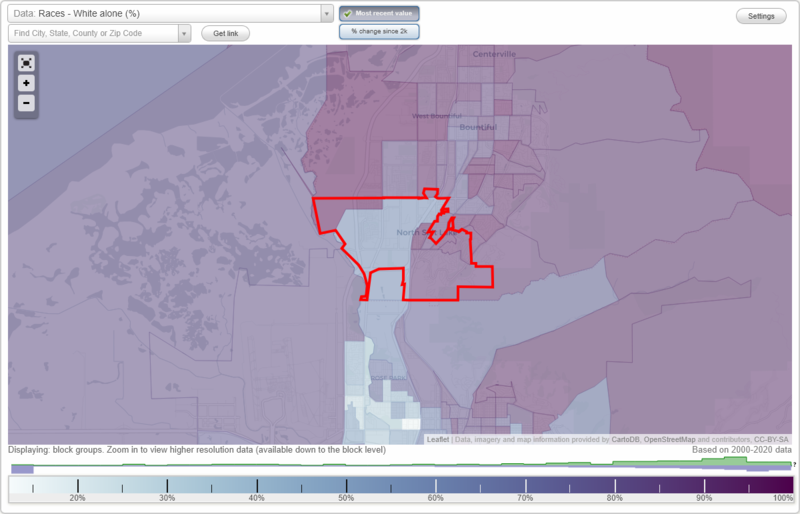
Races - White alone (%)
Races - White alone (% change since 2000)
Races - Black alone (%)
Races - Black alone (% change since 2000)
Races - American Indian alone (%)
Races - American Indian alone (% change since 2000)
Races - Asian alone (%)
Races - Asian alone (% change since 2000)
Races - Hispanic (%)
Races - Hispanic (% change since 2000)
Races - Native Hawaiian and Other Pacific Islander alone (%)
Races - Native Hawaiian and Other Pacific Islander alone (% change since 2000)
Races - Two or more races(%)
Races - Two or more races(% change since 2000)
Races - Other race alone (%)
Races - Other race alone (% change since 2000)
Racial diversity
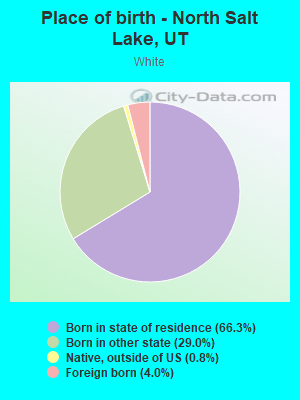
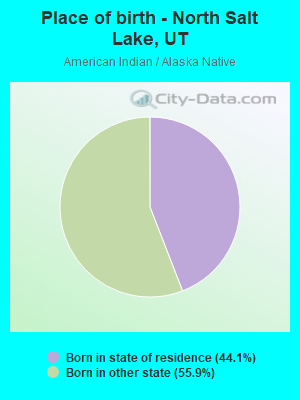
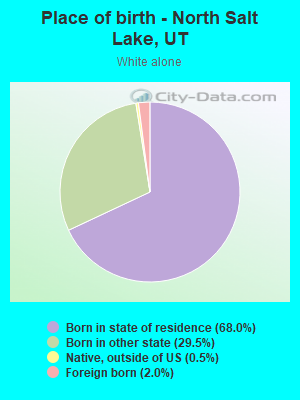
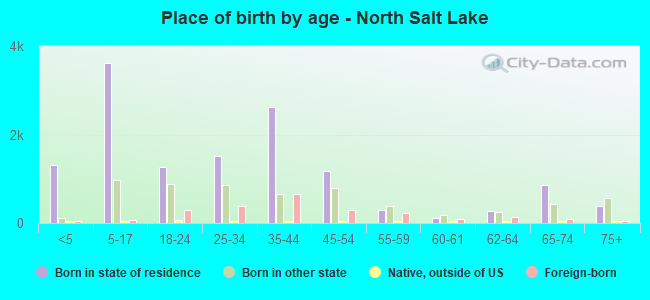
Place of birth - Born in state of residence (%)
Place of birth - Born in state of residence (%) - White
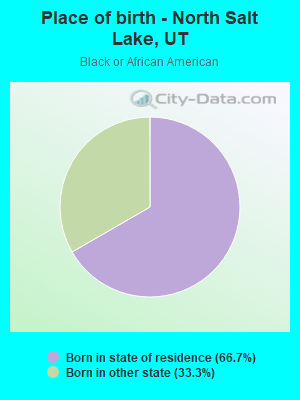
Place of birth - Born in state of residence (%) - Black or African American
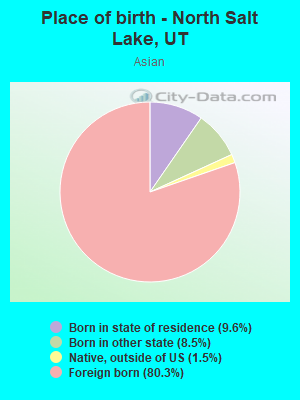
Place of birth - Born in state of residence (%) - Asian
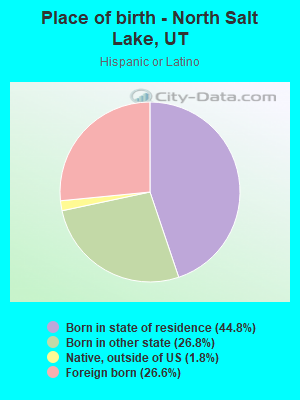
Place of birth - Born in state of residence (%) - Hispanic or Latino
Place of birth - Born in state of residence (%) - American Indian and Alaska Native
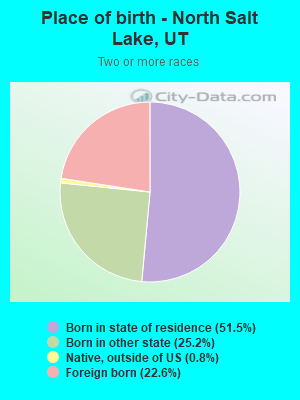
Place of birth - Born in state of residence (%) - Multirace
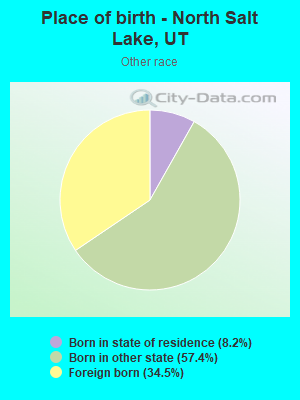
Place of birth - Born in state of residence (%) - Other Race
Place of birth - Born in other state (%)
Place of birth - Born in other state (%) - White
Place of birth - Born in other state (%) - Black or African American
Place of birth - Born in other state (%) - Asian
Place of birth - Born in other state (%) - Hispanic or Latino
Place of birth - Born in other state (%) - American Indian and Alaska Native
Place of birth - Born in other state (%) - Multirace
Place of birth - Born in other state (%) - Other Race
Place of birth - Native, outside of US (%)
Place of birth - Native, outside of US (%) - White
Place of birth - Native, outside of US (%) - Black or African American
Place of birth - Native, outside of US (%) - Asian
Place of birth - Native, outside of US (%) - Hispanic or Latino
Place of birth - Native, outside of US (%) - American Indian and Alaska Native
Place of birth - Native, outside of US (%) - Multirace
Place of birth - Native, outside of US (%) - Other Race
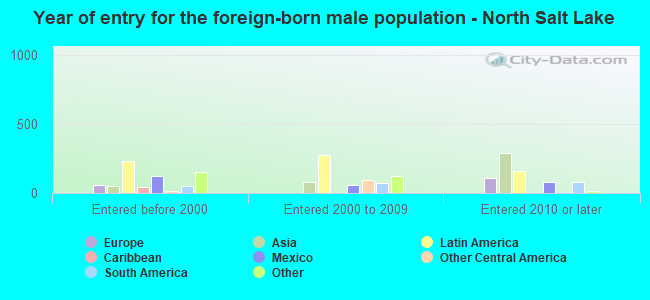
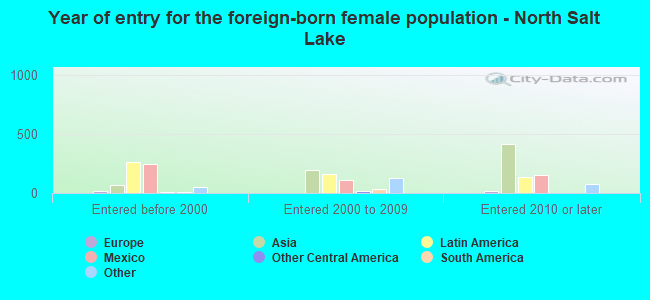
Place of birth - Foreign born (%)
Place of birth - Foreign born (%) - White
Place of birth - Foreign born (%) - Black or African American
Place of birth - Foreign born (%) - Asian
Place of birth - Foreign born (%) - Hispanic or Latino
Place of birth - Foreign born (%) - American Indian and Alaska Native
Place of birth - Foreign born (%) - Multirace
Place of birth - Foreign born (%) - Other Race
Residents speaking English at home (%)
Residents speaking English at home - Born in the United States (%)
Residents speaking English at home - Native, born elsewhere (%)
Residents speaking English at home - Foreign born (%)
Residents speaking Spanish at home (%)
Residents speaking Spanish at home - Born in the United States (%)
Residents speaking Spanish at home - Native, born elsewhere (%)
Residents speaking Spanish at home - Foreign born (%)
Residents speaking other language at home (%)
Residents speaking other language at home - Born in the United States (%)
Residents speaking other language at home - Native, born elsewhere (%)
Residents speaking other language at home - Foreign born (%)
Marital status - Never married (%)
Marital status - Now married (%)
Marital status - Separated (%)
Marital status - Widowed (%)
Marital status - Divorced (%)
Ancestries Reported - Arab (%)
Ancestries Reported - Czech (%)
Ancestries Reported - Danish (%)
Ancestries Reported - Dutch (%)
Ancestries Reported - English (%)
Ancestries Reported - French (%)
Ancestries Reported - French Canadian (%)
Ancestries Reported - German (%)
Ancestries Reported - Greek (%)
Ancestries Reported - Hungarian (%)
Ancestries Reported - Irish (%)
Ancestries Reported - Italian (%)
Ancestries Reported - Lithuanian (%)
Ancestries Reported - Norwegian (%)
Ancestries Reported - Polish (%)
Ancestries Reported - Portuguese (%)
Ancestries Reported - Russian (%)
Ancestries Reported - Scotch-Irish (%)
Ancestries Reported - Scottish (%)
Ancestries Reported - Slovak (%)
Ancestries Reported - Subsaharan African (%)
Ancestries Reported - Swedish (%)
Ancestries Reported - Swiss (%)
Ancestries Reported - Ukrainian (%)
Ancestries Reported - United States (%)
Ancestries Reported - Welsh (%)
Ancestries Reported - West Indian (%)
Ancestries Reported - Other (%)
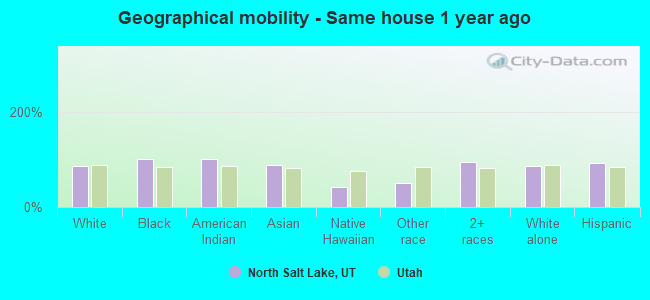
Geographical mobility - Same house 1 year ago (%)
Geographical mobility - Same house 1 year ago (%) - White
Geographical mobility - Same house 1 year ago (%) - Black or African American
Geographical mobility - Same house 1 year ago (%) - Asian
Geographical mobility - Same house 1 year ago (%) - Hispanic or Latino
Geographical mobility - Same house 1 year ago (%) - American Indian and Alaska Native
Geographical mobility - Same house 1 year ago (%) - Multirace
Geographical mobility - Same house 1 year ago (%) - Other Race
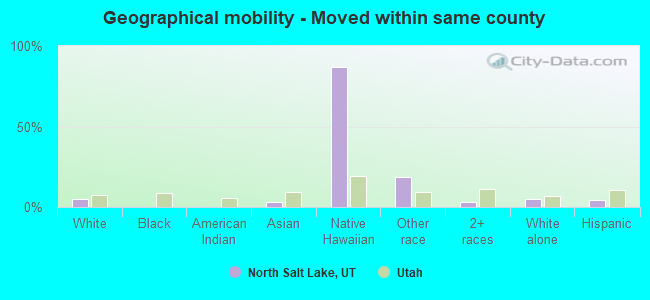
Geographical mobility - Moved within same county (%)
Geographical mobility - Moved within same county (%) - White
Geographical mobility - Moved within same county (%) - Black or African American
Geographical mobility - Moved within same county (%) - Asian
Geographical mobility - Moved within same county (%) - Hispanic or Latino
Geographical mobility - Moved within same county (%) - American Indian and Alaska Native
Geographical mobility - Moved within same county (%) - Multirace
Geographical mobility - Moved within same county (%) - Other Race
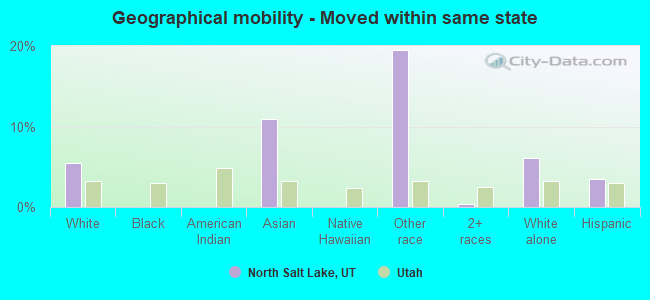
Geographical mobility - Moved from different county within same state (%)
Geographical mobility - Moved from different county within same state (%) - White
Geographical mobility - Moved from different county within same state (%) - Black or African American
Geographical mobility - Moved from different county within same state (%) - Asian
Geographical mobility - Moved from different county within same state (%) - Hispanic or Latino
Geographical mobility - Moved from different county within same state (%) - American Indian and Alaska Native
Geographical mobility - Moved from different county within same state (%) - Multirace
Geographical mobility - Moved from different county within same state (%) - Other Race
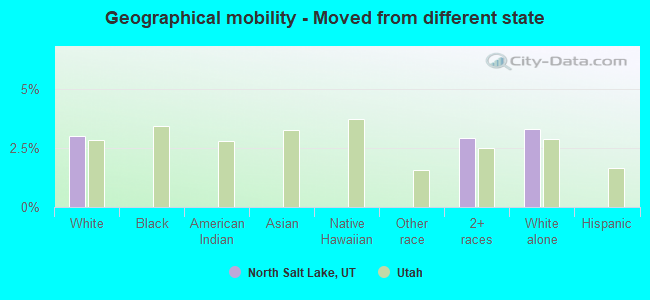
Geographical mobility - Moved from different state (%)
Geographical mobility - Moved from different state (%) - White
Geographical mobility - Moved from different state (%) - Black or African American
Geographical mobility - Moved from different state (%) - Asian
Geographical mobility - Moved from different state (%) - Hispanic or Latino
Geographical mobility - Moved from different state (%) - American Indian and Alaska Native
Geographical mobility - Moved from different state (%) - Multirace
Geographical mobility - Moved from different state (%) - Other Race
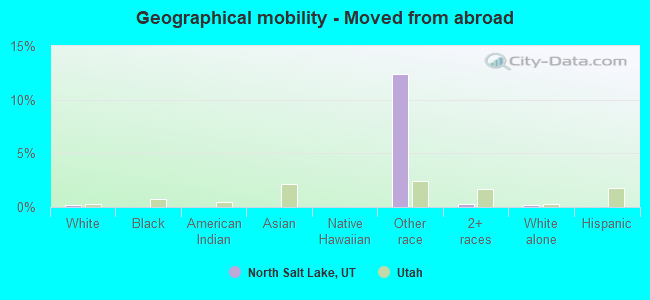
Geographical mobility - Moved from abroad (%)
Geographical mobility - Moved from abroad (%) - White
Geographical mobility - Moved from abroad (%) - Black or African American
Geographical mobility - Moved from abroad (%) - Asian
Geographical mobility - Moved from abroad (%) - Hispanic or Latino
Geographical mobility - Moved from abroad (%) - American Indian and Alaska Native
Geographical mobility - Moved from abroad (%) - Multirace
Geographical mobility - Moved from abroad (%) - Other Race
Place of birth for the foreign-born population - Ireland (%)
Place of birth for the foreign-born population - Denmark (%)
Place of birth for the foreign-born population - Norway (%)
Place of birth for the foreign-born population - Sweden (%)
Place of birth for the foreign-born population - United Kingdom (%)
Place of birth for the foreign-born population - England (%)
Place of birth for the foreign-born population - Scotland (%)
Place of birth for the foreign-born population - Other Northern Europe (%)
Place of birth for the foreign-born population - Austria (%)
Place of birth for the foreign-born population - Belgium (%)
Place of birth for the foreign-born population - France (%)
Place of birth for the foreign-born population - Germany (%)
Place of birth for the foreign-born population - Netherlands (%)
Place of birth for the foreign-born population - Switzerland (%)
Place of birth for the foreign-born population - Other Western Europe (%)
Place of birth for the foreign-born population - Greece (%)
Place of birth for the foreign-born population - Italy (%)
Place of birth for the foreign-born population - Portugal (%)
Place of birth for the foreign-born population - Spain (%)
Place of birth for the foreign-born population - Other Southern Europe (%)
Place of birth for the foreign-born population - Albania (%)
Place of birth for the foreign-born population - Belarus (%)
Place of birth for the foreign-born population - Bosnia and Herzegovina (%)
Place of birth for the foreign-born population - Bulgaria (%)
Place of birth for the foreign-born population - Croatia (%)
Place of birth for the foreign-born population - Czechoslovakia (%)
Place of birth for the foreign-born population - Hungary (%)
Place of birth for the foreign-born population - Latvia (%)
Place of birth for the foreign-born population - Lithuania (%)
Place of birth for the foreign-born population - North Macedonia (Macedonia) (%)
Place of birth for the foreign-born population - Moldova (%)
Place of birth for the foreign-born population - Poland (%)
Place of birth for the foreign-born population - Romania (%)
Place of birth for the foreign-born population - Russia (%)
Place of birth for the foreign-born population - Serbia (%)
Place of birth for the foreign-born population - Ukraine (%)
Place of birth for the foreign-born population - Other Eastern Europe (%)
Place of birth for the foreign-born population - China (%)
Place of birth for the foreign-born population - Hong Kong (%)
Place of birth for the foreign-born population - Taiwan (%)
Place of birth for the foreign-born population - Japan (%)
Place of birth for the foreign-born population - Korea (%)
Place of birth for the foreign-born population - Other Eastern Asia (%)
Place of birth for the foreign-born population - Afghanistan (%)
Place of birth for the foreign-born population - Bangladesh (%)
Place of birth for the foreign-born population - India (%)
Place of birth for the foreign-born population - Iran (%)
Place of birth for the foreign-born population - Kazakhstan (%)
Place of birth for the foreign-born population - Nepal (%)
Place of birth for the foreign-born population - Pakistan (%)
Place of birth for the foreign-born population - Sri Lanka (%)
Place of birth for the foreign-born population - Uzbekistan (%)
Place of birth for the foreign-born population - Other South Central Asia (%)
Place of birth for the foreign-born population - Burma (%)
Place of birth for the foreign-born population - Cambodia (%)
Place of birth for the foreign-born population - Indonesia (%)
Place of birth for the foreign-born population - Laos (%)
Place of birth for the foreign-born population - Malaysia (%)
Place of birth for the foreign-born population - Philippines (%)
Place of birth for the foreign-born population - Singapore (%)
Place of birth for the foreign-born population - Thailand (%)
Place of birth for the foreign-born population - Vietnam (%)
Place of birth for the foreign-born population - Other South Eastern Asia (%)
Place of birth for the foreign-born population - Armenia (%)
Place of birth for the foreign-born population - Iraq (%)
Place of birth for the foreign-born population - Israel (%)
Place of birth for the foreign-born population - Jordan (%)
Place of birth for the foreign-born population - Kuwait (%)
Place of birth for the foreign-born population - Lebanon (%)
Place of birth for the foreign-born population - Saudi Arabia (%)
Place of birth for the foreign-born population - Syria (%)
Place of birth for the foreign-born population - Turkey (%)
Place of birth for the foreign-born population - Yemen (%)
Place of birth for the foreign-born population - Other Western Asia (%)
Place of birth for the foreign-born population - Eritrea (%)
Place of birth for the foreign-born population - Ethiopia (%)
Place of birth for the foreign-born population - Kenya (%)
Place of birth for the foreign-born population - Somalia (%)
Place of birth for the foreign-born population - Uganda (%)
Place of birth for the foreign-born population - Zimbabwe (%)
Place of birth for the foreign-born population - Other Eastern Africa (%)
Place of birth for the foreign-born population - Cameroon (%)
Place of birth for the foreign-born population - Congo (%)
Place of birth for the foreign-born population - Democratic Republic of Congo (Zaire) (%)
Place of birth for the foreign-born population - Other Middle Africa (%)
Place of birth for the foreign-born population - Egypt (%)
Place of birth for the foreign-born population - Morocco (%)
Place of birth for the foreign-born population - Sudan (%)
Place of birth for the foreign-born population - Other Northern Africa (%)
Place of birth for the foreign-born population - South Africa (%)
Place of birth for the foreign-born population - Other Southern Africa (%)
Place of birth for the foreign-born population - Cabo Verde (%)
Place of birth for the foreign-born population - Ghana (%)
Place of birth for the foreign-born population - Liberia (%)
Place of birth for the foreign-born population - Nigeria (%)
Place of birth for the foreign-born population - Senegal (%)
Place of birth for the foreign-born population - Sierra Leone (%)
Place of birth for the foreign-born population - Other Western Africa (%)
Place of birth for the foreign-born population - Australia (%)
Place of birth for the foreign-born population - New Zealand (%)
Place of birth for the foreign-born population - Fiji (%)
Place of birth for the foreign-born population - Micronesia (%)
Place of birth for the foreign-born population - Bahamas (%)
Place of birth for the foreign-born population - Barbados (%)
Place of birth for the foreign-born population - Cuba (%)
Place of birth for the foreign-born population - Dominica (%)
Place of birth for the foreign-born population - Dominican Republic (%)
Place of birth for the foreign-born population - Grenada (%)
Place of birth for the foreign-born population - Haiti (%)
Place of birth for the foreign-born population - Jamaica (%)
Place of birth for the foreign-born population - St. Vincent and the Grenadines (%)
Place of birth for the foreign-born population - Trinidad and Tobago (%)
Place of birth for the foreign-born population - West Indies (%)
Place of birth for the foreign-born population - Other Caribbean (%)
Place of birth for the foreign-born population - Belize (%)
Place of birth for the foreign-born population - Costa Rica (%)
Place of birth for the foreign-born population - El Salvador (%)
Place of birth for the foreign-born population - Guatemala (%)
Place of birth for the foreign-born population - Honduras (%)
Place of birth for the foreign-born population - Mexico (%)
Place of birth for the foreign-born population - Nicaragua (%)
Place of birth for the foreign-born population - Panama (%)
Place of birth for the foreign-born population - Other Central America (%)
Place of birth for the foreign-born population - Argentina (%)
Place of birth for the foreign-born population - Bolivia (%)
Place of birth for the foreign-born population - Brazil (%)
Place of birth for the foreign-born population - Chile (%)
Place of birth for the foreign-born population - Colombia (%)
Place of birth for the foreign-born population - Ecuador (%)
Place of birth for the foreign-born population - Guyana (%)
Place of birth for the foreign-born population - Peru (%)
Place of birth for the foreign-born population - Uruguay (%)
Place of birth for the foreign-born population - Venezuela (%)
Place of birth for the foreign-born population - Other South America (%)
Place of birth for the foreign-born population - Canada (%)
Place of birth for the foreign-born population - Other Northern America (%)
Place of birth for the foreign-born population - Other (%)
According to 2022 data, the most numerous races in North Salt Lake, UT are White alone (16,294 residents), Hispanic (3,544 residents), and Two or more races (896 residents). 81.5% of North Salt Lake residents speak English at home. 13.9% of North Salt Lake, UT residents are foreign-born (5.5% born in Latin America, 4.6% born in Asia, 1.8% born in Oceania), which is 42.4% greater than the foreign-born rate of 8.0% across the entire state of Utah.
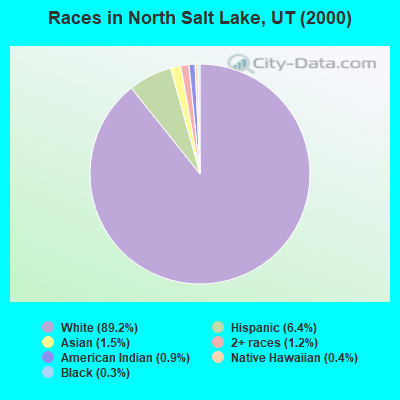
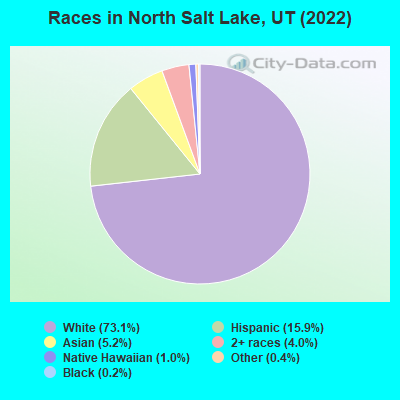
Race distribution in North Salt Lake
2000 2022
1,904,265 85.3% White alone 201,559 9.0% Hispanic 36,483 1.6% Asian alone 31,308 1.4% Two or more races 26,663 1.2% American Indian alone 14,806 0.7% Native Hawaiian and Other 16,137 0.7% Black alone 1,948 0.09% Other race alone
2,557,466 75.6% White alone 512,086 15.1% Hispanic 119,308 3.5% Two or more races 82,388 2.4% Asian alone 36,978 1.1% Native Hawaiian and Other 34,873 1.0% Black alone 22,803 0.7% American Indian alone 14,898 0.4% Other race alone
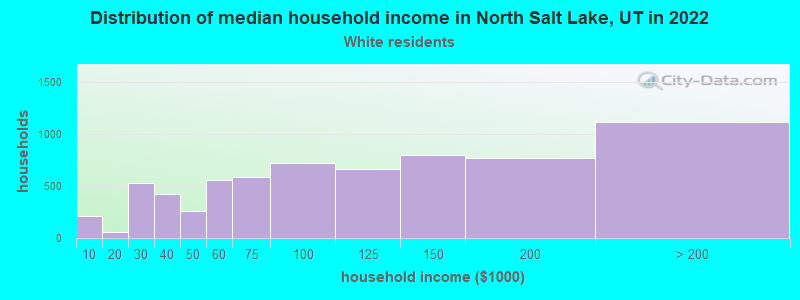
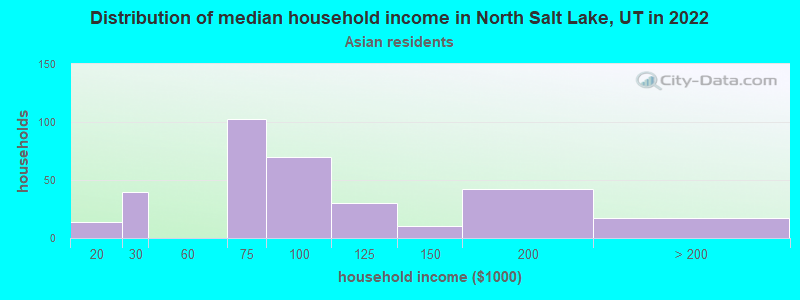
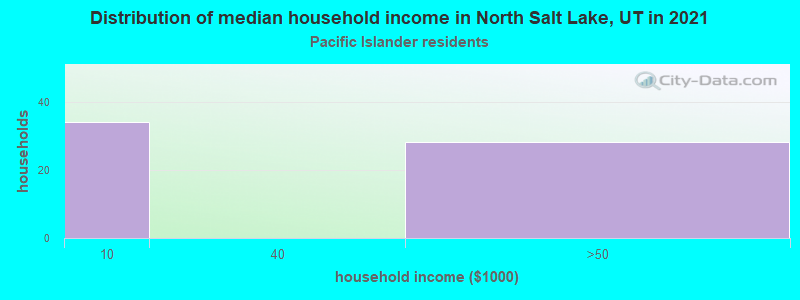
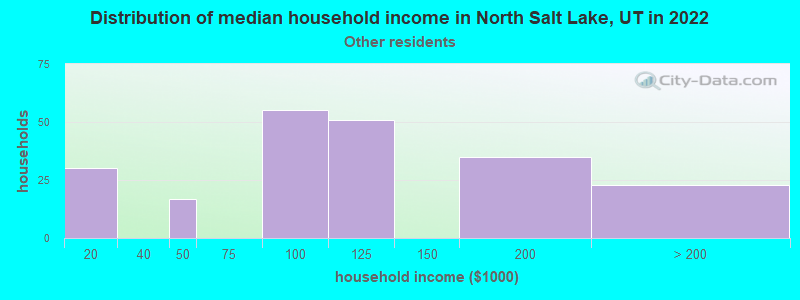
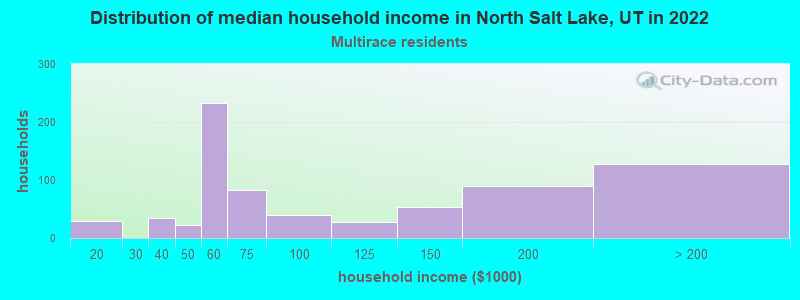
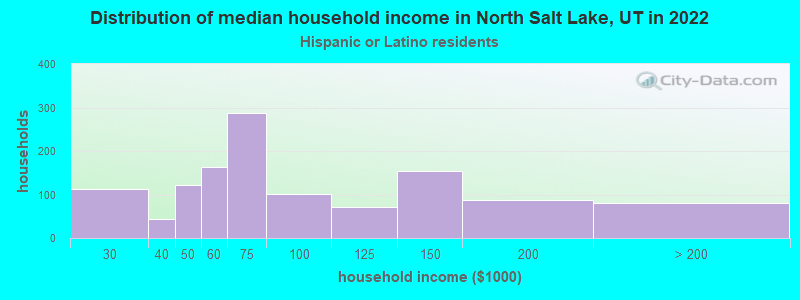
Income and house value in North Salt Lake Median household income in 2022 $108,391 White non-Hispanic householders$82,254 Asian householders$88,771 Some other race householders$61,504 Hispanic or Latino race householdersMedian 2022 house value $594,139 White Non-Hispanic householders$475,795 American Indian or Alaska Native householders over $1,000,000 Asian householdersover $1,000,000 Some other race householders$479,256 Hispanic or Latino householders
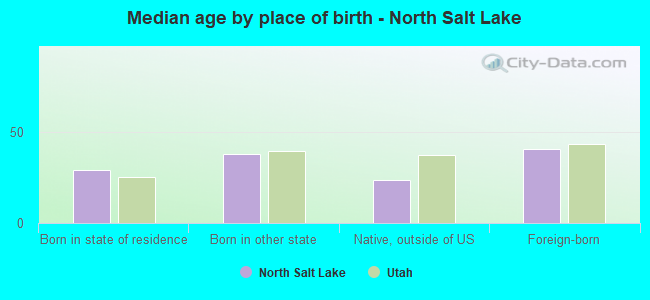
Median age by race in North Salt Lake
35.9 Median age for White residents34.5 36.4 -597,785,977.3 Median age for Black or African American residents-752,759,381.1 -584,362,139.3 -564,430,244.4 Median age for American Indian / Alaska Native residents-686,346,862.8 -386,961,093.2 29.4 Median age for Asian residents28.5 36.5 18.6 Median age for Native Hawaiian / Pacific Islander residents-580,419,579.8 12.9 31.8 Median age for Other race residents24.0 29.4 18.4 Median age for Two or more races residents21.3 17.7 36.3 Median age for White alone residents35.1 36.3 25.8 Median age for Hispanic or Latino residents25.1 31.8
Owner/renter occupied households by race in North Salt Lake
House owners and renters - White residents 4,797 72.5% Owner occupied1,820 27.5% Renter occupiedHouse owners and renters - American Indian / Alaska Native residents 4 100.0% Owner occupiedHouse owners and renters - Asian residents 183 66.7% Owner occupied91 33.3% Renter occupiedHouse owners and renters - Native Hawaiian / Pacific Islander residents 81 100.0% Renter occupiedHouse owners and renters - Other race residents 133 53.1% Owner occupied117 46.9% Renter occupiedHouse owners and renters - Two or more races residents 358 60.2% Owner occupied237 39.8% Renter occupiedHouse owners and renters - White alone residents 4,473 74.4% Owner occupied1,537 25.6% Renter occupiedHouse owners and renters - Hispanic or Latino residents 611 50.4% Owner occupied602 49.6% Renter occupied
Language usage in North Salt Lake
English speakers - Total 81.5% of residents of North Salt Lake speak English at home.
8.1% of residents speak Spanish at home 1,298 77.1% Speak English very well386 22.9% Speak English less than very well10.6% of residents speak other language at home 1,469 66.8% Speak English very well731 33.2% Speak English less than very well
English speakers - Born in the United States 85.0% of residents of North Salt Lake speak English at home.
12.7% of residents speak Spanish at home 742 98.4% Speak English very well12 1.6% Speak English less than very well4.0% of residents speak other language at home 221 94.4% Speak English very well13 5.6% Speak English less than very well
English speakers - Native, born elsewhere 84.8% of residents of North Salt Lake speak English at home.
13.2% of residents speak other language at home 20 100.0% Speak English very well
English speakers - Foreign-born 16.3% of residents of North Salt Lake speak English at home.
23.3% of residents speak Spanish at home 253 45.3% Speak English very well306 54.7% Speak English less than very well59.6% of residents speak other language at home 851 59.6% Speak English very well578 40.4% Speak English less than very well
White (Caucasian) - Speak only English Native:
93.6% (14,990)Foreign-born:
24.7% (176)
White (Caucasian) - Speak another language Native:
6.4% (1,030)Foreign-born:
74.7% (530)
Asian - Speak another language Native:
18.5% (39)Foreign-born:
100.0% (916)
Other race - Speak only English Native:
20.3% (67)Foreign-born:
61.4% (99)
Other race - Speak another language Native:
75.9% (249)Foreign-born:
61.0% (98)
Two or more races - Speak only English Native:
75.2% (1,066)Foreign-born:
29.9% (149)
Two or more races - Speak another language Native:
25.1% (356)Foreign-born:
62.1% (309)
White alone - Speak only English Native:
96.0% (14,303)Foreign-born:
49.5% (164)
White alone - Speak another language Native:
4.0% (601)Foreign-born:
50.0% (166)
Hispanic or Latino - Speak only English Native:
63.2% (1,406)Foreign-born:
29.0% (265)
Hispanic or Latino - Speak another language Native:
36.8% (819)Foreign-born:
67.0% (612)
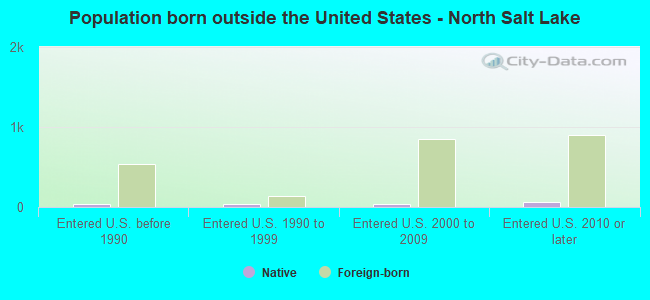
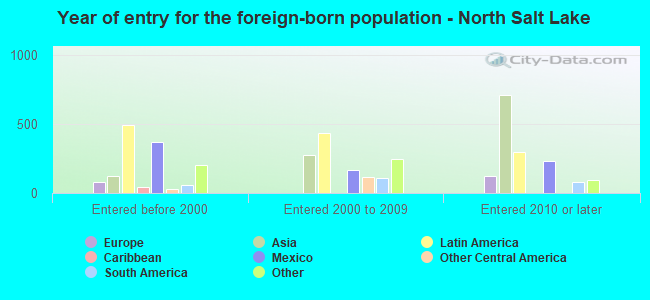
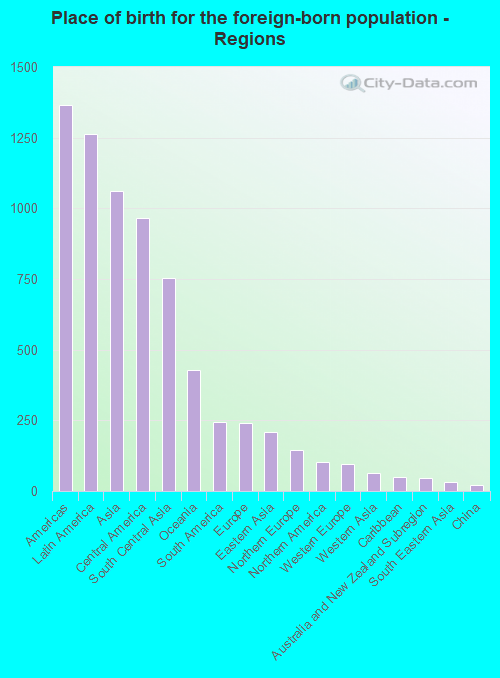
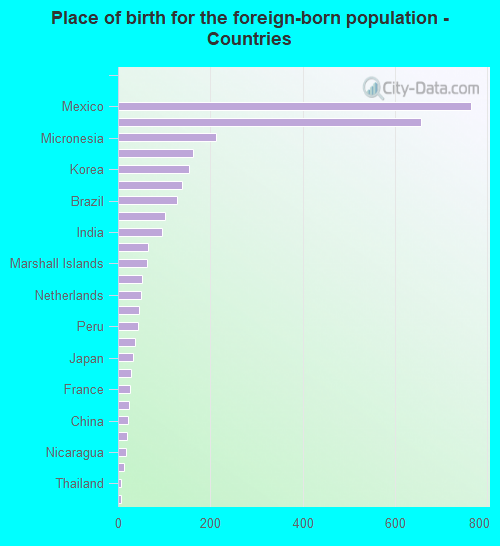
Foreign-born residents in North Salt Lake 3,096 residents are foreign born (5.5% Latin America , 4.6% Asia , 1.8% Oceania ).
Marital status for residents in North Salt Lake Marital status - White (Caucasian) population 15 years and over
Males 25.6% Never married64.3% Now married0.2% Separated2.1% Widowed7.8% DivorcedFemales 23.6% Never married58.4% Now married0.7% Separated6.2% Widowed11.1% DivorcedWomen who gave birth in the past 12 months Now married:
100.0% (303)Unmarried:
0.0% (0)
Women who did not give birth in the past 12 months Now married:
53.6% (2,494)Unmarried:
46.4% (2,161)
Marital status - American Indian / Alaska Native population 15 years and over
Males 100.0% Never married0.0% Now married0.0% Separated0.0% Widowed0.0% DivorcedFemales 0.0% Never married0.0% Now married0.0% Separated0.0% Widowed100.0% DivorcedMarital status - Asian population 15 years and over
Males 71.2% Never married28.8% Now married0.0% Separated0.0% Widowed0.0% DivorcedFemales 36.7% Never married41.2% Now married12.8% Separated0.0% Widowed9.4% DivorcedWomen who gave birth in the past 12 months Now married:
100.0% (33)Unmarried:
0.0% (0)
Women who did not give birth in the past 12 months Now married:
21.1% (74)Unmarried:
78.9% (279)
Marital status - Native Hawaiian / Pacific Islander population 15 years and over
Males 0.0% Never married100.0% Now married0.0% Separated0.0% Widowed0.0% DivorcedFemales 70.7% Never married29.3% Now married0.0% Separated0.0% Widowed0.0% DivorcedWomen who did not give birth in the past 12 months Now married:
18.2% (27)Unmarried:
81.8% (122)
Marital status - Other race population 15 years and over
Males 51.9% Never married48.1% Now married0.0% Separated0.0% Widowed0.0% DivorcedFemales 48.8% Never married51.2% Now married0.0% Separated0.0% Widowed0.0% DivorcedWomen who gave birth in the past 12 months Now married:
0.0% (0)Unmarried:
100.0% (85)
Women who did not give birth in the past 12 months Now married:
100.0% (57)Unmarried:
0.0% (0)
Marital status - Two or more races population 15 years and over
Males 50.5% Never married43.5% Now married0.0% Separated0.0% Widowed6.0% DivorcedFemales 49.4% Never married31.6% Now married0.0% Separated0.0% Widowed19.1% DivorcedWomen who did not give birth in the past 12 months Now married:
27.9% (166)Unmarried:
72.1% (429)
Marital status - White alone, not Hispanic / Latino population 15 years and over
Males 23.4% Never married65.5% Now married0.2% Separated2.4% Widowed8.6% DivorcedFemales 23.1% Never married61.6% Now married0.0% Separated5.1% Widowed10.1% DivorcedWomen who gave birth in the past 12 months Now married:
100.0% (304)Unmarried:
0.0% (0)
Women who did not give birth in the past 12 months Now married:
55.3% (2,326)Unmarried:
44.7% (1,881)
Marital status - Hispanic or Latino population 15 years and over
Males 44.4% Never married51.5% Now married0.0% Separated0.0% Widowed4.1% DivorcedFemales 33.3% Never married38.8% Now married4.2% Separated9.8% Widowed13.9% DivorcedWomen who gave birth in the past 12 months Now married:
0.0% (0)Unmarried:
100.0% (85)
Women who did not give birth in the past 12 months Now married:
46.7% (365)Unmarried:
53.3% (416)
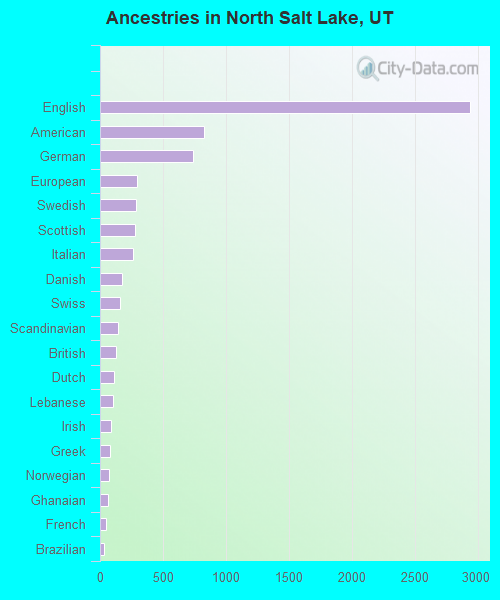
Ancestries in North Salt Lake
2,944 28.5% English830 8.0% American739 7.1% German295 2.9% European288 2.8% Swedish281 2.7% Scottish260 2.5% Italian178 1.7% Danish159 1.5% Swiss142 1.4% Scandinavian130 1.3% British113 1.1% Dutch102 1.0% Lebanese85 0.8% Irish83 0.8% Greek75 0.7% Norwegian63 0.6% Ghanaian45 0.4% French34 0.3% Brazilian22 0.2% Welsh14 0.1% Finnish13 0.1% Northern European13 0.1% Polish12 0.1% Ukrainian8 0.08% Canadian
Geographical mobility in North Salt Lake Same house 1 year ago 15,336 85.7% White (Caucasian)51 100.0% Black or African American11 100.0% American Indian / Alaska Native1,084 88.0% Asian87 40.8% Native Hawaiian / Pacific Islander265 50.4% Other race2,002 93.7% Two or more races13,685 84.7% White alone, not Hispanic / Latino3,151 91.7% Hispanic or LatinoMoved within same county 854 4.8% White / Caucasian41 3.3% Asian185 87.0% Native Hawaiian / Pacific Islander97 18.5% Other race63 3.0% Two or more races793 4.9% White alone, not Hispanic / Latino141 4.1% Hispanic or LatinoMoved within same state 977 5.5% White / Caucasian134 10.9% Asian102 19.4% Other race9 0.4% Two or more races982 6.1% White alone, not Hispanic / Latino121 3.5% Hispanic or LatinoMoved from different state 537 3.0% White / Caucasian62 2.9% Two or more races530 3.3% White alone, not Hispanic / LatinoMoved from abroad 29 0.2% White65 12.4% Other race7 0.3% Two or more races29 0.2% White alone, not Hispanic / Latino
Children Nativity (place of birth) in North Salt Lake
Children under 6 years - Living with two parents Both parents native 1,244 100.0% NativeBoth parents foreign-born 72 100.0% NativeOne native, one foreign-born parent 364 100.0% NativeChildren under 6 years - Living with one parent Native parent 272 100.0% NativeForeign-born parent 46 100.0% NativeChildren 6 to 17 years - Living with two parents Both parents native 2,447 100.0% NativeBoth parents foreign-born 192 68.6% Native88 31.4% Foreign-bornOne native, one foreign-born parent 167 100.0% NativeChildren 6 to 17 years - Living with one parent Native parent 970 100.0% NativeForeign-born parent 201 53.0% Native178 47.0% Foreign-born
Grandparents responsible for own grandchildren in North Salt Lake
Grandparents (30 to 59 years) White / Caucasian 62 54.2% Responsible for grandchildren53 45.8% Not responsible for grandchildrenWhite alone, not Hispanic / Latino 72 59.4% Responsible for grandchildren49 40.6% Not responsible for grandchildrenGrandparents (60 years and over) White / Caucasian 14 14.1% Responsible for grandchildren82 85.9% Not responsible for grandchildrenWhite alone, not Hispanic / Latino 14 14.0% Responsible for grandchildren83 86.0% Not responsible for grandchildren