Races in North Valley, New Mexico (NM) Detailed Stats
Data:
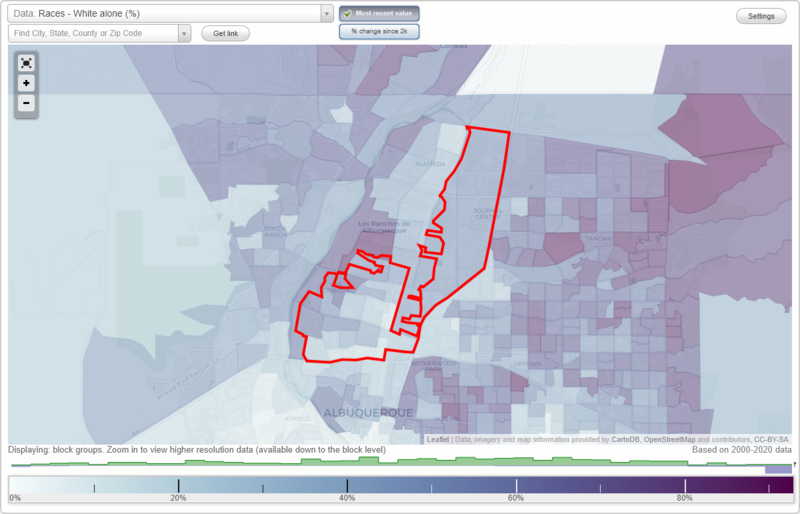
Races - White alone (%)
Races - White alone (% change since 2000)
Races - Black alone (%)
Races - Black alone (% change since 2000)
Races - American Indian alone (%)
Races - American Indian alone (% change since 2000)
Races - Asian alone (%)
Races - Asian alone (% change since 2000)
Races - Hispanic (%)
Races - Hispanic (% change since 2000)
Races - Native Hawaiian and Other Pacific Islander alone (%)
Races - Native Hawaiian and Other Pacific Islander alone (% change since 2000)
Races - Two or more races(%)
Races - Two or more races(% change since 2000)
Races - Other race alone (%)
Races - Other race alone (% change since 2000)
Racial diversity
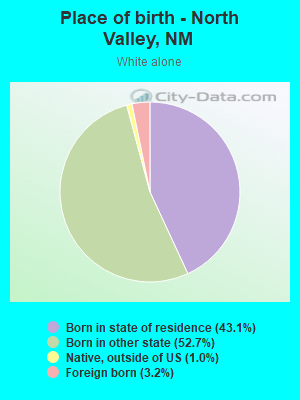
Place of birth - Born in state of residence (%)
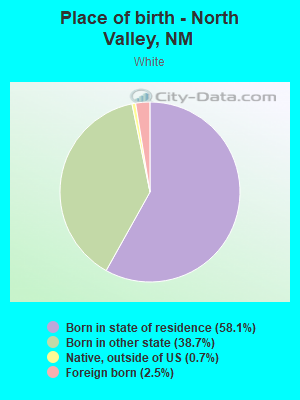
Place of birth - Born in state of residence (%) - White
Place of birth - Born in state of residence (%) - Black or African American
Place of birth - Born in state of residence (%) - Asian
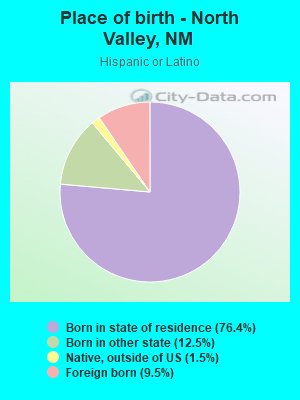
Place of birth - Born in state of residence (%) - Hispanic or Latino
Place of birth - Born in state of residence (%) - American Indian and Alaska Native
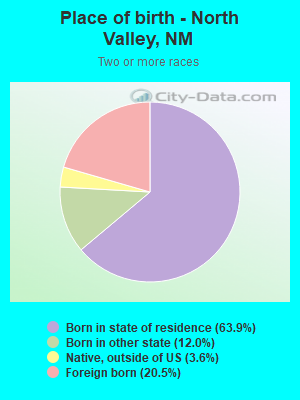
Place of birth - Born in state of residence (%) - Multirace
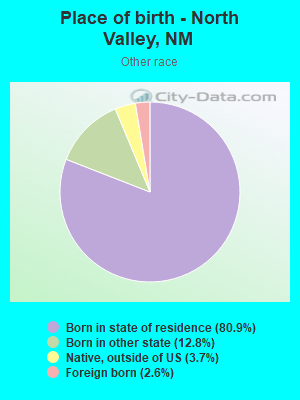
Place of birth - Born in state of residence (%) - Other Race
Place of birth - Born in other state (%)
Place of birth - Born in other state (%) - White
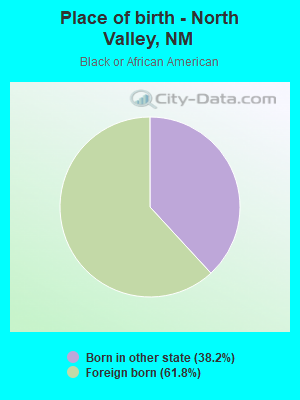
Place of birth - Born in other state (%) - Black or African American
Place of birth - Born in other state (%) - Asian
Place of birth - Born in other state (%) - Hispanic or Latino
Place of birth - Born in other state (%) - American Indian and Alaska Native
Place of birth - Born in other state (%) - Multirace
Place of birth - Born in other state (%) - Other Race
Place of birth - Native, outside of US (%)
Place of birth - Native, outside of US (%) - White
Place of birth - Native, outside of US (%) - Black or African American
Place of birth - Native, outside of US (%) - Asian
Place of birth - Native, outside of US (%) - Hispanic or Latino
Place of birth - Native, outside of US (%) - American Indian and Alaska Native
Place of birth - Native, outside of US (%) - Multirace
Place of birth - Native, outside of US (%) - Other Race
Place of birth - Foreign born (%)
Place of birth - Foreign born (%) - White
Place of birth - Foreign born (%) - Black or African American
Place of birth - Foreign born (%) - Asian
Place of birth - Foreign born (%) - Hispanic or Latino
Place of birth - Foreign born (%) - American Indian and Alaska Native
Place of birth - Foreign born (%) - Multirace
Place of birth - Foreign born (%) - Other Race
Residents speaking English at home (%)
Residents speaking English at home - Born in the United States (%)
Residents speaking English at home - Native, born elsewhere (%)
Residents speaking English at home - Foreign born (%)
Residents speaking Spanish at home (%)
Residents speaking Spanish at home - Born in the United States (%)
Residents speaking Spanish at home - Native, born elsewhere (%)
Residents speaking Spanish at home - Foreign born (%)
Residents speaking other language at home (%)
Residents speaking other language at home - Born in the United States (%)
Residents speaking other language at home - Native, born elsewhere (%)
Residents speaking other language at home - Foreign born (%)
Marital status - Never married (%)
Marital status - Now married (%)
Marital status - Separated (%)
Marital status - Widowed (%)
Marital status - Divorced (%)
Ancestries Reported - Arab (%)
Ancestries Reported - Czech (%)
Ancestries Reported - Danish (%)
Ancestries Reported - Dutch (%)
Ancestries Reported - English (%)
Ancestries Reported - French (%)
Ancestries Reported - French Canadian (%)
Ancestries Reported - German (%)
Ancestries Reported - Greek (%)
Ancestries Reported - Hungarian (%)
Ancestries Reported - Irish (%)
Ancestries Reported - Italian (%)
Ancestries Reported - Lithuanian (%)
Ancestries Reported - Norwegian (%)
Ancestries Reported - Polish (%)
Ancestries Reported - Portuguese (%)
Ancestries Reported - Russian (%)
Ancestries Reported - Scotch-Irish (%)
Ancestries Reported - Scottish (%)
Ancestries Reported - Slovak (%)
Ancestries Reported - Subsaharan African (%)
Ancestries Reported - Swedish (%)
Ancestries Reported - Swiss (%)
Ancestries Reported - Ukrainian (%)
Ancestries Reported - United States (%)
Ancestries Reported - Welsh (%)
Ancestries Reported - West Indian (%)
Ancestries Reported - Other (%)
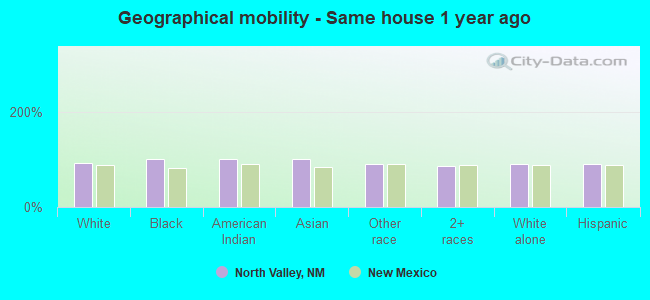
Geographical mobility - Same house 1 year ago (%)
Geographical mobility - Same house 1 year ago (%) - White
Geographical mobility - Same house 1 year ago (%) - Black or African American
Geographical mobility - Same house 1 year ago (%) - Asian
Geographical mobility - Same house 1 year ago (%) - Hispanic or Latino
Geographical mobility - Same house 1 year ago (%) - American Indian and Alaska Native
Geographical mobility - Same house 1 year ago (%) - Multirace
Geographical mobility - Same house 1 year ago (%) - Other Race
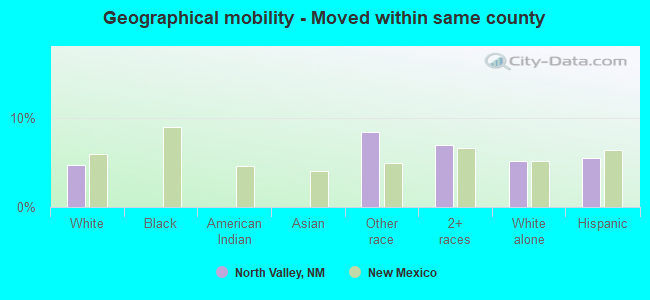
Geographical mobility - Moved within same county (%)
Geographical mobility - Moved within same county (%) - White
Geographical mobility - Moved within same county (%) - Black or African American
Geographical mobility - Moved within same county (%) - Asian
Geographical mobility - Moved within same county (%) - Hispanic or Latino
Geographical mobility - Moved within same county (%) - American Indian and Alaska Native
Geographical mobility - Moved within same county (%) - Multirace
Geographical mobility - Moved within same county (%) - Other Race
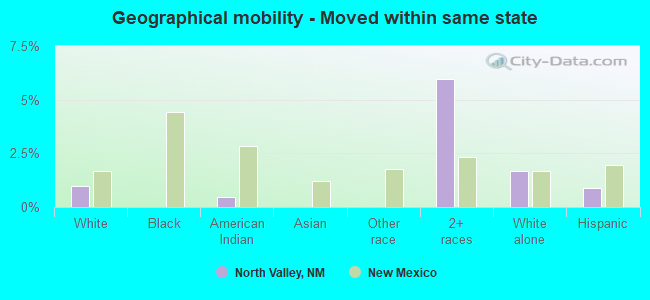
Geographical mobility - Moved from different county within same state (%)
Geographical mobility - Moved from different county within same state (%) - White
Geographical mobility - Moved from different county within same state (%) - Black or African American
Geographical mobility - Moved from different county within same state (%) - Asian
Geographical mobility - Moved from different county within same state (%) - Hispanic or Latino
Geographical mobility - Moved from different county within same state (%) - American Indian and Alaska Native
Geographical mobility - Moved from different county within same state (%) - Multirace
Geographical mobility - Moved from different county within same state (%) - Other Race
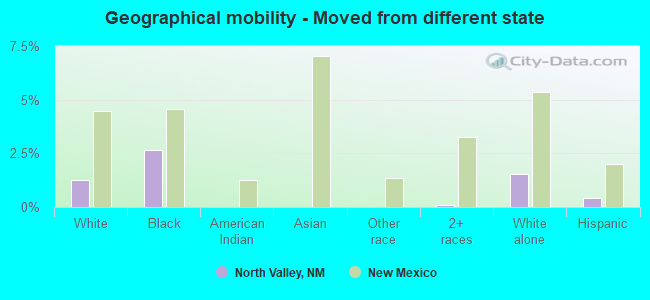
Geographical mobility - Moved from different state (%)
Geographical mobility - Moved from different state (%) - White
Geographical mobility - Moved from different state (%) - Black or African American
Geographical mobility - Moved from different state (%) - Asian
Geographical mobility - Moved from different state (%) - Hispanic or Latino
Geographical mobility - Moved from different state (%) - American Indian and Alaska Native
Geographical mobility - Moved from different state (%) - Multirace
Geographical mobility - Moved from different state (%) - Other Race
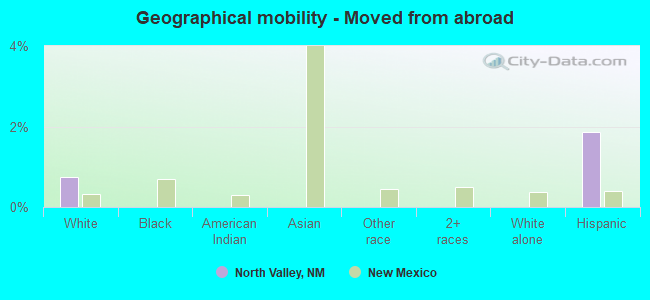
Geographical mobility - Moved from abroad (%)
Geographical mobility - Moved from abroad (%) - White
Geographical mobility - Moved from abroad (%) - Black or African American
Geographical mobility - Moved from abroad (%) - Asian
Geographical mobility - Moved from abroad (%) - Hispanic or Latino
Geographical mobility - Moved from abroad (%) - American Indian and Alaska Native
Geographical mobility - Moved from abroad (%) - Multirace
Geographical mobility - Moved from abroad (%) - Other Race
Place of birth for the foreign-born population - Ireland (%)
Place of birth for the foreign-born population - Denmark (%)
Place of birth for the foreign-born population - Norway (%)
Place of birth for the foreign-born population - Sweden (%)
Place of birth for the foreign-born population - United Kingdom (%)
Place of birth for the foreign-born population - England (%)
Place of birth for the foreign-born population - Scotland (%)
Place of birth for the foreign-born population - Other Northern Europe (%)
Place of birth for the foreign-born population - Austria (%)
Place of birth for the foreign-born population - Belgium (%)
Place of birth for the foreign-born population - France (%)
Place of birth for the foreign-born population - Germany (%)
Place of birth for the foreign-born population - Netherlands (%)
Place of birth for the foreign-born population - Switzerland (%)
Place of birth for the foreign-born population - Other Western Europe (%)
Place of birth for the foreign-born population - Greece (%)
Place of birth for the foreign-born population - Italy (%)
Place of birth for the foreign-born population - Portugal (%)
Place of birth for the foreign-born population - Spain (%)
Place of birth for the foreign-born population - Other Southern Europe (%)
Place of birth for the foreign-born population - Albania (%)
Place of birth for the foreign-born population - Belarus (%)
Place of birth for the foreign-born population - Bosnia and Herzegovina (%)
Place of birth for the foreign-born population - Bulgaria (%)
Place of birth for the foreign-born population - Croatia (%)
Place of birth for the foreign-born population - Czechoslovakia (%)
Place of birth for the foreign-born population - Hungary (%)
Place of birth for the foreign-born population - Latvia (%)
Place of birth for the foreign-born population - Lithuania (%)
Place of birth for the foreign-born population - North Macedonia (Macedonia) (%)
Place of birth for the foreign-born population - Moldova (%)
Place of birth for the foreign-born population - Poland (%)
Place of birth for the foreign-born population - Romania (%)
Place of birth for the foreign-born population - Russia (%)
Place of birth for the foreign-born population - Serbia (%)
Place of birth for the foreign-born population - Ukraine (%)
Place of birth for the foreign-born population - Other Eastern Europe (%)
Place of birth for the foreign-born population - China (%)
Place of birth for the foreign-born population - Hong Kong (%)
Place of birth for the foreign-born population - Taiwan (%)
Place of birth for the foreign-born population - Japan (%)
Place of birth for the foreign-born population - Korea (%)
Place of birth for the foreign-born population - Other Eastern Asia (%)
Place of birth for the foreign-born population - Afghanistan (%)
Place of birth for the foreign-born population - Bangladesh (%)
Place of birth for the foreign-born population - India (%)
Place of birth for the foreign-born population - Iran (%)
Place of birth for the foreign-born population - Kazakhstan (%)
Place of birth for the foreign-born population - Nepal (%)
Place of birth for the foreign-born population - Pakistan (%)
Place of birth for the foreign-born population - Sri Lanka (%)
Place of birth for the foreign-born population - Uzbekistan (%)
Place of birth for the foreign-born population - Other South Central Asia (%)
Place of birth for the foreign-born population - Burma (%)
Place of birth for the foreign-born population - Cambodia (%)
Place of birth for the foreign-born population - Indonesia (%)
Place of birth for the foreign-born population - Laos (%)
Place of birth for the foreign-born population - Malaysia (%)
Place of birth for the foreign-born population - Philippines (%)
Place of birth for the foreign-born population - Singapore (%)
Place of birth for the foreign-born population - Thailand (%)
Place of birth for the foreign-born population - Vietnam (%)
Place of birth for the foreign-born population - Other South Eastern Asia (%)
Place of birth for the foreign-born population - Armenia (%)
Place of birth for the foreign-born population - Iraq (%)
Place of birth for the foreign-born population - Israel (%)
Place of birth for the foreign-born population - Jordan (%)
Place of birth for the foreign-born population - Kuwait (%)
Place of birth for the foreign-born population - Lebanon (%)
Place of birth for the foreign-born population - Saudi Arabia (%)
Place of birth for the foreign-born population - Syria (%)
Place of birth for the foreign-born population - Turkey (%)
Place of birth for the foreign-born population - Yemen (%)
Place of birth for the foreign-born population - Other Western Asia (%)
Place of birth for the foreign-born population - Eritrea (%)
Place of birth for the foreign-born population - Ethiopia (%)
Place of birth for the foreign-born population - Kenya (%)
Place of birth for the foreign-born population - Somalia (%)
Place of birth for the foreign-born population - Uganda (%)
Place of birth for the foreign-born population - Zimbabwe (%)
Place of birth for the foreign-born population - Other Eastern Africa (%)
Place of birth for the foreign-born population - Cameroon (%)
Place of birth for the foreign-born population - Congo (%)
Place of birth for the foreign-born population - Democratic Republic of Congo (Zaire) (%)
Place of birth for the foreign-born population - Other Middle Africa (%)
Place of birth for the foreign-born population - Egypt (%)
Place of birth for the foreign-born population - Morocco (%)
Place of birth for the foreign-born population - Sudan (%)
Place of birth for the foreign-born population - Other Northern Africa (%)
Place of birth for the foreign-born population - South Africa (%)
Place of birth for the foreign-born population - Other Southern Africa (%)
Place of birth for the foreign-born population - Cabo Verde (%)
Place of birth for the foreign-born population - Ghana (%)
Place of birth for the foreign-born population - Liberia (%)
Place of birth for the foreign-born population - Nigeria (%)
Place of birth for the foreign-born population - Senegal (%)
Place of birth for the foreign-born population - Sierra Leone (%)
Place of birth for the foreign-born population - Other Western Africa (%)
Place of birth for the foreign-born population - Australia (%)
Place of birth for the foreign-born population - New Zealand (%)
Place of birth for the foreign-born population - Fiji (%)
Place of birth for the foreign-born population - Micronesia (%)
Place of birth for the foreign-born population - Bahamas (%)
Place of birth for the foreign-born population - Barbados (%)
Place of birth for the foreign-born population - Cuba (%)
Place of birth for the foreign-born population - Dominica (%)
Place of birth for the foreign-born population - Dominican Republic (%)
Place of birth for the foreign-born population - Grenada (%)
Place of birth for the foreign-born population - Haiti (%)
Place of birth for the foreign-born population - Jamaica (%)
Place of birth for the foreign-born population - St. Vincent and the Grenadines (%)
Place of birth for the foreign-born population - Trinidad and Tobago (%)
Place of birth for the foreign-born population - West Indies (%)
Place of birth for the foreign-born population - Other Caribbean (%)
Place of birth for the foreign-born population - Belize (%)
Place of birth for the foreign-born population - Costa Rica (%)
Place of birth for the foreign-born population - El Salvador (%)
Place of birth for the foreign-born population - Guatemala (%)
Place of birth for the foreign-born population - Honduras (%)
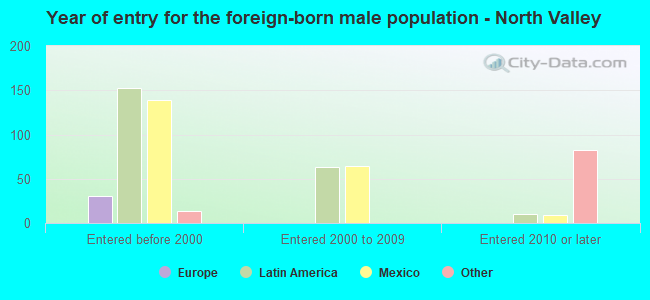
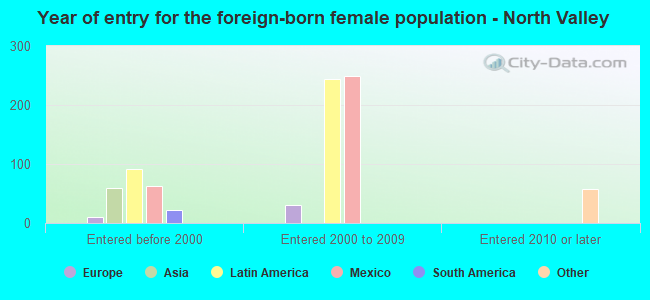
Place of birth for the foreign-born population - Mexico (%)
Place of birth for the foreign-born population - Nicaragua (%)
Place of birth for the foreign-born population - Panama (%)
Place of birth for the foreign-born population - Other Central America (%)
Place of birth for the foreign-born population - Argentina (%)
Place of birth for the foreign-born population - Bolivia (%)
Place of birth for the foreign-born population - Brazil (%)
Place of birth for the foreign-born population - Chile (%)
Place of birth for the foreign-born population - Colombia (%)
Place of birth for the foreign-born population - Ecuador (%)
Place of birth for the foreign-born population - Guyana (%)
Place of birth for the foreign-born population - Peru (%)
Place of birth for the foreign-born population - Uruguay (%)
Place of birth for the foreign-born population - Venezuela (%)
Place of birth for the foreign-born population - Other South America (%)
Place of birth for the foreign-born population - Canada (%)
Place of birth for the foreign-born population - Other Northern America (%)
Place of birth for the foreign-born population - Other (%)
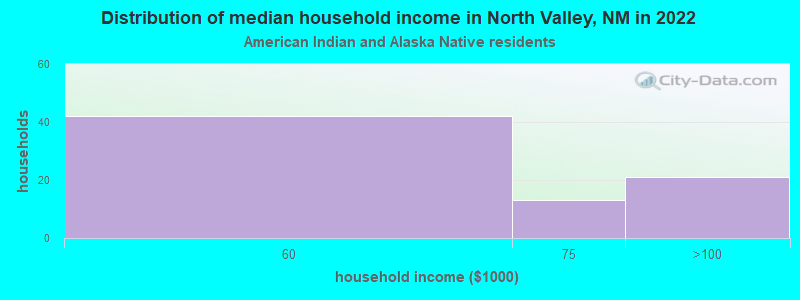
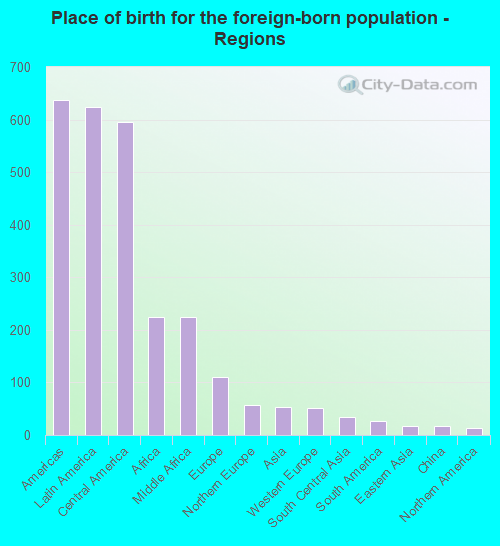
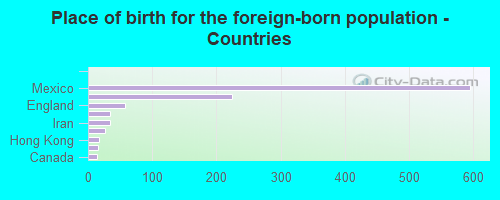
According to 2022 data, the most numerous races in North Valley, NM are Hispanic (6,403 residents), White alone (3,945 residents), and American Indian alone (337 residents). 72.6% of North Valley residents speak English at home. 9.1% of North Valley, NM residents are foreign-born (5.4% born in Latin America, 2.0% born in Africa, 1.0% born in Europe), which is about the same as the foreign-born rate of 9.0% across the entire state of New Mexico.
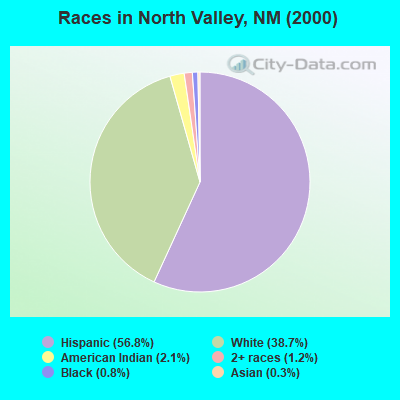
Race distribution in North Valley
2000 2022
813,495 44.7% White alone 765,386 42.1% Hispanic 161,460 8.9% American Indian alone 30,654 1.7% Black alone 25,793 1.4% Two or more races 18,257 1.0% Asian alone 3,009 0.2% Other race alone 992 0.05% Native Hawaiian and Other
1,059,867 50.2% Hispanic 735,478 34.8% White alone 171,808 8.1% American Indian alone 65,084 3.1% Two or more races 36,870 1.7% Black alone 35,870 1.7% Asian alone 7,582 0.4% Other race alone 785 0.04% Native Hawaiian and Other
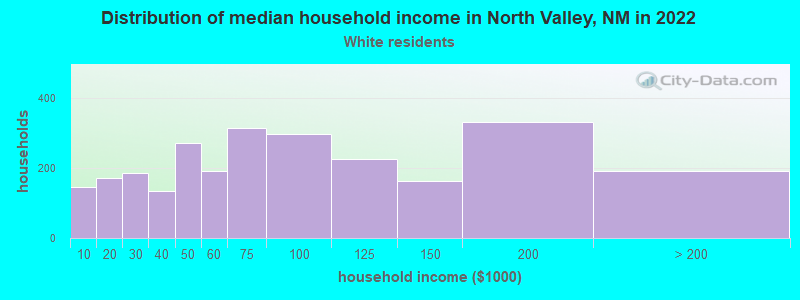
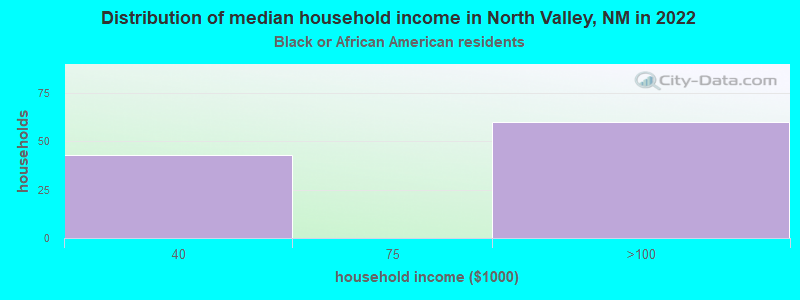
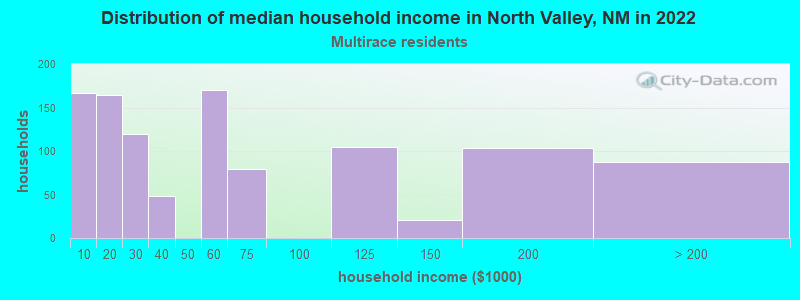
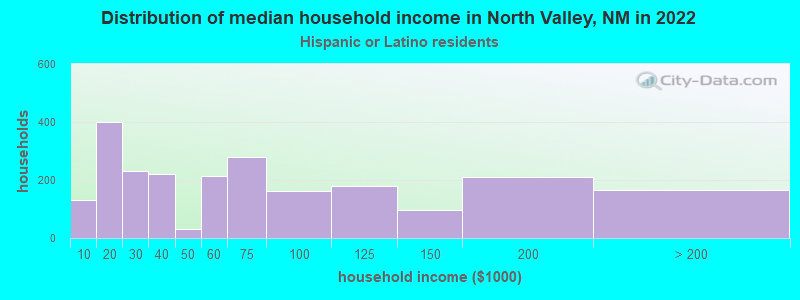
Income and house value in North Valley Median household income in 2022 $76,741 White non-Hispanic householders$61,607 American Indian and Alaska Native householders$52,578 Two or more races householders$57,399 Hispanic or Latino race householdersMedian 2022 house value $499,487 White Non-Hispanic householders$239,524 American Indian or Alaska Native householders $359,286 Asian householders$383,558 Some other race householders$395,374 Two or more races householders$372,699 Hispanic or Latino householders
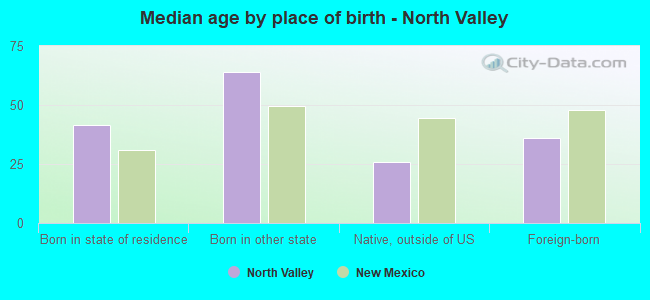
Median age by race in North Valley
52.6 Median age for White residents51.4 54.0 25.6 Median age for Black or African American residents18.3 -580,580,580.0 32.5 Median age for American Indian / Alaska Native residents35.4 32.2 -677,110,530.2 Median age for Asian residents-675,749,318.1 -684,954,280.3 -773,737,373.0 Median age for Native Hawaiian / Pacific Islander residents-388,464,800.3 -785,276,072.8 44.5 Median age for Other race residents48.7 42.3 36.8 Median age for Two or more races residents45.9 32.3 60.7 Median age for White alone residents54.4 60.6 42.3 Median age for Hispanic or Latino residents47.6 35.2
Owner/renter occupied households by race in North Valley
House owners and renters - White residents 2,232 83.3% Owner occupied448 16.7% Renter occupiedHouse owners and renters - Black or African American residents 61 100.0% Renter occupiedHouse owners and renters - American Indian / Alaska Native residents 37 52.3% Owner occupied34 47.7% Renter occupiedHouse owners and renters - Other race residents 364 68.6% Owner occupied167 31.4% Renter occupiedHouse owners and renters - Two or more races residents 849 80.9% Owner occupied200 19.1% Renter occupiedHouse owners and renters - White alone residents 1,568 81.6% Owner occupied354 18.4% Renter occupiedHouse owners and renters - Hispanic or Latino residents 1,924 81.0% Owner occupied452 19.0% Renter occupied
Language usage in North Valley
English speakers - Total 72.6% of residents of North Valley speak English at home.
22.6% of residents speak Spanish at home 2,048 83.9% Speak English very well393 16.1% Speak English less than very well4.7% of residents speak other language at home 499 97.5% Speak English very well13 2.5% Speak English less than very well
English speakers - Born in the United States 86.3% of residents of North Valley speak English at home.
9.9% of residents speak Spanish at home 263 89.8% Speak English very well30 10.2% Speak English less than very well3.6% of residents speak other language at home 107 100.0% Speak English very well
All residents speak only English at home
English speakers - Foreign-born 10.3% of residents of North Valley speak English at home.
55.8% of residents speak Spanish at home 325 59.5% Speak English very well221 40.5% Speak English less than very well32.3% of residents speak other language at home 316 100.0% Speak English very well
White (Caucasian) - Speak only English Native:
84.3% (4,834)Foreign-born:
43.5% (66)
White (Caucasian) - Speak another language Native:
12.6% (724)Foreign-born:
100.0% (152)
Black or African American - Speak another language Native:
59.0% (69)Foreign-born:
62.3% (102)
Other race - Speak another language Native:
14.0% (197)Foreign-born:
95.5% (38)
Two or more races - Speak another language Native:
30.3% (555)Foreign-born:
100.0% (513)
White alone - Speak only English Native:
94.0% (3,532)Foreign-born:
59.9% (76)
White alone - Speak another language Native:
5.5% (205)Foreign-born:
41.7% (53)
Hispanic or Latino - Speak another language Native:
31.5% (1,718)Foreign-born:
95.6% (579)
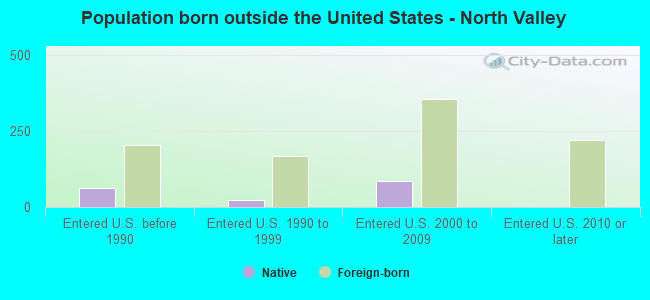
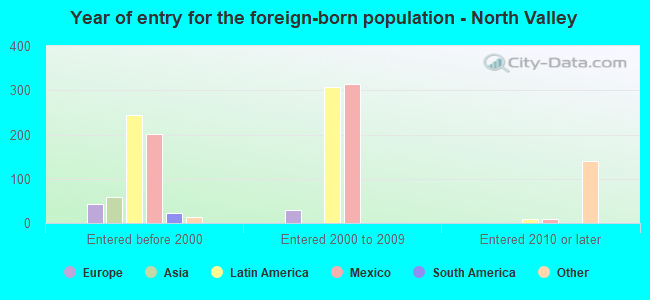
Foreign-born residents in North Valley 1,026 residents are foreign born (5.4% Latin America , 2.0% Africa , 1.0% Europe ).
This city:
9.1%New Mexico:
9.2%
Marital status for residents in North Valley Marital status - White (Caucasian) population 15 years and over
Males 32.0% Never married53.7% Now married0.0% Separated4.8% Widowed9.5% DivorcedFemales 27.3% Never married44.1% Now married1.5% Separated10.4% Widowed16.8% DivorcedWomen who gave birth in the past 12 months Now married:
100.0% (13)Unmarried:
0.0% (0)
Women who did not give birth in the past 12 months Now married:
36.4% (458)Unmarried:
63.6% (799)
Marital status - Black or African American population 15 years and over
Males 66.3% Never married29.4% Now married0.0% Separated0.0% Widowed4.4% DivorcedFemales 0.0% Never married100.0% Now married0.0% Separated0.0% Widowed0.0% DivorcedWomen who did not give birth in the past 12 months Now married:
100.0% (73)Unmarried:
0.0% (0)
Marital status - American Indian / Alaska Native population 15 years and over
Males 18.7% Never married39.6% Now married27.6% Separated14.2% Widowed0.0% DivorcedFemales 100.0% Never married0.0% Now married0.0% Separated0.0% Widowed0.0% DivorcedWomen who did not give birth in the past 12 months Now married:
0.0% (0)Unmarried:
100.0% (80)
Marital status - Other race population 15 years and over
Males 45.8% Never married22.3% Now married27.6% Separated4.3% Widowed0.0% DivorcedFemales 44.4% Never married50.8% Now married0.0% Separated0.0% Widowed4.8% DivorcedWomen who did not give birth in the past 12 months Now married:
50.2% (250)Unmarried:
49.8% (248)
Marital status - Two or more races population 15 years and over
Males 32.0% Never married60.5% Now married0.0% Separated1.6% Widowed5.9% DivorcedFemales 31.9% Never married44.1% Now married0.0% Separated1.0% Widowed23.0% DivorcedWomen who did not give birth in the past 12 months Now married:
33.8% (249)Unmarried:
66.2% (487)
Marital status - White alone, not Hispanic / Latino population 15 years and over
Males 26.1% Never married55.9% Now married0.0% Separated3.7% Widowed14.2% DivorcedFemales 19.9% Never married45.0% Now married2.5% Separated11.6% Widowed21.0% DivorcedWomen who did not give birth in the past 12 months Now married:
34.6% (224)Unmarried:
65.4% (423)
Marital status - Hispanic or Latino population 15 years and over
Males 38.8% Never married46.8% Now married5.2% Separated5.3% Widowed3.9% DivorcedFemales 37.7% Never married44.2% Now married0.0% Separated5.3% Widowed12.8% DivorcedWomen who gave birth in the past 12 months Now married:
100.0% (17)Unmarried:
0.0% (0)
Women who did not give birth in the past 12 months Now married:
39.3% (706)Unmarried:
60.7% (1,090)
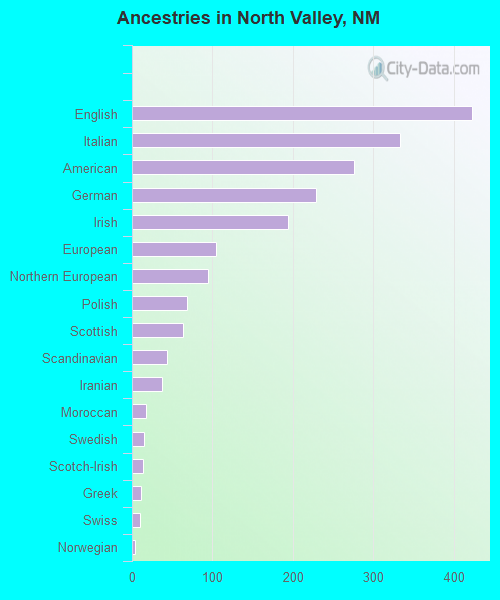
Ancestries in North Valley
423 5.8% English333 4.5% Italian276 3.8% American229 3.1% German194 2.6% Irish105 1.4% European94 1.3% Northern European68 0.9% Polish64 0.9% Scottish44 0.6% Scandinavian37 0.5% Iranian17 0.2% Moroccan15 0.2% Swedish14 0.2% Scotch-Irish11 0.2% Greek10 0.1% Swiss4 0.05% Norwegian
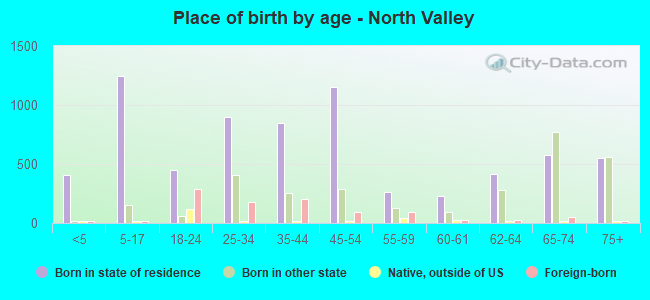
Children Nativity (place of birth) in North Valley
Children under 6 years - Living with two parents Both parents native 401 100.0% NativeOne native, one foreign-born parent 31 100.0% NativeChildren under 6 years - Living with one parent Native parent 101 100.0% NativeChildren 6 to 17 years - Living with two parents Both parents native 390 99.6% Native2 0.4% Foreign-bornBoth parents foreign-born 38 85.2% Native7 14.8% Foreign-bornOne native, one foreign-born parent 85 100.0% NativeChildren 6 to 17 years - Living with one parent Native parent 546 100.0% NativeForeign-born parent 119 48.5% Native127 51.5% Foreign-born
Grandparents responsible for own grandchildren in North Valley
Grandparents (30 to 59 years) White / Caucasian 35 100.0% Not responsible for grandchildrenOther race 199 100.0% Not responsible for grandchildrenWhite alone, not Hispanic / Latino 38 100.0% Not responsible for grandchildrenHispanic or Latino 117 100.0% Not responsible for grandchildrenGrandparents (60 years and over) White / Caucasian 41 19.9% Responsible for grandchildren165 80.1% Not responsible for grandchildrenWhite alone, not Hispanic / Latino 40 14.3% Responsible for grandchildren237 85.7% Not responsible for grandchildrenHispanic or Latino 9 34.9% Responsible for grandchildren16 65.1% Not responsible for grandchildren