Races in North Valleys, Nevada (NV) Detailed Stats
Ancestries, Foreign-born residents, place of birth
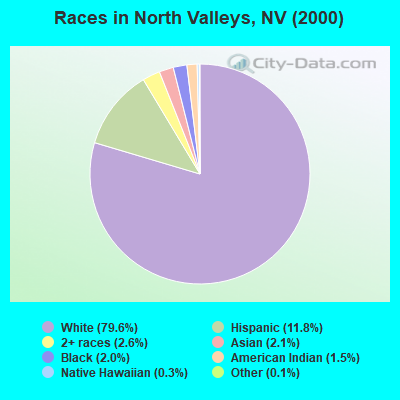
Race distribution in North Valleys

- 27,07479.6%White alone
- 4,00011.8%Hispanic
- 8742.6%Two or more races
- 7252.1%Asian alone
- 6652.0%Black alone
- 5251.5%American Indian alone
- 960.3%Native Hawaiian and Other
Pacific Islander alone - 430.1%Other race alone
2000
2022
-
- 1,303,00165.2%White alone
- 393,97019.7%Hispanic
- 131,5096.6%Black alone
- 88,5934.4%Asian alone
- 49,2312.5%Two or more races
- 21,3971.1%American Indian alone
- 7,7690.4%Native Hawaiian and Other
Pacific Islander alone - 2,7870.1%Other race alone

-
- 1,410,14544.4%White alone
- 961,35730.3%Hispanic
- 286,4719.0%Black alone
- 281,1498.8%Asian alone
- 182,1515.7%Two or more races
- 20,1020.6%Native Hawaiian and Other
Pacific Islander alone - 18,7810.6%Other race alone
- 17,6160.6%American Indian alone

Income and house value in North Valleys
- Median household income in 2022
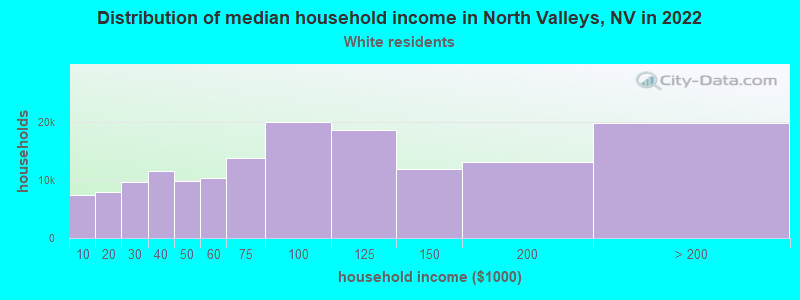
- $86,542White non-Hispanic householders
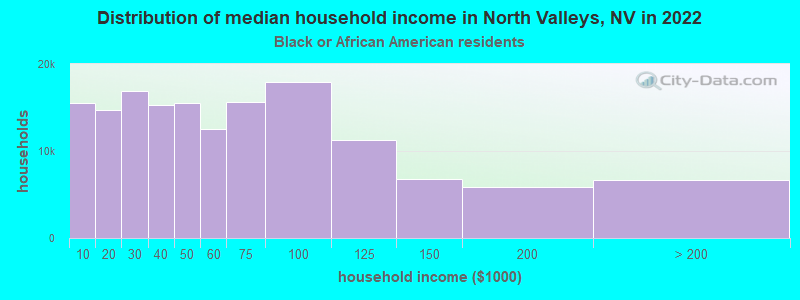
- $80,115Black householders
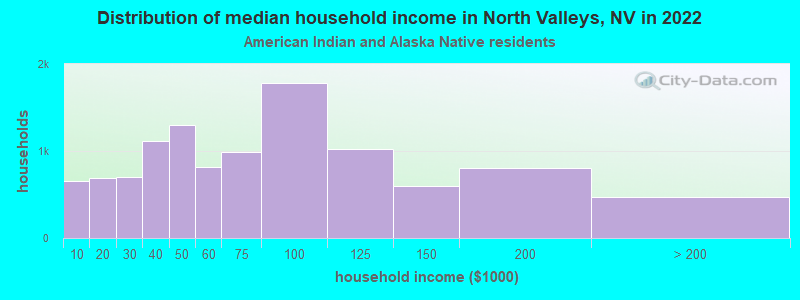
- $118,498American Indian and Alaska Native householders
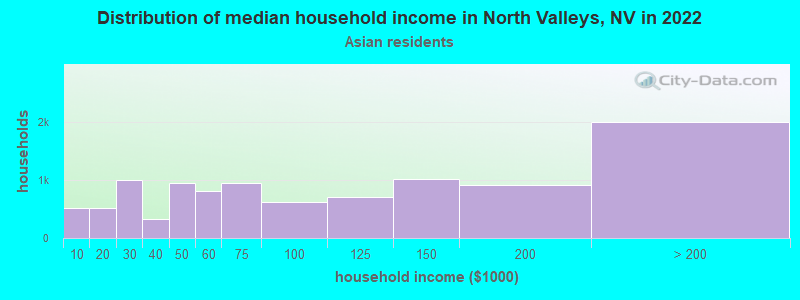
- $88,428Asian householders
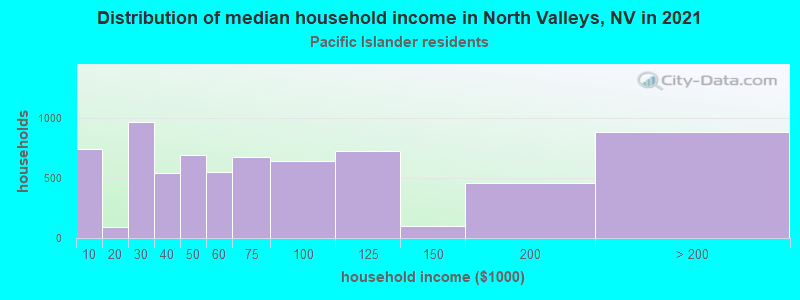
- $99,147Native Hawaiian and other Pacific Islander householders
- $98,486Some other race householders
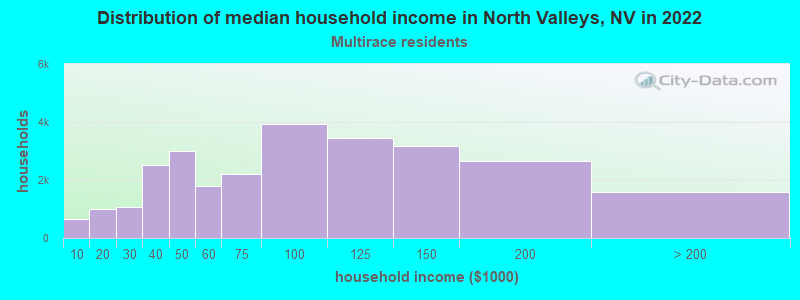
- $101,259Two or more races householders
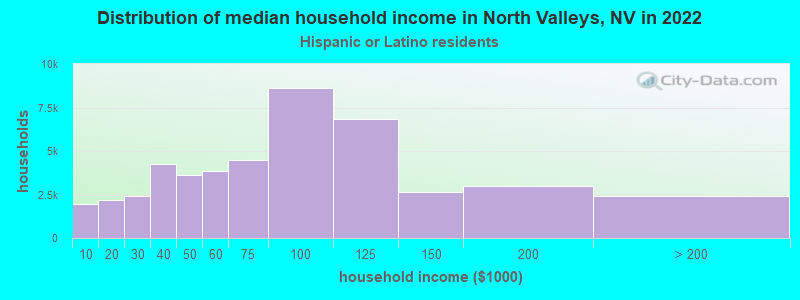
- $97,668Hispanic or Latino race householders
- Median 2022 house value
- $485,697White Non-Hispanic householders
- $499,888Black or African American householders
- $563,749American Indian or Alaska Native householders
- $547,074Asian householders
- $886,956Native Hawaiian and other Pacific Islander householders
- $392,389Some other race householders
- $535,366Two or more races householders
- $412,612Hispanic or Latino householders
Household income for White non-Hispanic householders
Household income for Black householders
Household income for American Indian and Alaska Native householders
Household income for Asian householders
Household income for Native Hawaiian and other Pacific Islander householders
Household income for Two or more races householders
Household income for Hispanic or Latino race householders
Zip code: 89506