Races in Norwalk, Connecticut (CT) Detailed Stats
Data:
Races - White alone (%)
Races - White alone (% change since 2000)
Races - Black alone (%)
Races - Black alone (% change since 2000)
Races - American Indian alone (%)
Races - American Indian alone (% change since 2000)
Races - Asian alone (%)
Races - Asian alone (% change since 2000)
Races - Hispanic (%)
Races - Hispanic (% change since 2000)
Races - Native Hawaiian and Other Pacific Islander alone (%)
Races - Native Hawaiian and Other Pacific Islander alone (% change since 2000)
Races - Two or more races(%)
Races - Two or more races(% change since 2000)
Races - Other race alone (%)
Races - Other race alone (% change since 2000)
Racial diversity
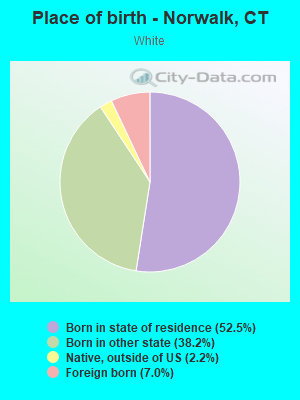
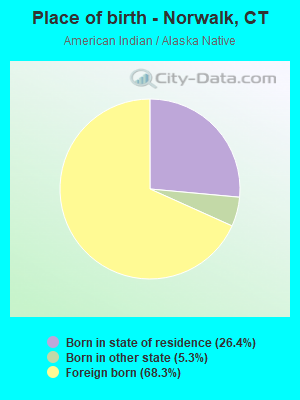
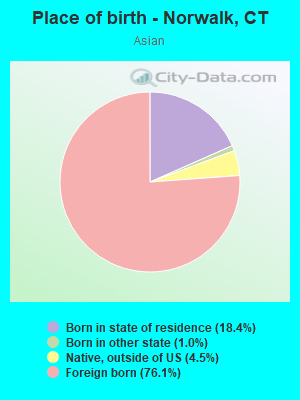
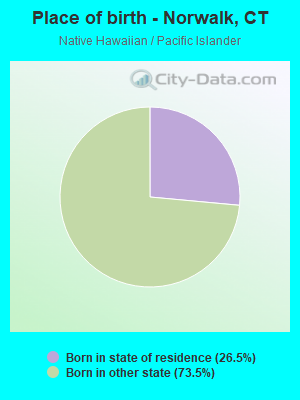
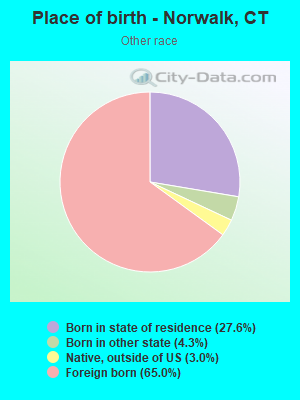
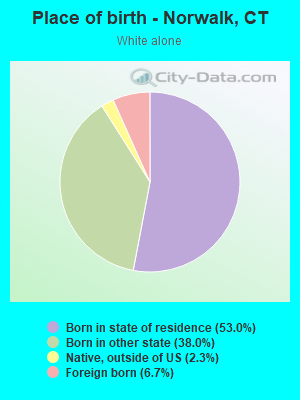
Place of birth - Born in state of residence (%)
Place of birth - Born in state of residence (%) - White
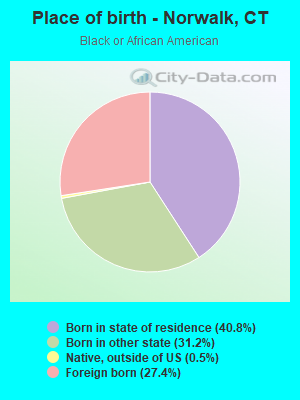
Place of birth - Born in state of residence (%) - Black or African American
Place of birth - Born in state of residence (%) - Asian
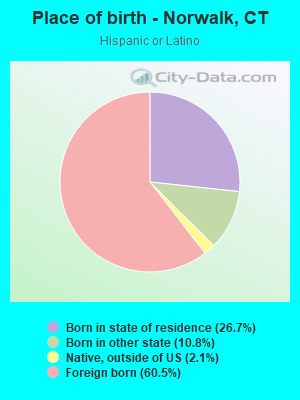
Place of birth - Born in state of residence (%) - Hispanic or Latino
Place of birth - Born in state of residence (%) - American Indian and Alaska Native
Place of birth - Born in state of residence (%) - Multirace
Place of birth - Born in state of residence (%) - Other Race
Place of birth - Born in other state (%)
Place of birth - Born in other state (%) - White
Place of birth - Born in other state (%) - Black or African American
Place of birth - Born in other state (%) - Asian
Place of birth - Born in other state (%) - Hispanic or Latino
Place of birth - Born in other state (%) - American Indian and Alaska Native
Place of birth - Born in other state (%) - Multirace
Place of birth - Born in other state (%) - Other Race
Place of birth - Native, outside of US (%)
Place of birth - Native, outside of US (%) - White
Place of birth - Native, outside of US (%) - Black or African American
Place of birth - Native, outside of US (%) - Asian
Place of birth - Native, outside of US (%) - Hispanic or Latino
Place of birth - Native, outside of US (%) - American Indian and Alaska Native
Place of birth - Native, outside of US (%) - Multirace
Place of birth - Native, outside of US (%) - Other Race
Place of birth - Foreign born (%)
Place of birth - Foreign born (%) - White
Place of birth - Foreign born (%) - Black or African American
Place of birth - Foreign born (%) - Asian
Place of birth - Foreign born (%) - Hispanic or Latino
Place of birth - Foreign born (%) - American Indian and Alaska Native
Place of birth - Foreign born (%) - Multirace
Place of birth - Foreign born (%) - Other Race
Residents speaking English at home (%)
Residents speaking English at home - Born in the United States (%)
Residents speaking English at home - Native, born elsewhere (%)
Residents speaking English at home - Foreign born (%)
Residents speaking Spanish at home (%)
Residents speaking Spanish at home - Born in the United States (%)
Residents speaking Spanish at home - Native, born elsewhere (%)
Residents speaking Spanish at home - Foreign born (%)
Residents speaking other language at home (%)
Residents speaking other language at home - Born in the United States (%)
Residents speaking other language at home - Native, born elsewhere (%)
Residents speaking other language at home - Foreign born (%)
Marital status - Never married (%)
Marital status - Now married (%)
Marital status - Separated (%)
Marital status - Widowed (%)
Marital status - Divorced (%)
Ancestries Reported - Arab (%)
Ancestries Reported - Czech (%)
Ancestries Reported - Danish (%)
Ancestries Reported - Dutch (%)
Ancestries Reported - English (%)
Ancestries Reported - French (%)
Ancestries Reported - French Canadian (%)
Ancestries Reported - German (%)
Ancestries Reported - Greek (%)
Ancestries Reported - Hungarian (%)
Ancestries Reported - Irish (%)
Ancestries Reported - Italian (%)
Ancestries Reported - Lithuanian (%)
Ancestries Reported - Norwegian (%)
Ancestries Reported - Polish (%)
Ancestries Reported - Portuguese (%)
Ancestries Reported - Russian (%)
Ancestries Reported - Scotch-Irish (%)
Ancestries Reported - Scottish (%)
Ancestries Reported - Slovak (%)
Ancestries Reported - Subsaharan African (%)
Ancestries Reported - Swedish (%)
Ancestries Reported - Swiss (%)
Ancestries Reported - Ukrainian (%)
Ancestries Reported - United States (%)
Ancestries Reported - Welsh (%)
Ancestries Reported - West Indian (%)
Ancestries Reported - Other (%)
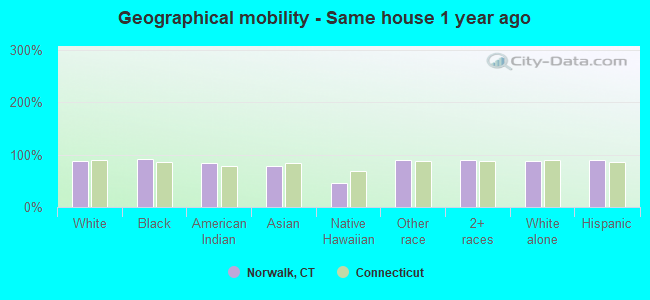
Geographical mobility - Same house 1 year ago (%)
Geographical mobility - Same house 1 year ago (%) - White
Geographical mobility - Same house 1 year ago (%) - Black or African American
Geographical mobility - Same house 1 year ago (%) - Asian
Geographical mobility - Same house 1 year ago (%) - Hispanic or Latino
Geographical mobility - Same house 1 year ago (%) - American Indian and Alaska Native
Geographical mobility - Same house 1 year ago (%) - Multirace
Geographical mobility - Same house 1 year ago (%) - Other Race
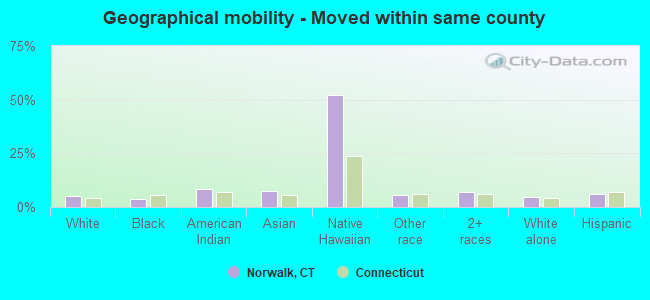
Geographical mobility - Moved within same county (%)
Geographical mobility - Moved within same county (%) - White
Geographical mobility - Moved within same county (%) - Black or African American
Geographical mobility - Moved within same county (%) - Asian
Geographical mobility - Moved within same county (%) - Hispanic or Latino
Geographical mobility - Moved within same county (%) - American Indian and Alaska Native
Geographical mobility - Moved within same county (%) - Multirace
Geographical mobility - Moved within same county (%) - Other Race
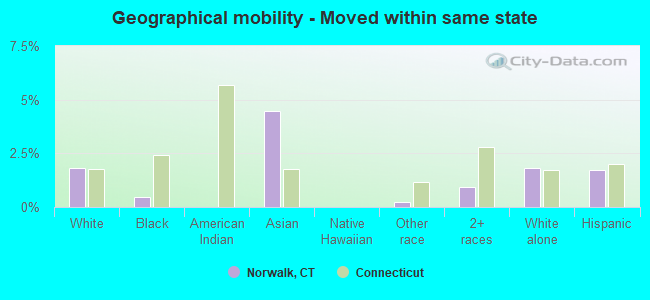
Geographical mobility - Moved from different county within same state (%)
Geographical mobility - Moved from different county within same state (%) - White
Geographical mobility - Moved from different county within same state (%) - Black or African American
Geographical mobility - Moved from different county within same state (%) - Asian
Geographical mobility - Moved from different county within same state (%) - Hispanic or Latino
Geographical mobility - Moved from different county within same state (%) - American Indian and Alaska Native
Geographical mobility - Moved from different county within same state (%) - Multirace
Geographical mobility - Moved from different county within same state (%) - Other Race
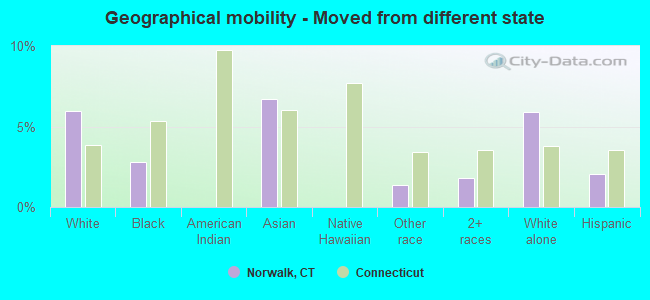
Geographical mobility - Moved from different state (%)
Geographical mobility - Moved from different state (%) - White
Geographical mobility - Moved from different state (%) - Black or African American
Geographical mobility - Moved from different state (%) - Asian
Geographical mobility - Moved from different state (%) - Hispanic or Latino
Geographical mobility - Moved from different state (%) - American Indian and Alaska Native
Geographical mobility - Moved from different state (%) - Multirace
Geographical mobility - Moved from different state (%) - Other Race
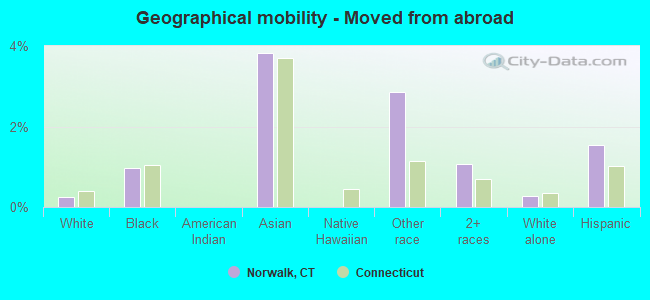
Geographical mobility - Moved from abroad (%)
Geographical mobility - Moved from abroad (%) - White
Geographical mobility - Moved from abroad (%) - Black or African American
Geographical mobility - Moved from abroad (%) - Asian
Geographical mobility - Moved from abroad (%) - Hispanic or Latino
Geographical mobility - Moved from abroad (%) - American Indian and Alaska Native
Geographical mobility - Moved from abroad (%) - Multirace
Geographical mobility - Moved from abroad (%) - Other Race
Place of birth for the foreign-born population - Ireland (%)
Place of birth for the foreign-born population - Denmark (%)
Place of birth for the foreign-born population - Norway (%)
Place of birth for the foreign-born population - Sweden (%)
Place of birth for the foreign-born population - United Kingdom (%)
Place of birth for the foreign-born population - England (%)
Place of birth for the foreign-born population - Scotland (%)
Place of birth for the foreign-born population - Other Northern Europe (%)
Place of birth for the foreign-born population - Austria (%)
Place of birth for the foreign-born population - Belgium (%)
Place of birth for the foreign-born population - France (%)
Place of birth for the foreign-born population - Germany (%)
Place of birth for the foreign-born population - Netherlands (%)
Place of birth for the foreign-born population - Switzerland (%)
Place of birth for the foreign-born population - Other Western Europe (%)
Place of birth for the foreign-born population - Greece (%)
Place of birth for the foreign-born population - Italy (%)
Place of birth for the foreign-born population - Portugal (%)
Place of birth for the foreign-born population - Spain (%)
Place of birth for the foreign-born population - Other Southern Europe (%)
Place of birth for the foreign-born population - Albania (%)
Place of birth for the foreign-born population - Belarus (%)
Place of birth for the foreign-born population - Bosnia and Herzegovina (%)
Place of birth for the foreign-born population - Bulgaria (%)
Place of birth for the foreign-born population - Croatia (%)
Place of birth for the foreign-born population - Czechoslovakia (%)
Place of birth for the foreign-born population - Hungary (%)
Place of birth for the foreign-born population - Latvia (%)
Place of birth for the foreign-born population - Lithuania (%)
Place of birth for the foreign-born population - North Macedonia (Macedonia) (%)
Place of birth for the foreign-born population - Moldova (%)
Place of birth for the foreign-born population - Poland (%)
Place of birth for the foreign-born population - Romania (%)
Place of birth for the foreign-born population - Russia (%)
Place of birth for the foreign-born population - Serbia (%)
Place of birth for the foreign-born population - Ukraine (%)
Place of birth for the foreign-born population - Other Eastern Europe (%)
Place of birth for the foreign-born population - China (%)
Place of birth for the foreign-born population - Hong Kong (%)
Place of birth for the foreign-born population - Taiwan (%)
Place of birth for the foreign-born population - Japan (%)
Place of birth for the foreign-born population - Korea (%)
Place of birth for the foreign-born population - Other Eastern Asia (%)
Place of birth for the foreign-born population - Afghanistan (%)
Place of birth for the foreign-born population - Bangladesh (%)
Place of birth for the foreign-born population - India (%)
Place of birth for the foreign-born population - Iran (%)
Place of birth for the foreign-born population - Kazakhstan (%)
Place of birth for the foreign-born population - Nepal (%)
Place of birth for the foreign-born population - Pakistan (%)
Place of birth for the foreign-born population - Sri Lanka (%)
Place of birth for the foreign-born population - Uzbekistan (%)
Place of birth for the foreign-born population - Other South Central Asia (%)
Place of birth for the foreign-born population - Burma (%)
Place of birth for the foreign-born population - Cambodia (%)
Place of birth for the foreign-born population - Indonesia (%)
Place of birth for the foreign-born population - Laos (%)
Place of birth for the foreign-born population - Malaysia (%)
Place of birth for the foreign-born population - Philippines (%)
Place of birth for the foreign-born population - Singapore (%)
Place of birth for the foreign-born population - Thailand (%)
Place of birth for the foreign-born population - Vietnam (%)
Place of birth for the foreign-born population - Other South Eastern Asia (%)
Place of birth for the foreign-born population - Armenia (%)
Place of birth for the foreign-born population - Iraq (%)
Place of birth for the foreign-born population - Israel (%)
Place of birth for the foreign-born population - Jordan (%)
Place of birth for the foreign-born population - Kuwait (%)
Place of birth for the foreign-born population - Lebanon (%)
Place of birth for the foreign-born population - Saudi Arabia (%)
Place of birth for the foreign-born population - Syria (%)
Place of birth for the foreign-born population - Turkey (%)
Place of birth for the foreign-born population - Yemen (%)
Place of birth for the foreign-born population - Other Western Asia (%)
Place of birth for the foreign-born population - Eritrea (%)
Place of birth for the foreign-born population - Ethiopia (%)
Place of birth for the foreign-born population - Kenya (%)
Place of birth for the foreign-born population - Somalia (%)
Place of birth for the foreign-born population - Uganda (%)
Place of birth for the foreign-born population - Zimbabwe (%)
Place of birth for the foreign-born population - Other Eastern Africa (%)
Place of birth for the foreign-born population - Cameroon (%)
Place of birth for the foreign-born population - Congo (%)
Place of birth for the foreign-born population - Democratic Republic of Congo (Zaire) (%)
Place of birth for the foreign-born population - Other Middle Africa (%)
Place of birth for the foreign-born population - Egypt (%)
Place of birth for the foreign-born population - Morocco (%)
Place of birth for the foreign-born population - Sudan (%)
Place of birth for the foreign-born population - Other Northern Africa (%)
Place of birth for the foreign-born population - South Africa (%)
Place of birth for the foreign-born population - Other Southern Africa (%)
Place of birth for the foreign-born population - Cabo Verde (%)
Place of birth for the foreign-born population - Ghana (%)
Place of birth for the foreign-born population - Liberia (%)
Place of birth for the foreign-born population - Nigeria (%)
Place of birth for the foreign-born population - Senegal (%)
Place of birth for the foreign-born population - Sierra Leone (%)
Place of birth for the foreign-born population - Other Western Africa (%)
Place of birth for the foreign-born population - Australia (%)
Place of birth for the foreign-born population - New Zealand (%)
Place of birth for the foreign-born population - Fiji (%)
Place of birth for the foreign-born population - Micronesia (%)
Place of birth for the foreign-born population - Bahamas (%)
Place of birth for the foreign-born population - Barbados (%)
Place of birth for the foreign-born population - Cuba (%)
Place of birth for the foreign-born population - Dominica (%)
Place of birth for the foreign-born population - Dominican Republic (%)
Place of birth for the foreign-born population - Grenada (%)
Place of birth for the foreign-born population - Haiti (%)
Place of birth for the foreign-born population - Jamaica (%)
Place of birth for the foreign-born population - St. Vincent and the Grenadines (%)
Place of birth for the foreign-born population - Trinidad and Tobago (%)
Place of birth for the foreign-born population - West Indies (%)
Place of birth for the foreign-born population - Other Caribbean (%)
Place of birth for the foreign-born population - Belize (%)
Place of birth for the foreign-born population - Costa Rica (%)
Place of birth for the foreign-born population - El Salvador (%)
Place of birth for the foreign-born population - Guatemala (%)
Place of birth for the foreign-born population - Honduras (%)
Place of birth for the foreign-born population - Mexico (%)
Place of birth for the foreign-born population - Nicaragua (%)
Place of birth for the foreign-born population - Panama (%)
Place of birth for the foreign-born population - Other Central America (%)
Place of birth for the foreign-born population - Argentina (%)
Place of birth for the foreign-born population - Bolivia (%)
Place of birth for the foreign-born population - Brazil (%)
Place of birth for the foreign-born population - Chile (%)
Place of birth for the foreign-born population - Colombia (%)
Place of birth for the foreign-born population - Ecuador (%)
Place of birth for the foreign-born population - Guyana (%)
Place of birth for the foreign-born population - Peru (%)
Place of birth for the foreign-born population - Uruguay (%)
Place of birth for the foreign-born population - Venezuela (%)
Place of birth for the foreign-born population - Other South America (%)
Place of birth for the foreign-born population - Canada (%)
Place of birth for the foreign-born population - Other Northern America (%)
Place of birth for the foreign-born population - Other (%)
Latest news about races in Norwalk, CT collected exclusively by city-data.com from local newspapers, TV, and radio stations
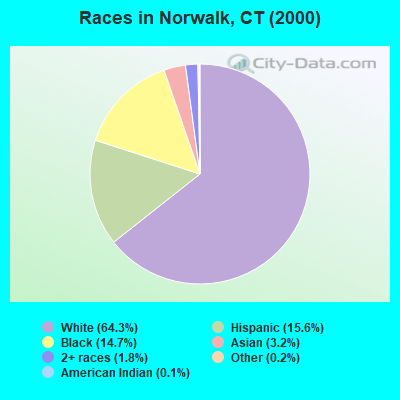
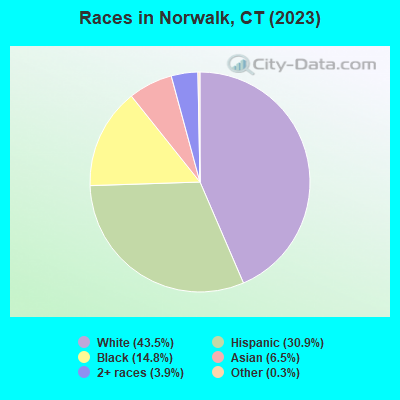
According to 2022 data, the most numerous races in Norwalk, CT are White alone (41,244 residents), Hispanic (30,087 residents), and Black alone (15,006 residents). 61.5% of Norwalk residents speak English at home. 31.2% of Norwalk, CT residents are foreign-born (21.9% born in Latin America, 3.6% born in Europe, 3.3% born in Asia), which is 51.9% greater than the foreign-born rate of 15.0% across the entire state of Connecticut.
Race distribution in Norwalk
2000 2022
53,324 64.3% White alone 12,966 15.6% Hispanic 12,231 14.7% Black alone 2,672 3.2% Asian alone 1,498 1.8% Two or more races 137 0.2% Other race alone 95 0.1% American Indian alone 28 0.03% Native Hawaiian and Other
41,244 45.1% White alone 30,087 32.9% Hispanic 15,006 16.4% Black alone 2,521 2.8% Two or more races 2,398 2.6% Asian alone 68 0.07% Other race alone 57 0.06% American Indian alone
2000 2022
2,638,845 77.5% White alone 320,323 9.4% Hispanic 295,571 8.7% Black alone 81,564 2.4% Asian alone 52,896 1.6% Two or more races 8,141 0.2% Other race alone 7,267 0.2% American Indian alone 958 0.03% Native Hawaiian and Other
2,246,913 62.0% White alone 658,978 18.2% Hispanic 353,973 9.8% Black alone 172,929 4.8% Asian alone 159,631 4.4% Two or more races 29,761 0.8% Other race alone 3,428 0.09% American Indian alone 592 0.02% Native Hawaiian and Other
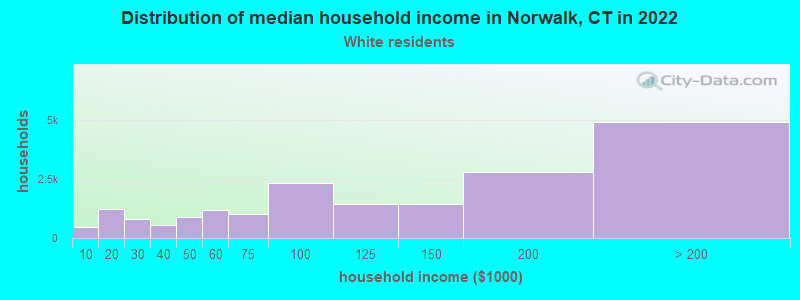
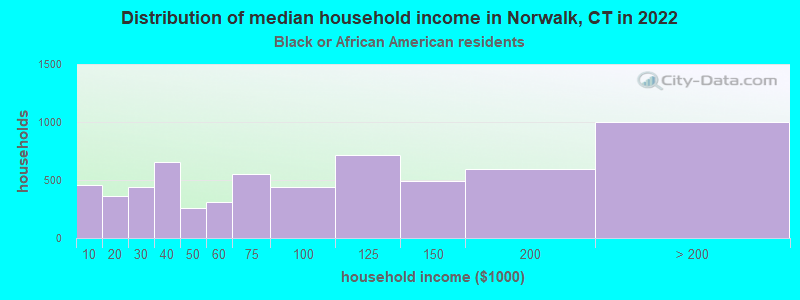
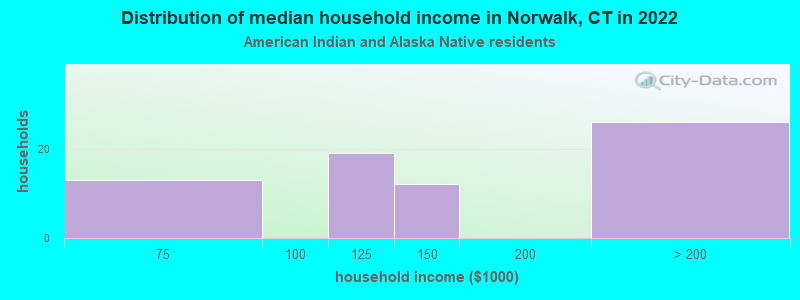
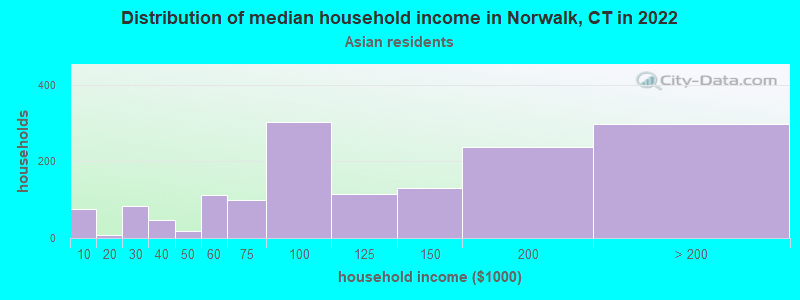
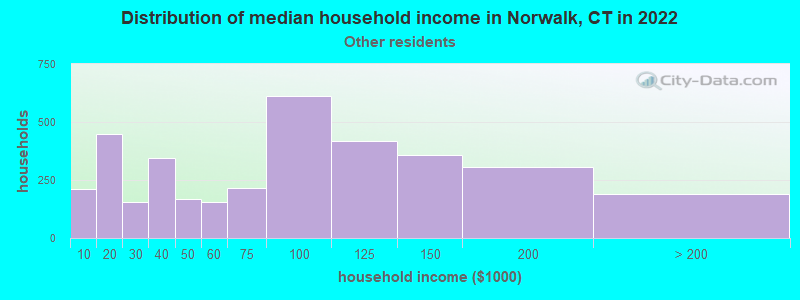
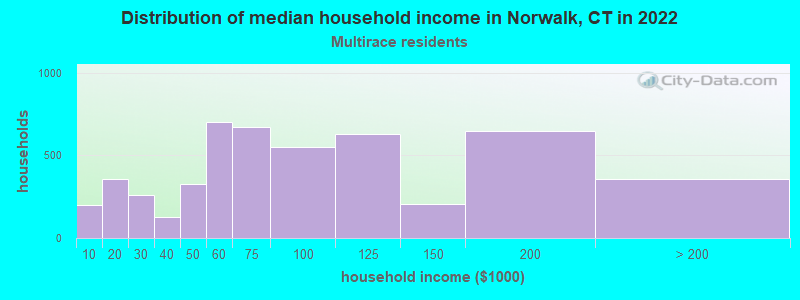
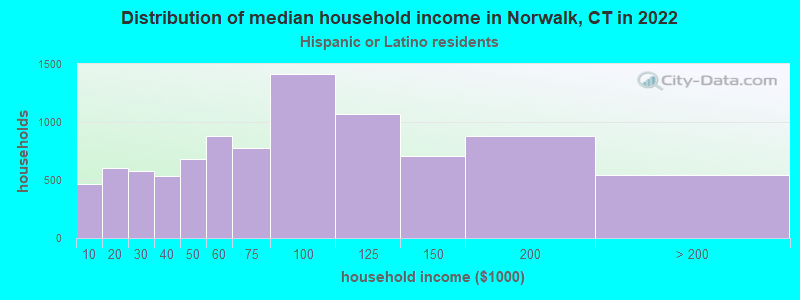
Income and house value in Norwalk Median household income in 2022 $120,079 White non-Hispanic householders$131,922 Black householders$137,855 Asian householders$92,148 Some other race householders$78,606 Two or more races householders$89,052 Hispanic or Latino race householdersMedian 2022 house value $663,062 White Non-Hispanic householders$477,113 Black or African American householders$503,475 American Indian or Alaska Native householders $562,555 Asian householders$485,822 Some other race householders$522,306 Two or more races householders$500,415 Hispanic or Latino householders
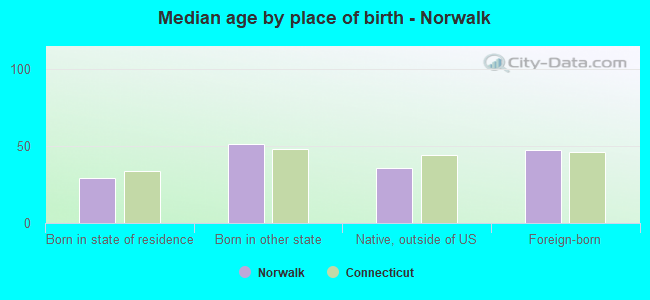
Median age by race in Norwalk
49.2 Median age for White residents43.8 53.5 47.3 Median age for Black or African American residents41.0 49.8 -666,666,666.0 Median age for American Indian / Alaska Native residents-666,666,666.0 -666,666,666.0 53.3 Median age for Asian residents51.0 55.2 -666,666,666.0 Median age for Native Hawaiian / Pacific Islander residents-666,666,666.0 -666,666,666.0 32.8 Median age for Other race residents30.3 36.1 38.4 Median age for Two or more races residents37.4 42.1 49.5 Median age for White alone residents44.9 53.5 34.6 Median age for Hispanic or Latino residents30.8 37.2
Owner/renter occupied households by race in Norwalk
House owners and renters - White residents 12,812 67.2% Owner occupied6,250 32.8% Renter occupiedHouse owners and renters - Black or African American residents 3,634 59.1% Owner occupied2,515 40.9% Renter occupiedHouse owners and renters - American Indian / Alaska Native residents 59 93.5% Owner occupied4 6.5% Renter occupiedHouse owners and renters - Asian residents 515 57.5% Owner occupied381 42.5% Renter occupiedHouse owners and renters - Other race residents 1,163 21.0% Owner occupied4,386 79.0% Renter occupiedHouse owners and renters - Two or more races residents 1,029 22.9% Owner occupied3,464 77.1% Renter occupiedHouse owners and renters - White alone residents 12,747 68.3% Owner occupied5,908 31.7% Renter occupiedHouse owners and renters - Hispanic or Latino residents 1,878 19.7% Owner occupied7,636 80.3% Renter occupied
Language usage in Norwalk
English speakers - Total 61.5% of residents of Norwalk speak English at home.
29.4% of residents speak Spanish at home 11,956 46.4% Speak English very well13,813 53.6% Speak English less than very well9.1% of residents speak other language at home 5,222 65.8% Speak English very well2,709 34.2% Speak English less than very well
English speakers - Born in the United States 90.4% of residents of Norwalk speak English at home.
8.1% of residents speak Spanish at home 1,922 98.2% Speak English very well35 1.8% Speak English less than very well1.5% of residents speak other language at home 295 83.6% Speak English very well58 16.4% Speak English less than very well
English speakers - Native, born elsewhere 66.7% of residents of Norwalk speak English at home.
13.0% of residents speak Spanish at home 135 59.5% Speak English very well92 40.5% Speak English less than very well20.3% of residents speak other language at home 353 100.0% Speak English very well
English speakers - Foreign-born 16.1% of residents of Norwalk speak English at home.
65.2% of residents speak Spanish at home 4,494 25.3% Speak English very well13,303 74.7% Speak English less than very well18.7% of residents speak other language at home 3,031 59.4% Speak English very well2,074 40.6% Speak English less than very well
White (Caucasian) - Speak only English Native:
93.3% (34,606)Foreign-born:
44.5% (1,310)
White (Caucasian) - Speak another language Native:
6.7% (2,498)Foreign-born:
55.5% (1,635)
Black or African American - Speak only English Native:
92.8% (10,082)Foreign-born:
57.9% (2,413)
Black or African American - Speak another language Native:
7.2% (781)Foreign-born:
42.1% (1,755)
American Indian / Alaska Native - Speak only English Native:
25.7% (19)Foreign-born:
7.0% (17)
American Indian / Alaska Native - Speak another language Native:
93.0% (69)Foreign-born:
87.8% (216)
Asian - Speak only English Native:
25.7% (147)Foreign-born:
11.1% (203)
Asian - Speak another language Native:
74.3% (425)Foreign-born:
88.9% (1,623)
Other race - Speak only English Native:
30.8% (1,573)Foreign-born:
1.9% (232)
Other race - Speak another language Native:
69.2% (3,541)Foreign-born:
98.1% (12,170)
Two or more races - Speak only English Native:
46.5% (3,082)Foreign-born:
4.1% (241)
Two or more races - Speak another language Native:
53.5% (3,553)Foreign-born:
95.9% (5,658)
White alone - Speak only English Native:
93.9% (34,452)Foreign-born:
47.3% (1,310)
White alone - Speak another language Native:
6.1% (2,230)Foreign-born:
52.7% (1,457)
Hispanic or Latino - Speak only English Native:
31.2% (3,159)Foreign-born:
2.1% (391)
Hispanic or Latino - Speak another language Native:
68.8% (6,965)Foreign-born:
97.9% (17,797)
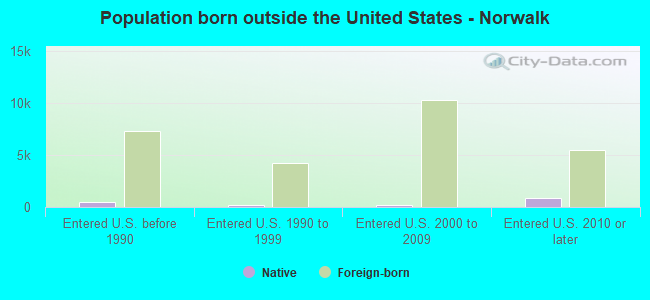
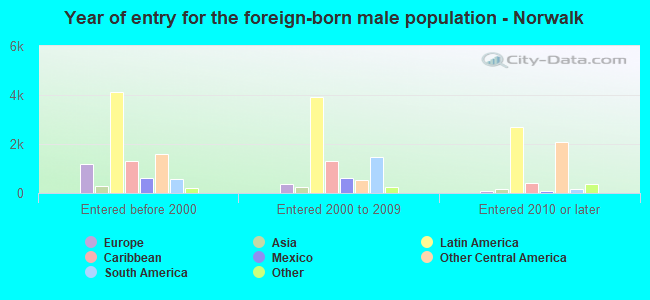
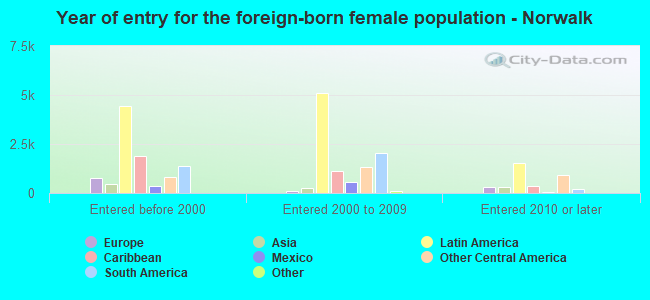
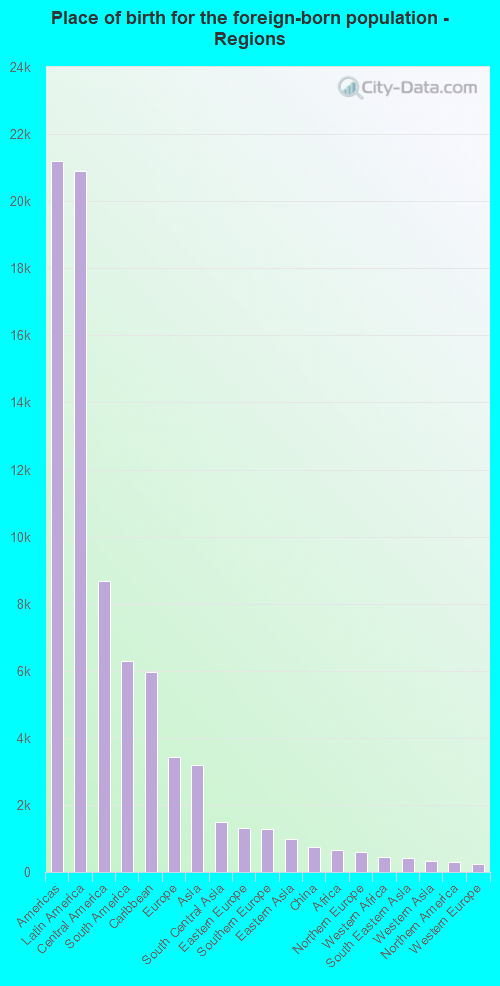
Foreign-born residents in Norwalk 28,533 residents are foreign born (21.9% Latin America , 3.6% Europe , 3.3% Asia ).
This city:
31.2%Connecticut:
15.0%
Marital status for residents in Norwalk Marital status - White (Caucasian) population 15 years and over
Males 42.3% Never married46.0% Now married1.3% Separated2.7% Widowed7.6% DivorcedFemales 26.3% Never married50.3% Now married1.7% Separated11.1% Widowed10.6% DivorcedWomen who gave birth in the past 12 months Now married:
77.8% (260)Unmarried:
22.2% (74)
Women who did not give birth in the past 12 months Now married:
45.2% (2,913)Unmarried:
54.8% (3,533)
Marital status - Black or African American population 15 years and over
Males 45.9% Never married41.4% Now married2.5% Separated2.0% Widowed8.3% DivorcedFemales 47.4% Never married33.8% Now married3.2% Separated8.5% Widowed7.1% DivorcedWomen who gave birth in the past 12 months Now married:
100.0% (56)Unmarried:
0.0% (0)
Women who did not give birth in the past 12 months Now married:
34.5% (1,395)Unmarried:
65.5% (2,645)
Marital status - American Indian / Alaska Native population 15 years and over
Males 6.9% Never married73.3% Now married0.0% Separated12.2% Widowed7.6% DivorcedFemales 25.8% Never married63.6% Now married0.0% Separated0.0% Widowed10.6% DivorcedWomen who did not give birth in the past 12 months Now married:
65.3% (32)Unmarried:
34.7% (17)
Marital status - Asian population 15 years and over
Males 38.8% Never married54.7% Now married0.0% Separated4.2% Widowed2.4% DivorcedFemales 25.2% Never married62.8% Now married1.2% Separated3.7% Widowed7.1% DivorcedWomen who gave birth in the past 12 months Now married:
100.0% (19)Unmarried:
0.0% (0)
Women who did not give birth in the past 12 months Now married:
59.5% (596)Unmarried:
40.5% (405)
Marital status - Native Hawaiian / Pacific Islander population 15 years and over
Males 0.0% Never married100.0% Now married0.0% Separated0.0% Widowed0.0% DivorcedFemales 0.0% Never married100.0% Now married0.0% Separated0.0% Widowed0.0% DivorcedWomen who gave birth in the past 12 months Now married:
100.0% (23)Unmarried:
0.0% (0)
Marital status - Other race population 15 years and over
Males 51.3% Never married40.5% Now married1.5% Separated0.6% Widowed6.2% DivorcedFemales 36.5% Never married40.9% Now married6.3% Separated1.0% Widowed15.3% DivorcedWomen who gave birth in the past 12 months Now married:
100.0% (430)Unmarried:
0.0% (0)
Women who did not give birth in the past 12 months Now married:
32.0% (1,629)Unmarried:
68.0% (3,469)
Marital status - Two or more races population 15 years and over
Males 41.5% Never married42.1% Now married4.2% Separated7.9% Widowed4.2% DivorcedFemales 35.9% Never married37.7% Now married4.2% Separated4.9% Widowed17.3% DivorcedWomen who gave birth in the past 12 months Now married:
0.0% (0)Unmarried:
100.0% (28)
Women who did not give birth in the past 12 months Now married:
31.2% (1,374)Unmarried:
68.8% (3,029)
Marital status - White alone, not Hispanic / Latino population 15 years and over
Males 41.7% Never married46.6% Now married1.3% Separated2.8% Widowed7.7% DivorcedFemales 26.3% Never married51.0% Now married1.7% Separated10.2% Widowed10.7% DivorcedWomen who gave birth in the past 12 months Now married:
77.8% (260)Unmarried:
22.2% (74)
Women who did not give birth in the past 12 months Now married:
45.7% (2,913)Unmarried:
54.3% (3,468)
Marital status - Hispanic or Latino population 15 years and over
Males 50.0% Never married39.8% Now married2.8% Separated1.7% Widowed5.7% DivorcedFemales 35.9% Never married39.7% Now married5.9% Separated4.5% Widowed14.0% DivorcedWomen who gave birth in the past 12 months Now married:
100.0% (430)Unmarried:
0.0% (0)
Women who did not give birth in the past 12 months Now married:
33.3% (2,339)Unmarried:
66.7% (4,681)
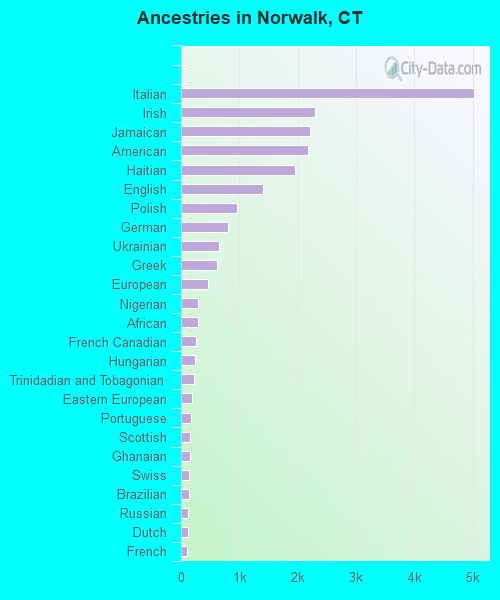
Ancestries in Norwalk
5,031 10.2% Italian2,302 4.7% Irish2,214 4.5% Jamaican2,174 4.4% American1,956 4.0% Haitian1,409 2.9% English962 1.9% Polish812 1.6% German658 1.3% Ukrainian620 1.3% Greek456 0.9% European290 0.6% Nigerian284 0.6% African259 0.5% French Canadian238 0.5% Hungarian228 0.5% Trinidadian and Tobagonian191 0.4% Eastern European172 0.3% Portuguese161 0.3% Scottish149 0.3% Ghanaian142 0.3% Swiss135 0.3% Brazilian127 0.3% Russian119 0.2% Dutch110 0.2% French86 0.2% Norwegian79 0.2% Bahamian78 0.2% Danish77 0.2% Austrian77 0.2% Canadian76 0.2% Albanian75 0.2% British69 0.1% Sierra Leonean66 0.1% Scotch-Irish63 0.1% Romanian61 0.1% Palestinian60 0.1% British West Indian60 0.1% Barbadian53 0.1% Swedish47 0.10% Turkish40 0.08% Croatian39 0.08% Iranian32 0.06% Northern European29 0.06% Guyanese29 0.06% Lithuanian23 0.05% Ethiopian23 0.05% Celtic20 0.04% Slovak20 0.04% Scandinavian20 0.04% Serbian20 0.04% Syrian19 0.04% Liberian17 0.03% Latvian16 0.03% Bulgarian15 0.03% Macedonian15 0.03% Belgian14 0.03% Finnish14 0.03% Moroccan14 0.03% Lebanese12 0.02% Armenian10 0.02% Czech7 0.01% Cypriot5 0.01% South African
Geographical mobility in Norwalk Same house 1 year ago 36,095 86.9% White (Caucasian)14,649 91.4% Black or African American259 84.0% American Indian / Alaska Native2,904 77.4% Asian38 45.4% Native Hawaiian / Pacific Islander10,147 90.4% Other race13,966 88.9% Two or more races35,724 87.3% White alone, not Hispanic / Latino26,216 88.8% Hispanic or LatinoMoved within same county 2,116 5.1% White / Caucasian583 3.6% Black or African American26 8.3% American Indian / Alaska Native281 7.5% Asian43 52.1% Native Hawaiian / Pacific Islander603 5.4% Other race1,077 6.9% Two or more races1,952 4.8% White alone, not Hispanic / Latino1,738 5.9% Hispanic or LatinoMoved within same state 747 1.8% White / Caucasian73 0.5% Black or African American169 4.5% Asian26 0.2% Other race145 0.9% Two or more races747 1.8% White alone, not Hispanic / Latino515 1.7% Hispanic or LatinoMoved from different state 2,468 5.9% White / Caucasian451 2.8% Black or African American252 6.7% Asian155 1.4% Other race278 1.8% Two or more races2,403 5.9% White alone, not Hispanic / Latino603 2.0% Hispanic or LatinoMoved from abroad 108 0.3% White157 1.0% Black or African American143 3.8% Asian321 2.9% Other race168 1.1% Two or more races108 0.3% White alone, not Hispanic / Latino452 1.5% Hispanic or Latino
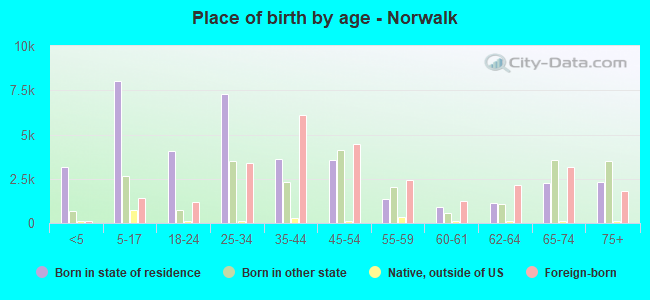
Children Nativity (place of birth) in Norwalk
Children under 6 years - Living with two parents Both parents native 2,062 100.0% NativeBoth parents foreign-born 1,037 84.8% Native187 15.2% Foreign-bornOne native, one foreign-born parent 557 100.0% NativeChildren under 6 years - Living with one parent Native parent 870 100.0% NativeForeign-born parent 602 90.0% Native67 10.0% Foreign-bornChildren 6 to 17 years - Living with two parents Both parents native 2,768 99.7% Native10 0.3% Foreign-bornBoth parents foreign-born 2,309 88.2% Native309 11.8% Foreign-bornOne native, one foreign-born parent 1,568 99.5% Native8 0.5% Foreign-bornChildren 6 to 17 years - Living with one parent Native parent 953 100.0% NativeForeign-born parent 2,499 57.7% Native1,836 42.3% Foreign-born
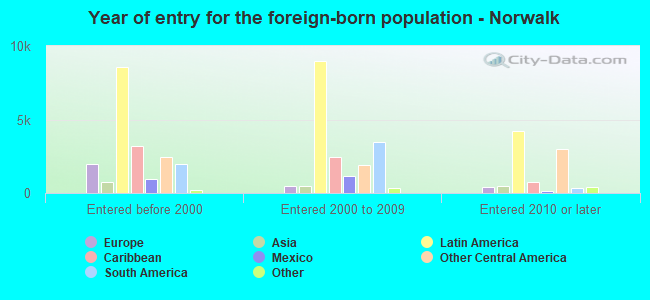
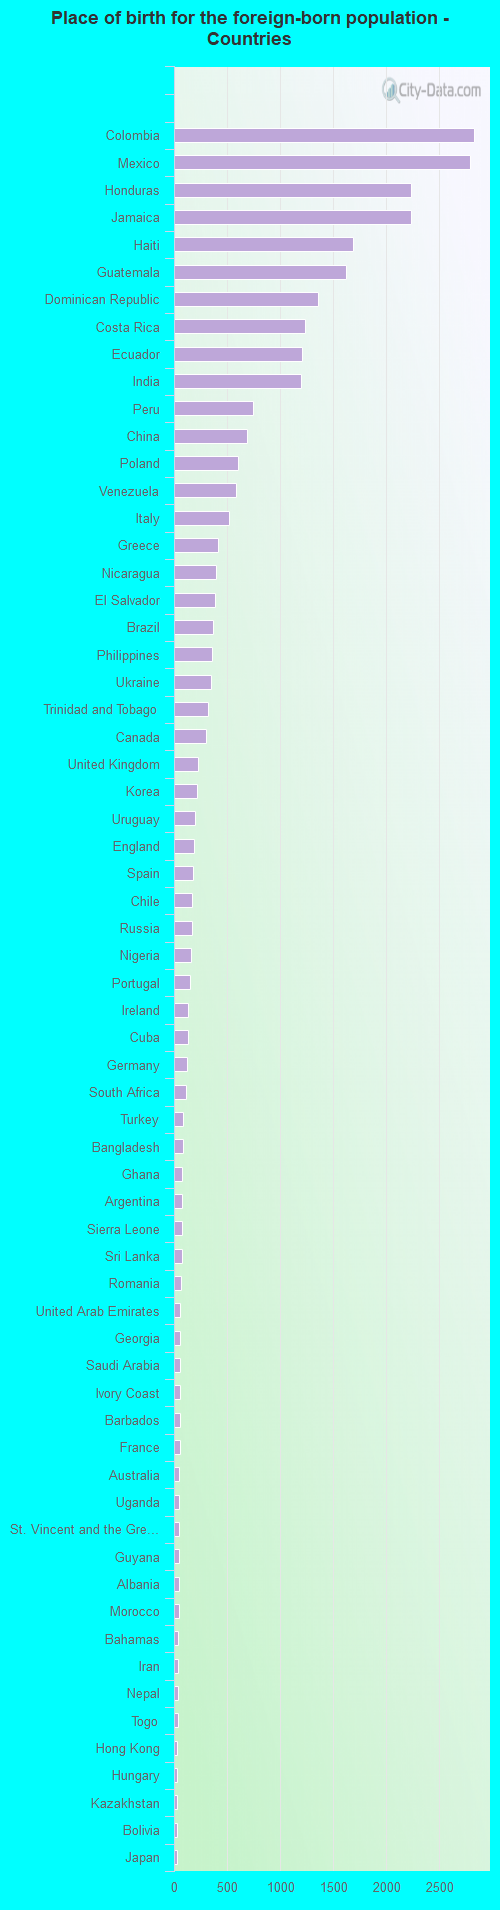
Place of birth for residents in Norwalk 21,208 Americas20,909 Latin America8,669 Central America6,281 South America5,957 Caribbean3,423 Europe3,179 Asia1,478 South Central Asia1,302 Eastern Europe1,268 Southern Europe974 Eastern Asia734 China655 Africa607 Northern Europe437 Western Africa410 South Eastern Asia316 Western Asia299 Northern America235 Western Europe110 Southern Africa65 Oceania65 Australia and New Zealand Subregion61 Eastern Africa45 Northern Africa2,829 Colombia2,790 Mexico2,236 Honduras2,235 Jamaica1,684 Haiti1,621 Guatemala1,354 Dominican Republic1,235 Costa Rica1,206 Ecuador1,194 India741 Peru693 China599 Poland588 Venezuela522 Italy418 Greece397 Nicaragua384 El Salvador364 Brazil356 Philippines348 Ukraine322 Trinidad and Tobago299 Canada222 United Kingdom213 Korea199 Uruguay187 England180 Spain172 Chile167 Russia158 Nigeria147 Portugal135 Ireland132 Cuba120 Germany110 South Africa88 Turkey85 Bangladesh77 Ghana73 Argentina72 Sierra Leone71 Sri Lanka64 Romania61 United Arab Emirates61 Georgia60 Saudi Arabia56 Ivory Coast56 Barbados54 France50 Australia48 Uganda47 St. Vincent and the Grenadines47 Guyana46 Albania45 Morocco42 Bahamas39 Iran36 Nepal34 Togo32 Hong Kong29 Hungary29 Kazakhstan27 Bolivia26 Japan24 Denmark23 Switzerland20 Netherlands20 Liberia20 Serbia20 Dominica18 Sweden17 Burma (Myanmar)17 Senegal16 Belarus16 Belgium15 New Zealand15 Lebanon15 Indonesia15 Pakistan15 Israel11 Laos10 Norway8 Scotland8 Tanzania8 Taiwan7 Bulgaria5 Malaysia5 Kenya3 Singapore1 Latvia
Grandparents responsible for own grandchildren in Norwalk
Grandparents (30 to 59 years) White / Caucasian 12 7.8% Responsible for grandchildren141 92.2% Not responsible for grandchildrenBlack or African American 8 19.0% Responsible for grandchildren33 81.0% Not responsible for grandchildrenAsian 19 68.4% Responsible for grandchildren9 31.6% Not responsible for grandchildrenOther race 48 100.0% Responsible for grandchildrenTwo or more races 72 100.0% Not responsible for grandchildrenWhite alone, not Hispanic / Latino 4 2.9% Responsible for grandchildren142 97.1% Not responsible for grandchildrenHispanic or Latino 107 72.8% Responsible for grandchildren40 27.2% Not responsible for grandchildrenGrandparents (60 years and over) White / Caucasian 52 15.8% Responsible for grandchildren279 84.2% Not responsible for grandchildrenBlack or African American 110 31.6% Responsible for grandchildren239 68.4% Not responsible for grandchildrenAsian 67 100.0% Not responsible for grandchildrenOther race 352 100.0% Not responsible for grandchildrenTwo or more races 200 100.0% Not responsible for grandchildrenWhite alone, not Hispanic / Latino 26 12.0% Responsible for grandchildren191 88.0% Not responsible for grandchildrenHispanic or Latino 34 6.1% Responsible for grandchildren525 93.9% Not responsible for grandchildren