Races in Oak Grove, Oregon (OR) Detailed Stats
Data:
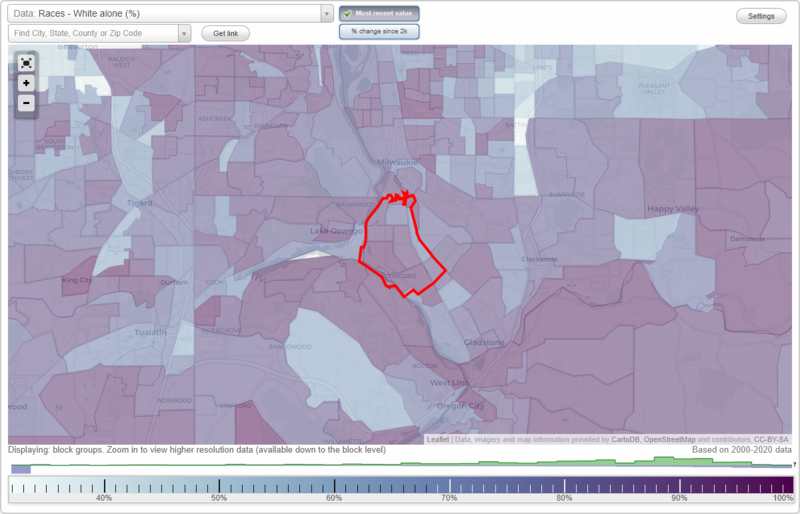
Races - White alone (%)
Races - White alone (% change since 2000)
Races - Black alone (%)
Races - Black alone (% change since 2000)
Races - American Indian alone (%)
Races - American Indian alone (% change since 2000)
Races - Asian alone (%)
Races - Asian alone (% change since 2000)
Races - Hispanic (%)
Races - Hispanic (% change since 2000)
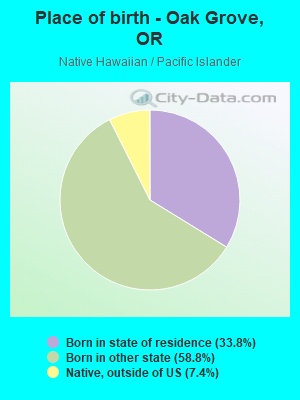
Races - Native Hawaiian and Other Pacific Islander alone (%)
Races - Native Hawaiian and Other Pacific Islander alone (% change since 2000)
Races - Two or more races(%)
Races - Two or more races(% change since 2000)
Races - Other race alone (%)
Races - Other race alone (% change since 2000)
Racial diversity
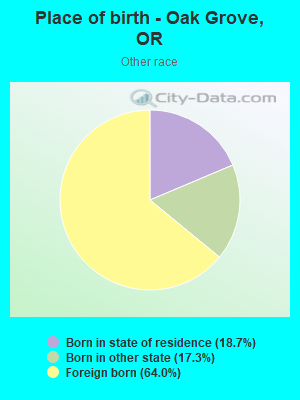
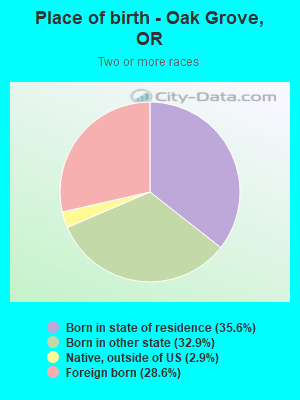
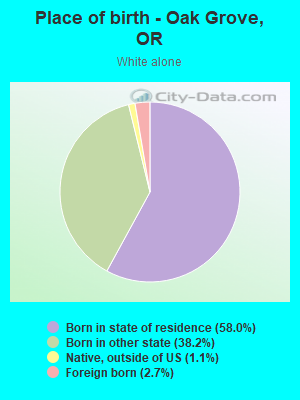
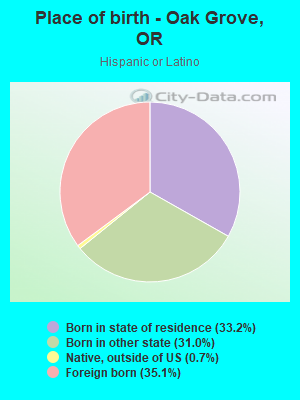
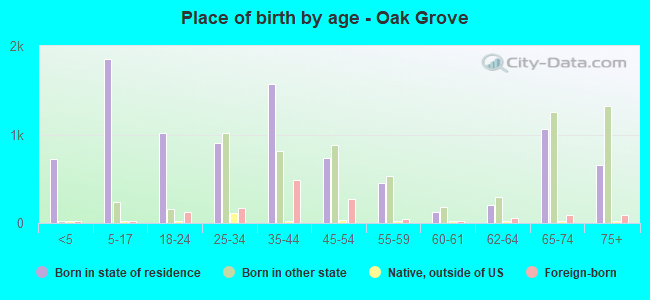
Place of birth - Born in state of residence (%)
Place of birth - Born in state of residence (%) - White
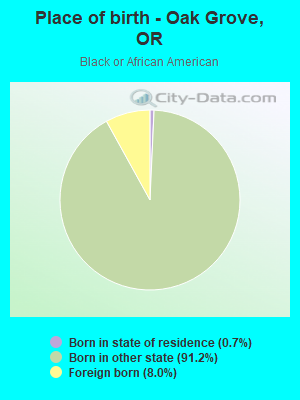
Place of birth - Born in state of residence (%) - Black or African American
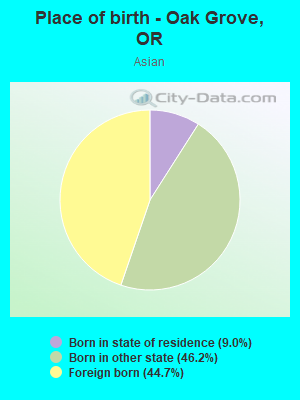
Place of birth - Born in state of residence (%) - Asian
Place of birth - Born in state of residence (%) - Hispanic or Latino
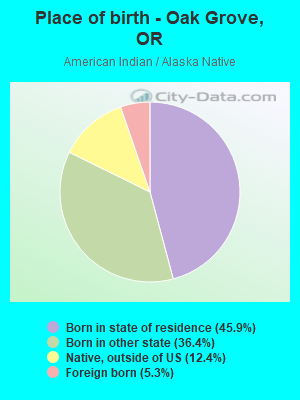
Place of birth - Born in state of residence (%) - American Indian and Alaska Native
Place of birth - Born in state of residence (%) - Multirace
Place of birth - Born in state of residence (%) - Other Race
Place of birth - Born in other state (%)
Place of birth - Born in other state (%) - White
Place of birth - Born in other state (%) - Black or African American
Place of birth - Born in other state (%) - Asian
Place of birth - Born in other state (%) - Hispanic or Latino
Place of birth - Born in other state (%) - American Indian and Alaska Native
Place of birth - Born in other state (%) - Multirace
Place of birth - Born in other state (%) - Other Race
Place of birth - Native, outside of US (%)
Place of birth - Native, outside of US (%) - White
Place of birth - Native, outside of US (%) - Black or African American
Place of birth - Native, outside of US (%) - Asian
Place of birth - Native, outside of US (%) - Hispanic or Latino
Place of birth - Native, outside of US (%) - American Indian and Alaska Native
Place of birth - Native, outside of US (%) - Multirace
Place of birth - Native, outside of US (%) - Other Race
Place of birth - Foreign born (%)
Place of birth - Foreign born (%) - White
Place of birth - Foreign born (%) - Black or African American
Place of birth - Foreign born (%) - Asian
Place of birth - Foreign born (%) - Hispanic or Latino
Place of birth - Foreign born (%) - American Indian and Alaska Native
Place of birth - Foreign born (%) - Multirace
Place of birth - Foreign born (%) - Other Race
Residents speaking English at home (%)
Residents speaking English at home - Born in the United States (%)
Residents speaking English at home - Native, born elsewhere (%)
Residents speaking English at home - Foreign born (%)
Residents speaking Spanish at home (%)
Residents speaking Spanish at home - Born in the United States (%)
Residents speaking Spanish at home - Native, born elsewhere (%)
Residents speaking Spanish at home - Foreign born (%)
Residents speaking other language at home (%)
Residents speaking other language at home - Born in the United States (%)
Residents speaking other language at home - Native, born elsewhere (%)
Residents speaking other language at home - Foreign born (%)
Marital status - Never married (%)
Marital status - Now married (%)
Marital status - Separated (%)
Marital status - Widowed (%)
Marital status - Divorced (%)
Ancestries Reported - Arab (%)
Ancestries Reported - Czech (%)
Ancestries Reported - Danish (%)
Ancestries Reported - Dutch (%)
Ancestries Reported - English (%)
Ancestries Reported - French (%)
Ancestries Reported - French Canadian (%)
Ancestries Reported - German (%)
Ancestries Reported - Greek (%)
Ancestries Reported - Hungarian (%)
Ancestries Reported - Irish (%)
Ancestries Reported - Italian (%)
Ancestries Reported - Lithuanian (%)
Ancestries Reported - Norwegian (%)
Ancestries Reported - Polish (%)
Ancestries Reported - Portuguese (%)
Ancestries Reported - Russian (%)
Ancestries Reported - Scotch-Irish (%)
Ancestries Reported - Scottish (%)
Ancestries Reported - Slovak (%)
Ancestries Reported - Subsaharan African (%)
Ancestries Reported - Swedish (%)
Ancestries Reported - Swiss (%)
Ancestries Reported - Ukrainian (%)
Ancestries Reported - United States (%)
Ancestries Reported - Welsh (%)
Ancestries Reported - West Indian (%)
Ancestries Reported - Other (%)
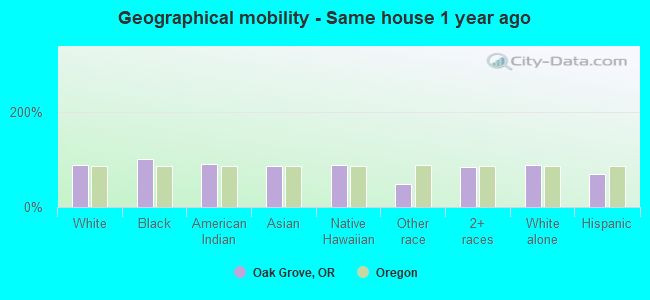
Geographical mobility - Same house 1 year ago (%)
Geographical mobility - Same house 1 year ago (%) - White
Geographical mobility - Same house 1 year ago (%) - Black or African American
Geographical mobility - Same house 1 year ago (%) - Asian
Geographical mobility - Same house 1 year ago (%) - Hispanic or Latino
Geographical mobility - Same house 1 year ago (%) - American Indian and Alaska Native
Geographical mobility - Same house 1 year ago (%) - Multirace
Geographical mobility - Same house 1 year ago (%) - Other Race
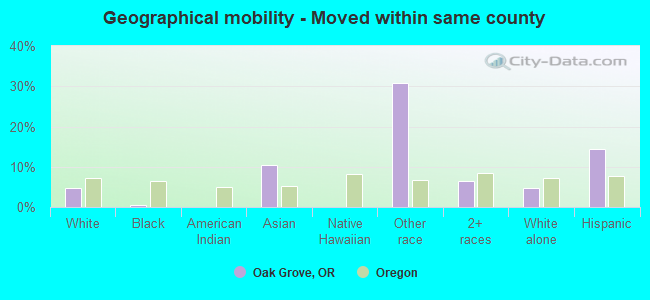
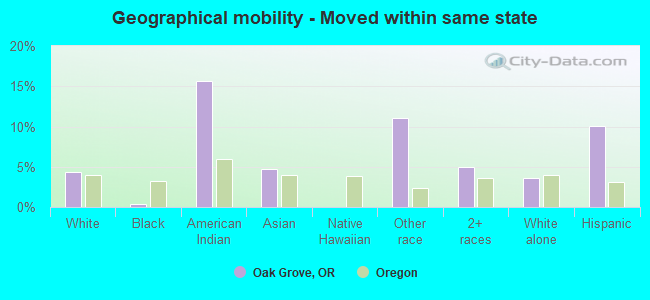
Geographical mobility - Moved within same county (%)
Geographical mobility - Moved within same county (%) - White
Geographical mobility - Moved within same county (%) - Black or African American
Geographical mobility - Moved within same county (%) - Asian
Geographical mobility - Moved within same county (%) - Hispanic or Latino
Geographical mobility - Moved within same county (%) - American Indian and Alaska Native
Geographical mobility - Moved within same county (%) - Multirace
Geographical mobility - Moved within same county (%) - Other Race
Geographical mobility - Moved from different county within same state (%)
Geographical mobility - Moved from different county within same state (%) - White
Geographical mobility - Moved from different county within same state (%) - Black or African American
Geographical mobility - Moved from different county within same state (%) - Asian
Geographical mobility - Moved from different county within same state (%) - Hispanic or Latino
Geographical mobility - Moved from different county within same state (%) - American Indian and Alaska Native
Geographical mobility - Moved from different county within same state (%) - Multirace
Geographical mobility - Moved from different county within same state (%) - Other Race
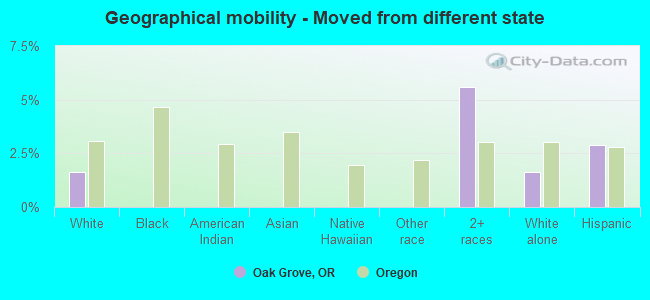
Geographical mobility - Moved from different state (%)
Geographical mobility - Moved from different state (%) - White
Geographical mobility - Moved from different state (%) - Black or African American
Geographical mobility - Moved from different state (%) - Asian
Geographical mobility - Moved from different state (%) - Hispanic or Latino
Geographical mobility - Moved from different state (%) - American Indian and Alaska Native
Geographical mobility - Moved from different state (%) - Multirace
Geographical mobility - Moved from different state (%) - Other Race
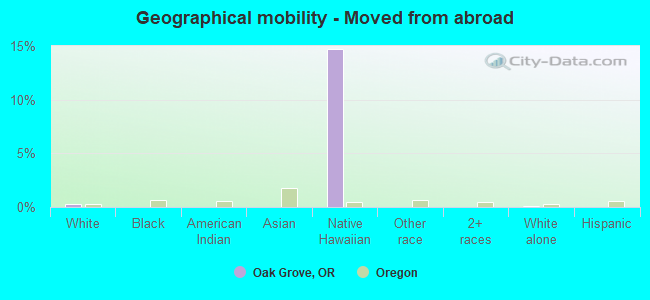
Geographical mobility - Moved from abroad (%)
Geographical mobility - Moved from abroad (%) - White
Geographical mobility - Moved from abroad (%) - Black or African American
Geographical mobility - Moved from abroad (%) - Asian
Geographical mobility - Moved from abroad (%) - Hispanic or Latino
Geographical mobility - Moved from abroad (%) - American Indian and Alaska Native
Geographical mobility - Moved from abroad (%) - Multirace
Geographical mobility - Moved from abroad (%) - Other Race
Place of birth for the foreign-born population - Ireland (%)
Place of birth for the foreign-born population - Denmark (%)
Place of birth for the foreign-born population - Norway (%)
Place of birth for the foreign-born population - Sweden (%)
Place of birth for the foreign-born population - United Kingdom (%)
Place of birth for the foreign-born population - England (%)
Place of birth for the foreign-born population - Scotland (%)
Place of birth for the foreign-born population - Other Northern Europe (%)
Place of birth for the foreign-born population - Austria (%)
Place of birth for the foreign-born population - Belgium (%)
Place of birth for the foreign-born population - France (%)
Place of birth for the foreign-born population - Germany (%)
Place of birth for the foreign-born population - Netherlands (%)
Place of birth for the foreign-born population - Switzerland (%)
Place of birth for the foreign-born population - Other Western Europe (%)
Place of birth for the foreign-born population - Greece (%)
Place of birth for the foreign-born population - Italy (%)
Place of birth for the foreign-born population - Portugal (%)
Place of birth for the foreign-born population - Spain (%)
Place of birth for the foreign-born population - Other Southern Europe (%)
Place of birth for the foreign-born population - Albania (%)
Place of birth for the foreign-born population - Belarus (%)
Place of birth for the foreign-born population - Bosnia and Herzegovina (%)
Place of birth for the foreign-born population - Bulgaria (%)
Place of birth for the foreign-born population - Croatia (%)
Place of birth for the foreign-born population - Czechoslovakia (%)
Place of birth for the foreign-born population - Hungary (%)
Place of birth for the foreign-born population - Latvia (%)
Place of birth for the foreign-born population - Lithuania (%)
Place of birth for the foreign-born population - North Macedonia (Macedonia) (%)
Place of birth for the foreign-born population - Moldova (%)
Place of birth for the foreign-born population - Poland (%)
Place of birth for the foreign-born population - Romania (%)
Place of birth for the foreign-born population - Russia (%)
Place of birth for the foreign-born population - Serbia (%)
Place of birth for the foreign-born population - Ukraine (%)
Place of birth for the foreign-born population - Other Eastern Europe (%)
Place of birth for the foreign-born population - China (%)
Place of birth for the foreign-born population - Hong Kong (%)
Place of birth for the foreign-born population - Taiwan (%)
Place of birth for the foreign-born population - Japan (%)
Place of birth for the foreign-born population - Korea (%)
Place of birth for the foreign-born population - Other Eastern Asia (%)
Place of birth for the foreign-born population - Afghanistan (%)
Place of birth for the foreign-born population - Bangladesh (%)
Place of birth for the foreign-born population - India (%)
Place of birth for the foreign-born population - Iran (%)
Place of birth for the foreign-born population - Kazakhstan (%)
Place of birth for the foreign-born population - Nepal (%)
Place of birth for the foreign-born population - Pakistan (%)
Place of birth for the foreign-born population - Sri Lanka (%)
Place of birth for the foreign-born population - Uzbekistan (%)
Place of birth for the foreign-born population - Other South Central Asia (%)
Place of birth for the foreign-born population - Burma (%)
Place of birth for the foreign-born population - Cambodia (%)
Place of birth for the foreign-born population - Indonesia (%)
Place of birth for the foreign-born population - Laos (%)
Place of birth for the foreign-born population - Malaysia (%)
Place of birth for the foreign-born population - Philippines (%)
Place of birth for the foreign-born population - Singapore (%)
Place of birth for the foreign-born population - Thailand (%)
Place of birth for the foreign-born population - Vietnam (%)
Place of birth for the foreign-born population - Other South Eastern Asia (%)
Place of birth for the foreign-born population - Armenia (%)
Place of birth for the foreign-born population - Iraq (%)
Place of birth for the foreign-born population - Israel (%)
Place of birth for the foreign-born population - Jordan (%)
Place of birth for the foreign-born population - Kuwait (%)
Place of birth for the foreign-born population - Lebanon (%)
Place of birth for the foreign-born population - Saudi Arabia (%)
Place of birth for the foreign-born population - Syria (%)
Place of birth for the foreign-born population - Turkey (%)
Place of birth for the foreign-born population - Yemen (%)
Place of birth for the foreign-born population - Other Western Asia (%)
Place of birth for the foreign-born population - Eritrea (%)
Place of birth for the foreign-born population - Ethiopia (%)
Place of birth for the foreign-born population - Kenya (%)
Place of birth for the foreign-born population - Somalia (%)
Place of birth for the foreign-born population - Uganda (%)
Place of birth for the foreign-born population - Zimbabwe (%)
Place of birth for the foreign-born population - Other Eastern Africa (%)
Place of birth for the foreign-born population - Cameroon (%)
Place of birth for the foreign-born population - Congo (%)
Place of birth for the foreign-born population - Democratic Republic of Congo (Zaire) (%)
Place of birth for the foreign-born population - Other Middle Africa (%)
Place of birth for the foreign-born population - Egypt (%)
Place of birth for the foreign-born population - Morocco (%)
Place of birth for the foreign-born population - Sudan (%)
Place of birth for the foreign-born population - Other Northern Africa (%)
Place of birth for the foreign-born population - South Africa (%)
Place of birth for the foreign-born population - Other Southern Africa (%)
Place of birth for the foreign-born population - Cabo Verde (%)
Place of birth for the foreign-born population - Ghana (%)
Place of birth for the foreign-born population - Liberia (%)
Place of birth for the foreign-born population - Nigeria (%)
Place of birth for the foreign-born population - Senegal (%)
Place of birth for the foreign-born population - Sierra Leone (%)
Place of birth for the foreign-born population - Other Western Africa (%)
Place of birth for the foreign-born population - Australia (%)
Place of birth for the foreign-born population - New Zealand (%)
Place of birth for the foreign-born population - Fiji (%)
Place of birth for the foreign-born population - Micronesia (%)
Place of birth for the foreign-born population - Bahamas (%)
Place of birth for the foreign-born population - Barbados (%)
Place of birth for the foreign-born population - Cuba (%)
Place of birth for the foreign-born population - Dominica (%)
Place of birth for the foreign-born population - Dominican Republic (%)
Place of birth for the foreign-born population - Grenada (%)
Place of birth for the foreign-born population - Haiti (%)
Place of birth for the foreign-born population - Jamaica (%)
Place of birth for the foreign-born population - St. Vincent and the Grenadines (%)
Place of birth for the foreign-born population - Trinidad and Tobago (%)
Place of birth for the foreign-born population - West Indies (%)
Place of birth for the foreign-born population - Other Caribbean (%)
Place of birth for the foreign-born population - Belize (%)
Place of birth for the foreign-born population - Costa Rica (%)
Place of birth for the foreign-born population - El Salvador (%)
Place of birth for the foreign-born population - Guatemala (%)
Place of birth for the foreign-born population - Honduras (%)
Place of birth for the foreign-born population - Mexico (%)
Place of birth for the foreign-born population - Nicaragua (%)
Place of birth for the foreign-born population - Panama (%)
Place of birth for the foreign-born population - Other Central America (%)
Place of birth for the foreign-born population - Argentina (%)
Place of birth for the foreign-born population - Bolivia (%)
Place of birth for the foreign-born population - Brazil (%)
Place of birth for the foreign-born population - Chile (%)
Place of birth for the foreign-born population - Colombia (%)
Place of birth for the foreign-born population - Ecuador (%)
Place of birth for the foreign-born population - Guyana (%)
Place of birth for the foreign-born population - Peru (%)
Place of birth for the foreign-born population - Uruguay (%)
Place of birth for the foreign-born population - Venezuela (%)
Place of birth for the foreign-born population - Other South America (%)
Place of birth for the foreign-born population - Canada (%)
Place of birth for the foreign-born population - Other Northern America (%)
Place of birth for the foreign-born population - Other (%)
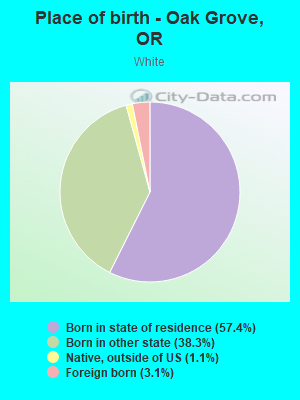
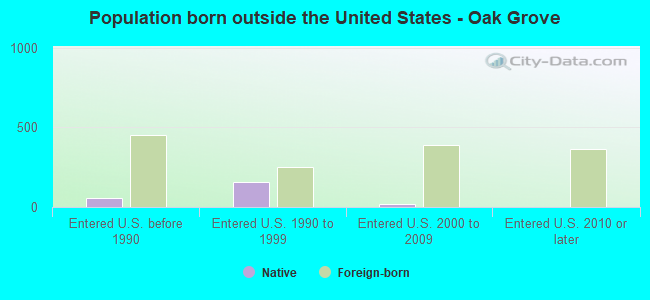
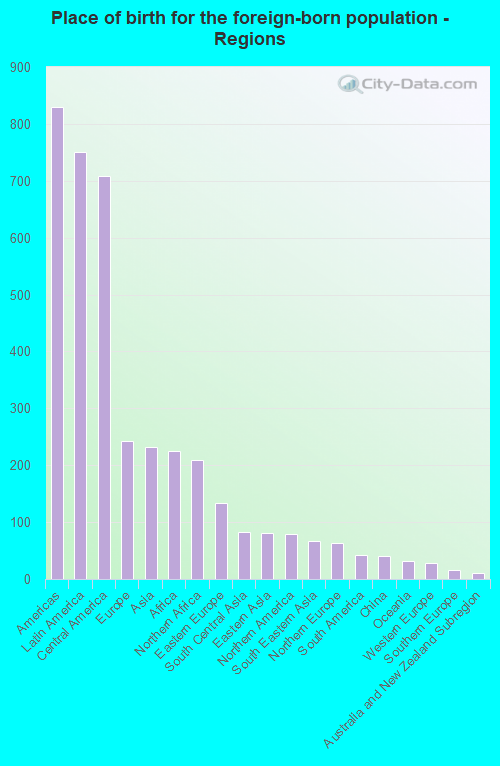
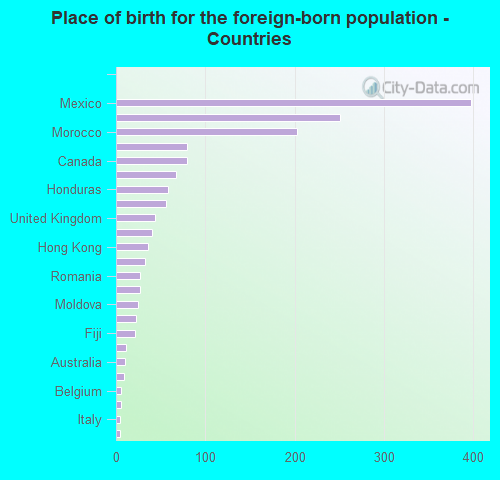
According to 2022 data, the most numerous races in Oak Grove, OR are White alone (13,649 residents), Hispanic (1,877 residents), and Two or more races (1,011 residents). 87.6% of Oak Grove residents speak English at home. 8.9% of Oak Grove, OR residents are foreign-born (4.2% born in Latin America, 1.4% born in Europe, 1.3% born in Asia, 1.3% born in Africa), which is about the same as the foreign-born rate of 9.0% across the entire state of Oregon.
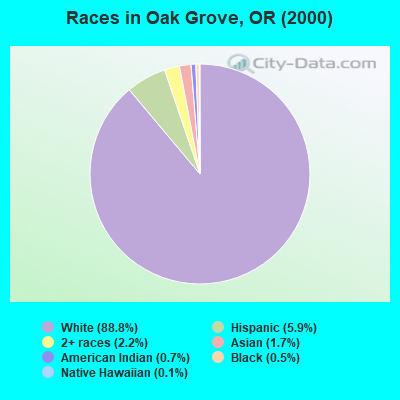
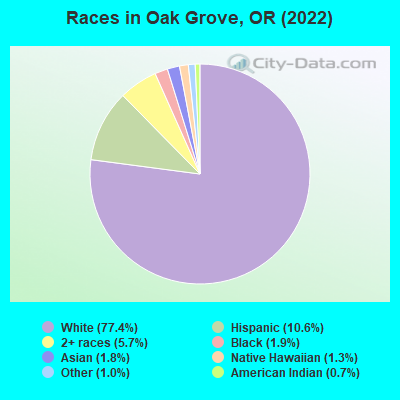
Race distribution in Oak Grove
2000 2022
2,857,616 83.5% White alone 275,314 8.0% Hispanic 100,333 2.9% Asian alone 82,733 2.4% Two or more races 53,325 1.6% Black alone 40,130 1.2% American Indian alone 7,398 0.2% Native Hawaiian and Other 4,550 0.1% Other race alone
3,037,571 71.6% White alone 609,538 14.4% Hispanic 252,744 6.0% Two or more races 191,283 4.5% Asian alone 78,228 1.8% Black alone 29,399 0.7% American Indian alone 25,731 0.6% Other race alone 15,643 0.4% Native Hawaiian and Other
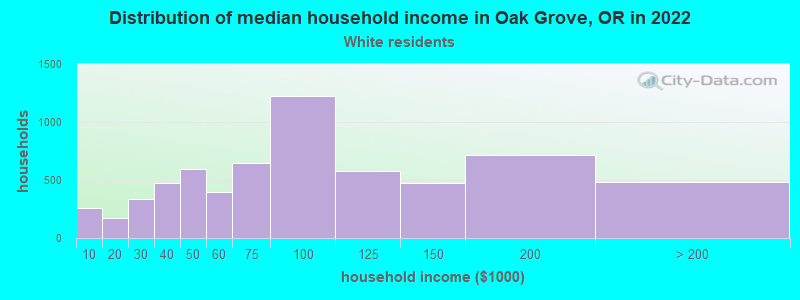
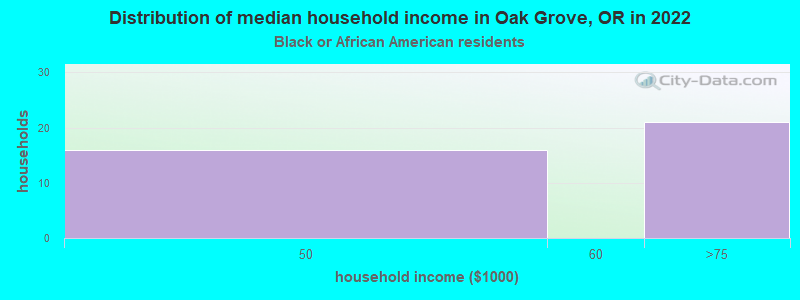
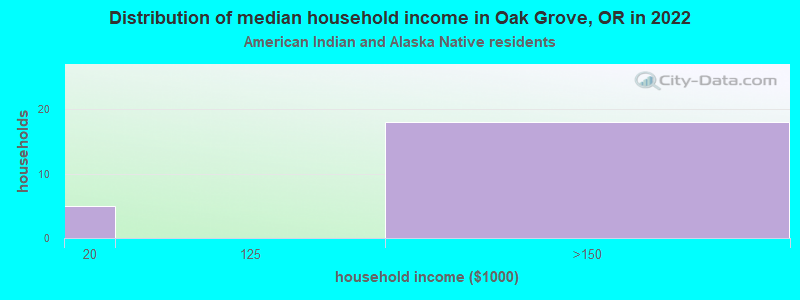
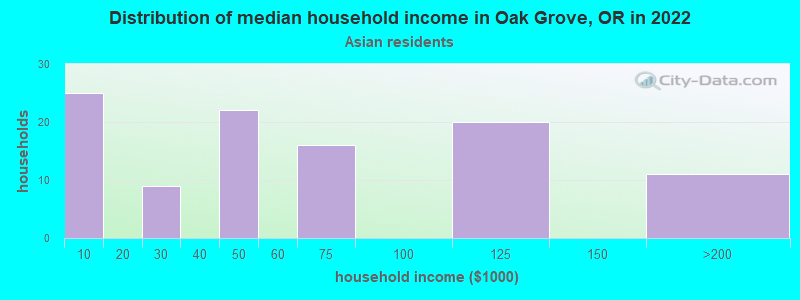
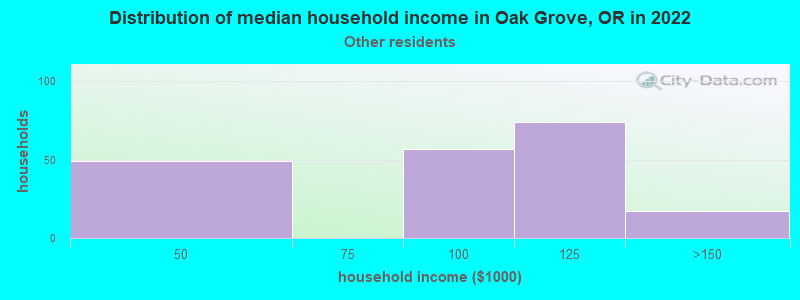
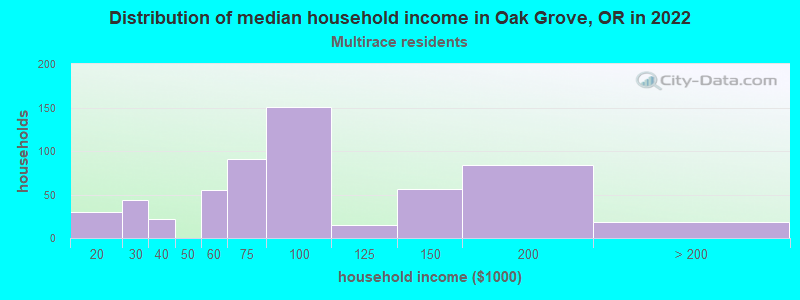
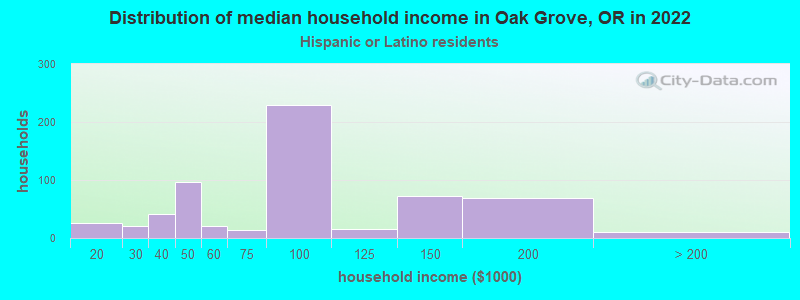
Income and house value in Oak Grove Median household income in 2022 $78,835 White non-Hispanic householders$64,020 Asian householders$93,421 Some other race householders$85,093 Two or more races householders$82,915 Hispanic or Latino race householdersMedian 2022 house value $551,754 White Non-Hispanic householders$548,715 Black or African American householders $479,830 Asian householders$509,883 Some other race householders$440,322 Two or more races householders$552,092 Hispanic or Latino householders
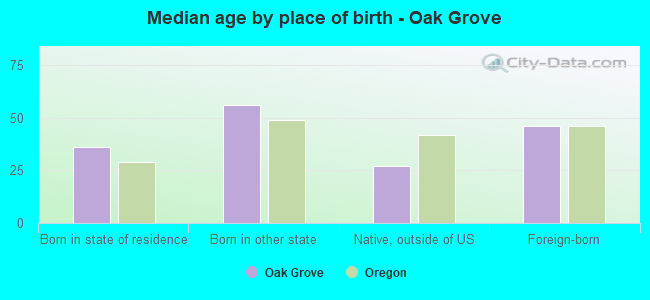
Median age by race in Oak Grove
46.0 Median age for White residents45.7 46.4 23.3 Median age for Black or African American residents40.6 14.6 54.4 Median age for American Indian / Alaska Native residents53.5 49.8 43.4 Median age for Asian residents31.0 44.0 38.1 Median age for Native Hawaiian / Pacific Islander residents38.6 9.9 30.8 Median age for Other race residents30.0 45.6 41.6 Median age for Two or more races residents43.8 42.1 46.8 Median age for White alone residents46.0 48.0 33.1 Median age for Hispanic or Latino residents28.4 40.1
Owner/renter occupied households by race in Oak Grove
House owners and renters - White residents 4,239 66.3% Owner occupied2,156 33.7% Renter occupiedHouse owners and renters - Black or African American residents 13 37.8% Owner occupied22 62.2% Renter occupiedHouse owners and renters - American Indian / Alaska Native residents 26 100.0% Owner occupiedHouse owners and renters - Asian residents 60 69.7% Owner occupied26 30.3% Renter occupiedHouse owners and renters - Native Hawaiian / Pacific Islander residents 19 100.0% Owner occupiedHouse owners and renters - Other race residents 76 34.7% Owner occupied143 65.3% Renter occupiedHouse owners and renters - Two or more races residents 383 63.2% Owner occupied223 36.8% Renter occupiedHouse owners and renters - White alone residents 4,176 68.2% Owner occupied1,951 31.8% Renter occupiedHouse owners and renters - Hispanic or Latino residents 229 34.8% Owner occupied430 65.2% Renter occupied
Language usage in Oak Grove
English speakers - Total 87.6% of residents of Oak Grove speak English at home.
5.3% of residents speak Spanish at home 423 47.3% Speak English very well472 52.7% Speak English less than very well7.1% of residents speak other language at home 644 53.9% Speak English very well551 46.1% Speak English less than very well
English speakers - Born in the United States 96.0% of residents of Oak Grove speak English at home.
1.2% of residents speak Spanish at home 80 100.0% Speak English very well2.5% of residents speak other language at home 167 100.0% Speak English very well
English speakers - Native, born elsewhere 52.0% of residents of Oak Grove speak English at home.
80.5% of residents speak other language at home 168 94.4% Speak English very well10 5.6% Speak English less than very well
English speakers - Foreign-born 19.2% of residents of Oak Grove speak English at home.
39.3% of residents speak Spanish at home 103 18.2% Speak English very well463 81.8% Speak English less than very well41.7% of residents speak other language at home 198 33.0% Speak English very well402 67.0% Speak English less than very well
White (Caucasian) - Speak only English Native:
95.1% (12,676)Foreign-born:
36.5% (165)
White (Caucasian) - Speak another language Native:
4.7% (621)Foreign-born:
60.6% (274)
Black or African American - Speak another language Native:
10.9% (24)Foreign-born:
99.4% (15)
American Indian / Alaska Native - Speak only English Native:
53.7% (55)Foreign-born:
86.0% (4)
Asian - Speak only English Native:
91.7% (171)Foreign-born:
18.0% (27)
Asian - Speak another language Native:
11.3% (21)Foreign-born:
80.3% (122)
Other race - Speak only English Native:
52.7% (132)Foreign-born:
4.0% (17)
Other race - Speak another language Native:
48.1% (121)Foreign-born:
87.3% (364)
Two or more races - Speak only English Native:
97.1% (1,009)Foreign-born:
17.7% (82)
Two or more races - Speak another language Native:
2.9% (30)Foreign-born:
75.6% (349)
White alone - Speak only English Native:
96.0% (12,186)Foreign-born:
43.8% (160)
White alone - Speak another language Native:
4.0% (506)Foreign-born:
56.1% (205)
Hispanic or Latino - Speak only English Native:
72.5% (808)Foreign-born:
11.9% (76)
Hispanic or Latino - Speak another language Native:
28.3% (316)Foreign-born:
78.9% (506)
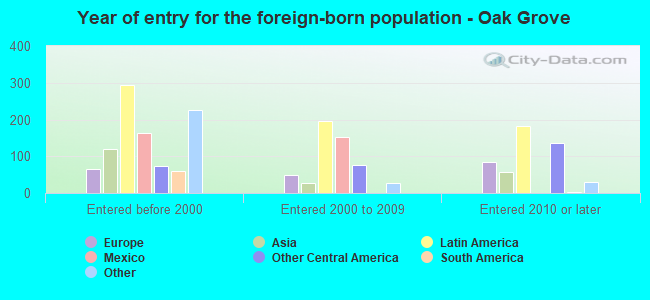
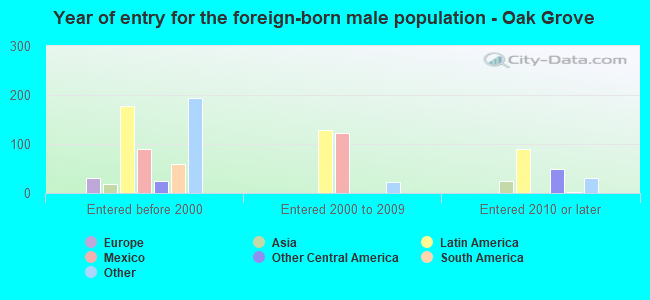
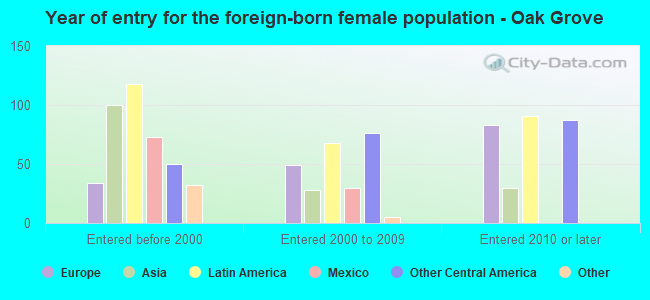
Foreign-born residents in Oak Grove 1,562 residents are foreign born (4.2% Latin America , 1.4% Europe , 1.3% Asia , 1.3% Africa ).
This city:
8.9%Oregon:
9.8%
Marital status for residents in Oak Grove Marital status - White (Caucasian) population 15 years and over
Males 35.2% Never married45.5% Now married1.6% Separated6.3% Widowed11.4% DivorcedFemales 28.6% Never married45.6% Now married1.8% Separated8.2% Widowed15.8% DivorcedWomen who gave birth in the past 12 months Now married:
69.4% (115)Unmarried:
30.6% (51)
Women who did not give birth in the past 12 months Now married:
41.5% (1,247)Unmarried:
58.5% (1,758)
Marital status - Black or African American population 15 years and over
Males 38.9% Never married44.2% Now married16.8% Separated0.0% Widowed0.0% DivorcedFemales 96.7% Never married0.0% Now married0.0% Separated3.3% Widowed0.0% DivorcedWomen who did not give birth in the past 12 months Now married:
0.0% (0)Unmarried:
100.0% (63)
Marital status - American Indian / Alaska Native population 15 years and over
Males 15.6% Never married62.3% Now married0.0% Separated0.0% Widowed22.1% DivorcedFemales 13.0% Never married17.4% Now married0.0% Separated0.0% Widowed69.6% DivorcedWomen who did not give birth in the past 12 months Now married:
0.0% (0)Unmarried:
100.0% (21)
Marital status - Asian population 15 years and over
Males 69.4% Never married30.6% Now married0.0% Separated0.0% Widowed0.0% DivorcedFemales 33.6% Never married57.6% Now married0.0% Separated0.0% Widowed8.8% DivorcedWomen who did not give birth in the past 12 months Now married:
54.9% (80)Unmarried:
45.1% (66)
Marital status - Native Hawaiian / Pacific Islander population 15 years and over
Males 46.0% Never married54.0% Now married0.0% Separated0.0% Widowed0.0% DivorcedFemales 0.0% Never married100.0% Now married0.0% Separated0.0% Widowed0.0% DivorcedWomen who did not give birth in the past 12 months Now married:
100.0% (25)Unmarried:
0.0% (0)
Marital status - Other race population 15 years and over
Males 54.5% Never married42.8% Now married2.7% Separated0.0% Widowed0.0% DivorcedFemales 38.4% Never married61.6% Now married0.0% Separated0.0% Widowed0.0% DivorcedWomen who did not give birth in the past 12 months Now married:
61.6% (206)Unmarried:
38.4% (128)
Marital status - Two or more races population 15 years and over
Males 39.8% Never married56.5% Now married0.0% Separated0.0% Widowed3.7% DivorcedFemales 55.4% Never married25.3% Now married3.9% Separated12.3% Widowed3.1% DivorcedWomen who did not give birth in the past 12 months Now married:
18.8% (62)Unmarried:
81.2% (267)
Marital status - White alone, not Hispanic / Latino population 15 years and over
Males 33.9% Never married46.1% Now married1.7% Separated6.5% Widowed11.8% DivorcedFemales 27.2% Never married47.0% Now married1.3% Separated8.8% Widowed15.8% DivorcedWomen who gave birth in the past 12 months Now married:
69.4% (117)Unmarried:
30.6% (52)
Women who did not give birth in the past 12 months Now married:
42.4% (1,162)Unmarried:
57.6% (1,577)
Marital status - Hispanic or Latino population 15 years and over
Males 58.2% Never married38.8% Now married0.0% Separated1.5% Widowed1.6% DivorcedFemales 41.2% Never married42.0% Now married7.9% Separated0.0% Widowed9.0% DivorcedWomen who did not give birth in the past 12 months Now married:
51.0% (299)Unmarried:
49.0% (288)
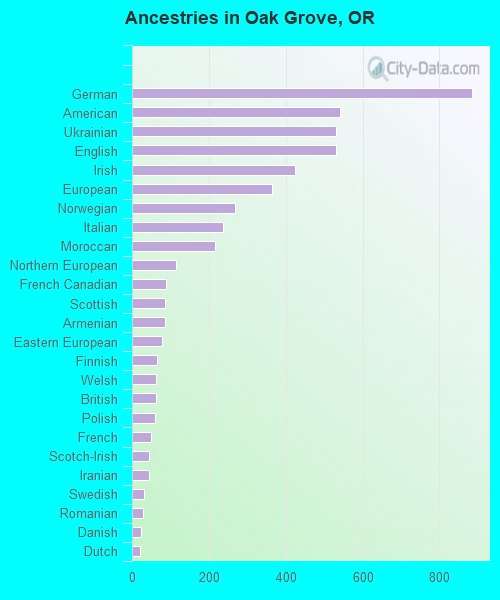
Ancestries in Oak Grove
885 11.3% German541 6.9% American530 6.7% Ukrainian530 6.7% English424 5.4% Irish365 4.6% European269 3.4% Norwegian236 3.0% Italian217 2.8% Moroccan115 1.5% Northern European88 1.1% French Canadian86 1.1% Scottish85 1.1% Armenian79 1.0% Eastern European64 0.8% Finnish63 0.8% Welsh62 0.8% British61 0.8% Polish49 0.6% French44 0.6% Scotch-Irish44 0.6% Iranian32 0.4% Swedish28 0.4% Romanian23 0.3% Danish21 0.3% Dutch17 0.2% Croatian13 0.2% Ethiopian11 0.1% Scandinavian9 0.1% Greek7 0.09% Lithuanian6 0.08% Luxembourger5 0.06% Belgian4 0.05% Egyptian3 0.04% Russian
Children Nativity (place of birth) in Oak Grove
Children under 6 years - Living with two parents Both parents native 496 100.0% NativeBoth parents foreign-born 134 100.0% NativeOne native, one foreign-born parent 118 100.0% NativeChildren under 6 years - Living with one parent Native parent 146 100.0% NativeChildren 6 to 17 years - Living with two parents Both parents native 1,076 100.0% NativeBoth parents foreign-born 118 100.0% NativeOne native, one foreign-born parent 266 100.0% NativeChildren 6 to 17 years - Living with one parent Native parent 345 88.9% Native43 11.1% Foreign-bornForeign-born parent 22 100.0% Native
Grandparents responsible for own grandchildren in Oak Grove
Grandparents (30 to 59 years) White / Caucasian 96 100.0% Responsible for grandchildrenWhite alone, not Hispanic / Latino 96 100.0% Responsible for grandchildren
Grandparents (60 years and over) White / Caucasian 176 100.0% Not responsible for grandchildrenWhite alone, not Hispanic / Latino 147 100.0% Not responsible for grandchildren