Races in Ontario, Oregon (OR) Detailed Stats
Data:
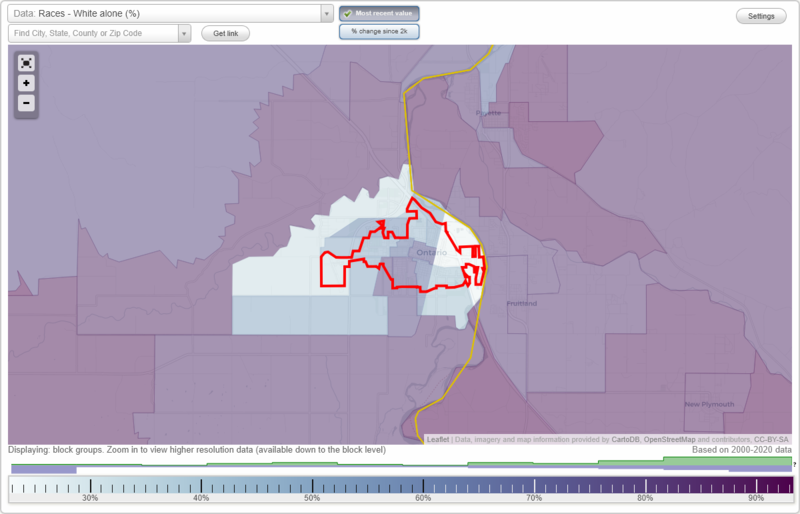
Races - White alone (%)
Races - White alone (% change since 2000)
Races - Black alone (%)
Races - Black alone (% change since 2000)
Races - American Indian alone (%)
Races - American Indian alone (% change since 2000)
Races - Asian alone (%)
Races - Asian alone (% change since 2000)
Races - Hispanic (%)
Races - Hispanic (% change since 2000)
Races - Native Hawaiian and Other Pacific Islander alone (%)
Races - Native Hawaiian and Other Pacific Islander alone (% change since 2000)
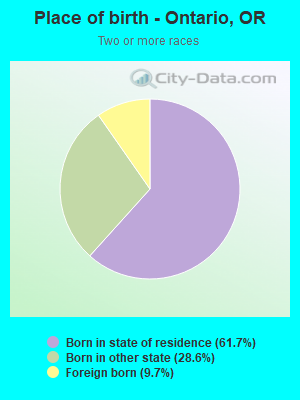
Races - Two or more races(%)
Races - Two or more races(% change since 2000)
Races - Other race alone (%)
Races - Other race alone (% change since 2000)
Racial diversity
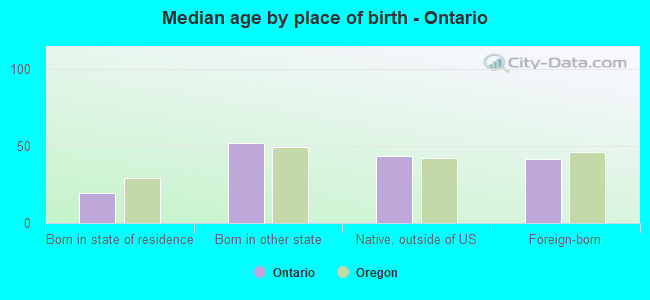
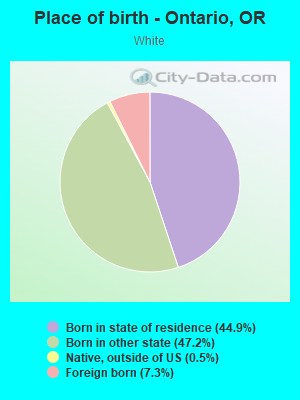
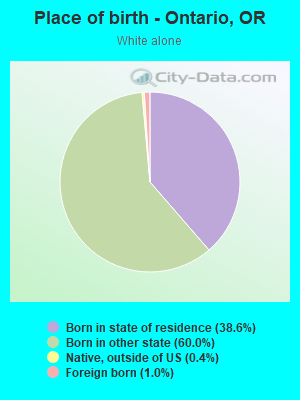
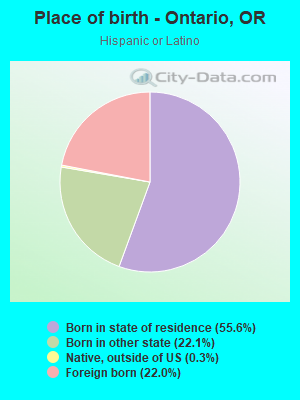
Place of birth - Born in state of residence (%)
Place of birth - Born in state of residence (%) - White
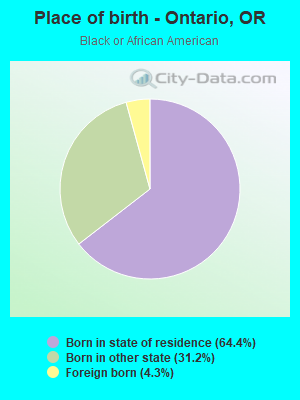
Place of birth - Born in state of residence (%) - Black or African American
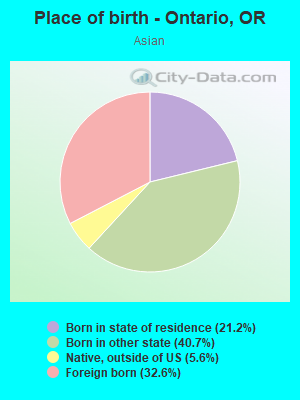
Place of birth - Born in state of residence (%) - Asian
Place of birth - Born in state of residence (%) - Hispanic or Latino
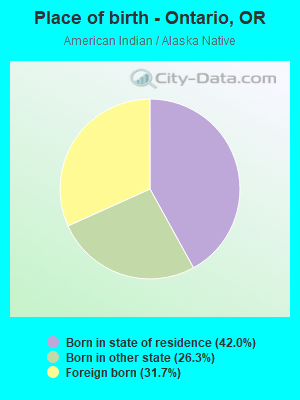
Place of birth - Born in state of residence (%) - American Indian and Alaska Native
Place of birth - Born in state of residence (%) - Multirace
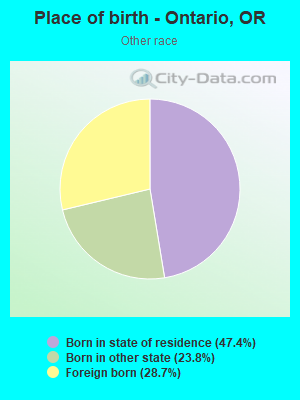
Place of birth - Born in state of residence (%) - Other Race
Place of birth - Born in other state (%)
Place of birth - Born in other state (%) - White
Place of birth - Born in other state (%) - Black or African American
Place of birth - Born in other state (%) - Asian
Place of birth - Born in other state (%) - Hispanic or Latino
Place of birth - Born in other state (%) - American Indian and Alaska Native
Place of birth - Born in other state (%) - Multirace
Place of birth - Born in other state (%) - Other Race
Place of birth - Native, outside of US (%)
Place of birth - Native, outside of US (%) - White
Place of birth - Native, outside of US (%) - Black or African American
Place of birth - Native, outside of US (%) - Asian
Place of birth - Native, outside of US (%) - Hispanic or Latino
Place of birth - Native, outside of US (%) - American Indian and Alaska Native
Place of birth - Native, outside of US (%) - Multirace
Place of birth - Native, outside of US (%) - Other Race
Place of birth - Foreign born (%)
Place of birth - Foreign born (%) - White
Place of birth - Foreign born (%) - Black or African American
Place of birth - Foreign born (%) - Asian
Place of birth - Foreign born (%) - Hispanic or Latino
Place of birth - Foreign born (%) - American Indian and Alaska Native
Place of birth - Foreign born (%) - Multirace
Place of birth - Foreign born (%) - Other Race
Residents speaking English at home (%)
Residents speaking English at home - Born in the United States (%)
Residents speaking English at home - Native, born elsewhere (%)
Residents speaking English at home - Foreign born (%)
Residents speaking Spanish at home (%)
Residents speaking Spanish at home - Born in the United States (%)
Residents speaking Spanish at home - Native, born elsewhere (%)
Residents speaking Spanish at home - Foreign born (%)
Residents speaking other language at home (%)
Residents speaking other language at home - Born in the United States (%)
Residents speaking other language at home - Native, born elsewhere (%)
Residents speaking other language at home - Foreign born (%)
Marital status - Never married (%)
Marital status - Now married (%)
Marital status - Separated (%)
Marital status - Widowed (%)
Marital status - Divorced (%)
Ancestries Reported - Arab (%)
Ancestries Reported - Czech (%)
Ancestries Reported - Danish (%)
Ancestries Reported - Dutch (%)
Ancestries Reported - English (%)
Ancestries Reported - French (%)
Ancestries Reported - French Canadian (%)
Ancestries Reported - German (%)
Ancestries Reported - Greek (%)
Ancestries Reported - Hungarian (%)
Ancestries Reported - Irish (%)
Ancestries Reported - Italian (%)
Ancestries Reported - Lithuanian (%)
Ancestries Reported - Norwegian (%)
Ancestries Reported - Polish (%)
Ancestries Reported - Portuguese (%)
Ancestries Reported - Russian (%)
Ancestries Reported - Scotch-Irish (%)
Ancestries Reported - Scottish (%)
Ancestries Reported - Slovak (%)
Ancestries Reported - Subsaharan African (%)
Ancestries Reported - Swedish (%)
Ancestries Reported - Swiss (%)
Ancestries Reported - Ukrainian (%)
Ancestries Reported - United States (%)
Ancestries Reported - Welsh (%)
Ancestries Reported - West Indian (%)
Ancestries Reported - Other (%)
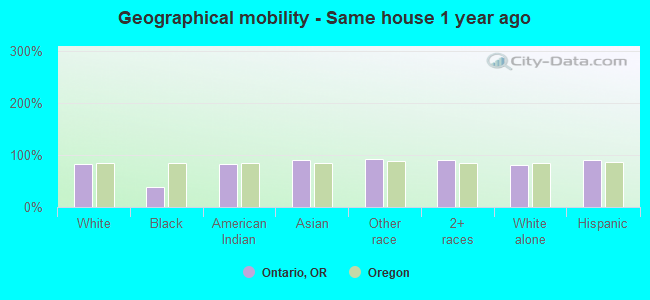
Geographical mobility - Same house 1 year ago (%)
Geographical mobility - Same house 1 year ago (%) - White
Geographical mobility - Same house 1 year ago (%) - Black or African American
Geographical mobility - Same house 1 year ago (%) - Asian
Geographical mobility - Same house 1 year ago (%) - Hispanic or Latino
Geographical mobility - Same house 1 year ago (%) - American Indian and Alaska Native
Geographical mobility - Same house 1 year ago (%) - Multirace
Geographical mobility - Same house 1 year ago (%) - Other Race
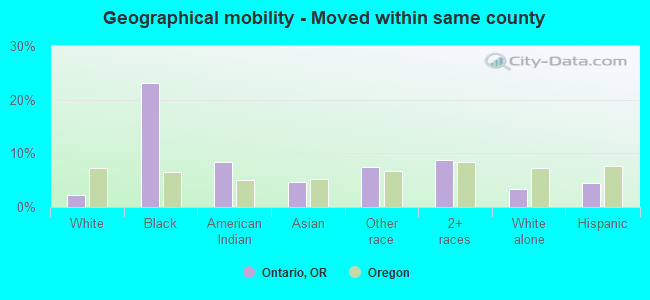
Geographical mobility - Moved within same county (%)
Geographical mobility - Moved within same county (%) - White
Geographical mobility - Moved within same county (%) - Black or African American
Geographical mobility - Moved within same county (%) - Asian
Geographical mobility - Moved within same county (%) - Hispanic or Latino
Geographical mobility - Moved within same county (%) - American Indian and Alaska Native
Geographical mobility - Moved within same county (%) - Multirace
Geographical mobility - Moved within same county (%) - Other Race
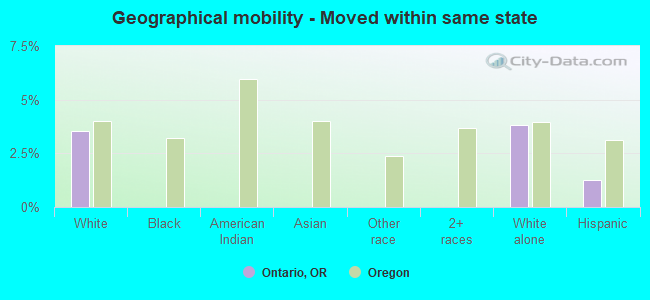
Geographical mobility - Moved from different county within same state (%)
Geographical mobility - Moved from different county within same state (%) - White
Geographical mobility - Moved from different county within same state (%) - Black or African American
Geographical mobility - Moved from different county within same state (%) - Asian
Geographical mobility - Moved from different county within same state (%) - Hispanic or Latino
Geographical mobility - Moved from different county within same state (%) - American Indian and Alaska Native
Geographical mobility - Moved from different county within same state (%) - Multirace
Geographical mobility - Moved from different county within same state (%) - Other Race
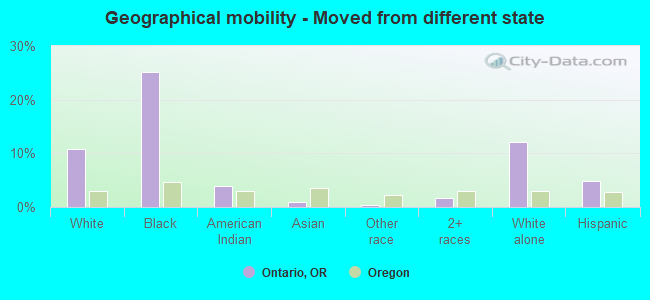
Geographical mobility - Moved from different state (%)
Geographical mobility - Moved from different state (%) - White
Geographical mobility - Moved from different state (%) - Black or African American
Geographical mobility - Moved from different state (%) - Asian
Geographical mobility - Moved from different state (%) - Hispanic or Latino
Geographical mobility - Moved from different state (%) - American Indian and Alaska Native
Geographical mobility - Moved from different state (%) - Multirace
Geographical mobility - Moved from different state (%) - Other Race
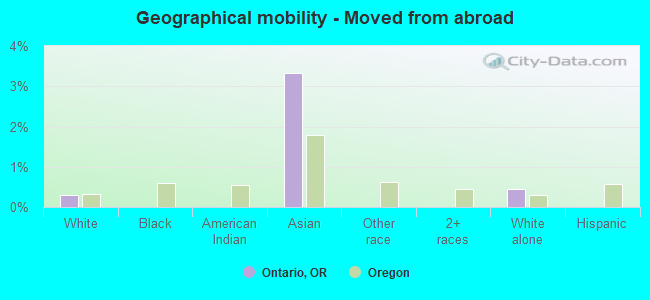
Geographical mobility - Moved from abroad (%)
Geographical mobility - Moved from abroad (%) - White
Geographical mobility - Moved from abroad (%) - Black or African American
Geographical mobility - Moved from abroad (%) - Asian
Geographical mobility - Moved from abroad (%) - Hispanic or Latino
Geographical mobility - Moved from abroad (%) - American Indian and Alaska Native
Geographical mobility - Moved from abroad (%) - Multirace
Geographical mobility - Moved from abroad (%) - Other Race
Place of birth for the foreign-born population - Ireland (%)
Place of birth for the foreign-born population - Denmark (%)
Place of birth for the foreign-born population - Norway (%)
Place of birth for the foreign-born population - Sweden (%)
Place of birth for the foreign-born population - United Kingdom (%)
Place of birth for the foreign-born population - England (%)
Place of birth for the foreign-born population - Scotland (%)
Place of birth for the foreign-born population - Other Northern Europe (%)
Place of birth for the foreign-born population - Austria (%)
Place of birth for the foreign-born population - Belgium (%)
Place of birth for the foreign-born population - France (%)
Place of birth for the foreign-born population - Germany (%)
Place of birth for the foreign-born population - Netherlands (%)
Place of birth for the foreign-born population - Switzerland (%)
Place of birth for the foreign-born population - Other Western Europe (%)
Place of birth for the foreign-born population - Greece (%)
Place of birth for the foreign-born population - Italy (%)
Place of birth for the foreign-born population - Portugal (%)
Place of birth for the foreign-born population - Spain (%)
Place of birth for the foreign-born population - Other Southern Europe (%)
Place of birth for the foreign-born population - Albania (%)
Place of birth for the foreign-born population - Belarus (%)
Place of birth for the foreign-born population - Bosnia and Herzegovina (%)
Place of birth for the foreign-born population - Bulgaria (%)
Place of birth for the foreign-born population - Croatia (%)
Place of birth for the foreign-born population - Czechoslovakia (%)
Place of birth for the foreign-born population - Hungary (%)
Place of birth for the foreign-born population - Latvia (%)
Place of birth for the foreign-born population - Lithuania (%)
Place of birth for the foreign-born population - North Macedonia (Macedonia) (%)
Place of birth for the foreign-born population - Moldova (%)
Place of birth for the foreign-born population - Poland (%)
Place of birth for the foreign-born population - Romania (%)
Place of birth for the foreign-born population - Russia (%)
Place of birth for the foreign-born population - Serbia (%)
Place of birth for the foreign-born population - Ukraine (%)
Place of birth for the foreign-born population - Other Eastern Europe (%)
Place of birth for the foreign-born population - China (%)
Place of birth for the foreign-born population - Hong Kong (%)
Place of birth for the foreign-born population - Taiwan (%)
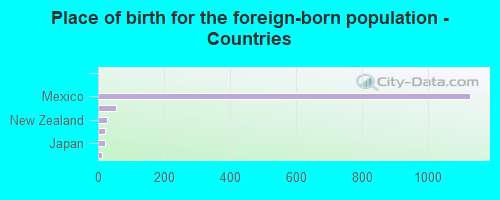
Place of birth for the foreign-born population - Japan (%)
Place of birth for the foreign-born population - Korea (%)
Place of birth for the foreign-born population - Other Eastern Asia (%)
Place of birth for the foreign-born population - Afghanistan (%)
Place of birth for the foreign-born population - Bangladesh (%)
Place of birth for the foreign-born population - India (%)
Place of birth for the foreign-born population - Iran (%)
Place of birth for the foreign-born population - Kazakhstan (%)
Place of birth for the foreign-born population - Nepal (%)
Place of birth for the foreign-born population - Pakistan (%)
Place of birth for the foreign-born population - Sri Lanka (%)
Place of birth for the foreign-born population - Uzbekistan (%)
Place of birth for the foreign-born population - Other South Central Asia (%)
Place of birth for the foreign-born population - Burma (%)
Place of birth for the foreign-born population - Cambodia (%)
Place of birth for the foreign-born population - Indonesia (%)
Place of birth for the foreign-born population - Laos (%)
Place of birth for the foreign-born population - Malaysia (%)
Place of birth for the foreign-born population - Philippines (%)
Place of birth for the foreign-born population - Singapore (%)
Place of birth for the foreign-born population - Thailand (%)
Place of birth for the foreign-born population - Vietnam (%)
Place of birth for the foreign-born population - Other South Eastern Asia (%)
Place of birth for the foreign-born population - Armenia (%)
Place of birth for the foreign-born population - Iraq (%)
Place of birth for the foreign-born population - Israel (%)
Place of birth for the foreign-born population - Jordan (%)
Place of birth for the foreign-born population - Kuwait (%)
Place of birth for the foreign-born population - Lebanon (%)
Place of birth for the foreign-born population - Saudi Arabia (%)
Place of birth for the foreign-born population - Syria (%)
Place of birth for the foreign-born population - Turkey (%)
Place of birth for the foreign-born population - Yemen (%)
Place of birth for the foreign-born population - Other Western Asia (%)
Place of birth for the foreign-born population - Eritrea (%)
Place of birth for the foreign-born population - Ethiopia (%)
Place of birth for the foreign-born population - Kenya (%)
Place of birth for the foreign-born population - Somalia (%)
Place of birth for the foreign-born population - Uganda (%)
Place of birth for the foreign-born population - Zimbabwe (%)
Place of birth for the foreign-born population - Other Eastern Africa (%)
Place of birth for the foreign-born population - Cameroon (%)
Place of birth for the foreign-born population - Congo (%)
Place of birth for the foreign-born population - Democratic Republic of Congo (Zaire) (%)
Place of birth for the foreign-born population - Other Middle Africa (%)
Place of birth for the foreign-born population - Egypt (%)
Place of birth for the foreign-born population - Morocco (%)
Place of birth for the foreign-born population - Sudan (%)
Place of birth for the foreign-born population - Other Northern Africa (%)
Place of birth for the foreign-born population - South Africa (%)
Place of birth for the foreign-born population - Other Southern Africa (%)
Place of birth for the foreign-born population - Cabo Verde (%)
Place of birth for the foreign-born population - Ghana (%)
Place of birth for the foreign-born population - Liberia (%)
Place of birth for the foreign-born population - Nigeria (%)
Place of birth for the foreign-born population - Senegal (%)
Place of birth for the foreign-born population - Sierra Leone (%)
Place of birth for the foreign-born population - Other Western Africa (%)
Place of birth for the foreign-born population - Australia (%)
Place of birth for the foreign-born population - New Zealand (%)
Place of birth for the foreign-born population - Fiji (%)
Place of birth for the foreign-born population - Micronesia (%)
Place of birth for the foreign-born population - Bahamas (%)
Place of birth for the foreign-born population - Barbados (%)
Place of birth for the foreign-born population - Cuba (%)
Place of birth for the foreign-born population - Dominica (%)
Place of birth for the foreign-born population - Dominican Republic (%)
Place of birth for the foreign-born population - Grenada (%)
Place of birth for the foreign-born population - Haiti (%)
Place of birth for the foreign-born population - Jamaica (%)
Place of birth for the foreign-born population - St. Vincent and the Grenadines (%)
Place of birth for the foreign-born population - Trinidad and Tobago (%)
Place of birth for the foreign-born population - West Indies (%)
Place of birth for the foreign-born population - Other Caribbean (%)
Place of birth for the foreign-born population - Belize (%)
Place of birth for the foreign-born population - Costa Rica (%)
Place of birth for the foreign-born population - El Salvador (%)
Place of birth for the foreign-born population - Guatemala (%)
Place of birth for the foreign-born population - Honduras (%)
Place of birth for the foreign-born population - Mexico (%)
Place of birth for the foreign-born population - Nicaragua (%)
Place of birth for the foreign-born population - Panama (%)
Place of birth for the foreign-born population - Other Central America (%)
Place of birth for the foreign-born population - Argentina (%)
Place of birth for the foreign-born population - Bolivia (%)
Place of birth for the foreign-born population - Brazil (%)
Place of birth for the foreign-born population - Chile (%)
Place of birth for the foreign-born population - Colombia (%)
Place of birth for the foreign-born population - Ecuador (%)
Place of birth for the foreign-born population - Guyana (%)
Place of birth for the foreign-born population - Peru (%)
Place of birth for the foreign-born population - Uruguay (%)
Place of birth for the foreign-born population - Venezuela (%)
Place of birth for the foreign-born population - Other South America (%)
Place of birth for the foreign-born population - Canada (%)
Place of birth for the foreign-born population - Other Northern America (%)
Place of birth for the foreign-born population - Other (%)
Latest news about races in Ontario, OR collected exclusively by city-data.com from local newspapers, TV, and radio stations
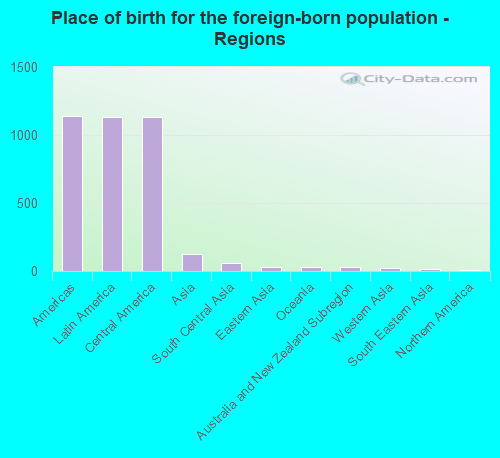
According to 2022 data, the most numerous races in Ontario, OR are White alone (5,630 residents), Hispanic (5,691 residents), and Two or more races (205 residents). 66.6% of Ontario residents speak English at home. 11.1% of Ontario, OR residents are foreign-born (9.5% born in Latin America), which is 18.9% greater than the foreign-born rate of 9.0% across the entire state of Oregon.
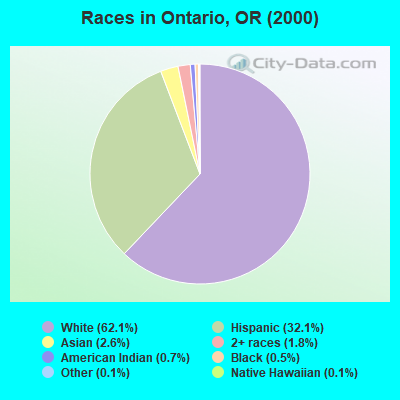
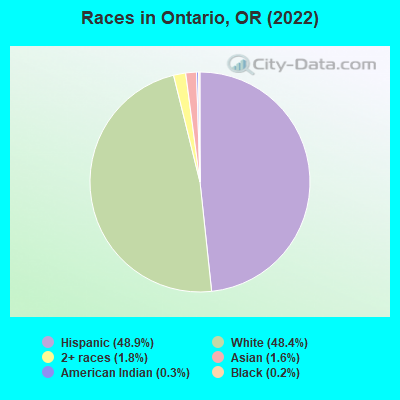
Race distribution in Ontario
2000 2022
2,857,616 83.5% White alone 275,314 8.0% Hispanic 100,333 2.9% Asian alone 82,733 2.4% Two or more races 53,325 1.6% Black alone 40,130 1.2% American Indian alone 7,398 0.2% Native Hawaiian and Other 4,550 0.1% Other race alone
3,037,571 71.6% White alone 609,538 14.4% Hispanic 252,744 6.0% Two or more races 191,283 4.5% Asian alone 78,228 1.8% Black alone 29,399 0.7% American Indian alone 25,731 0.6% Other race alone 15,643 0.4% Native Hawaiian and Other
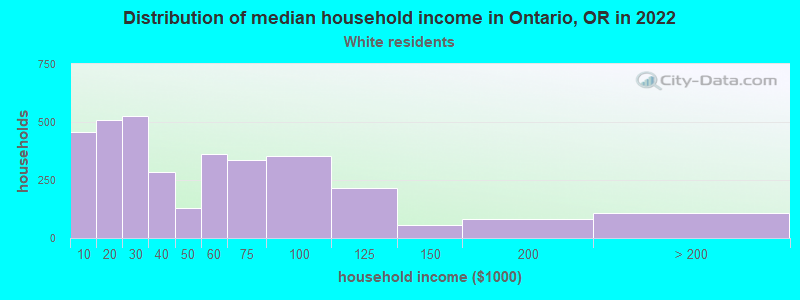
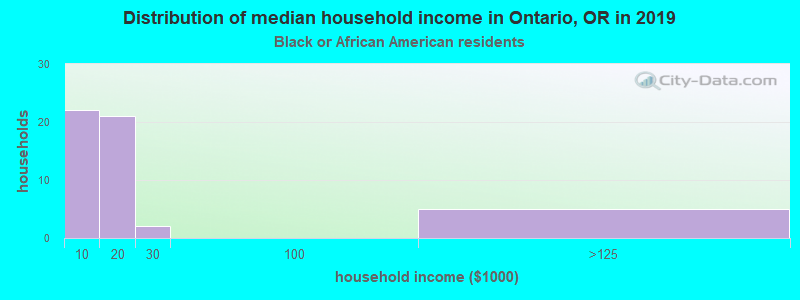
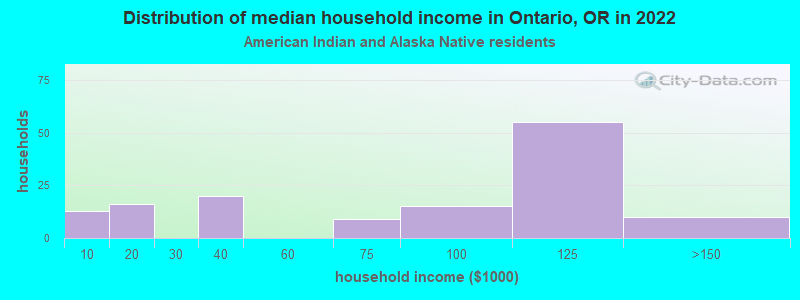
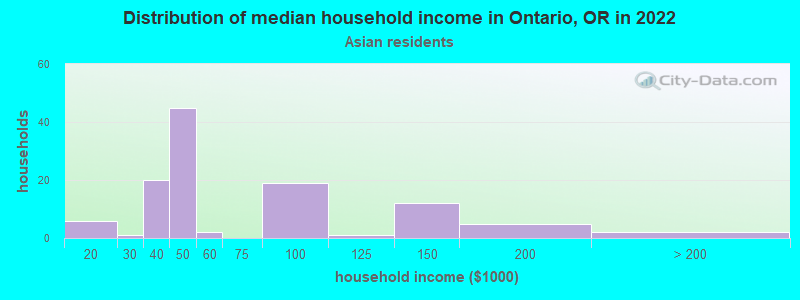
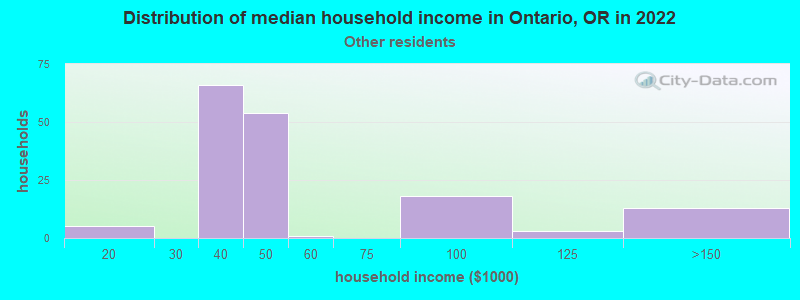
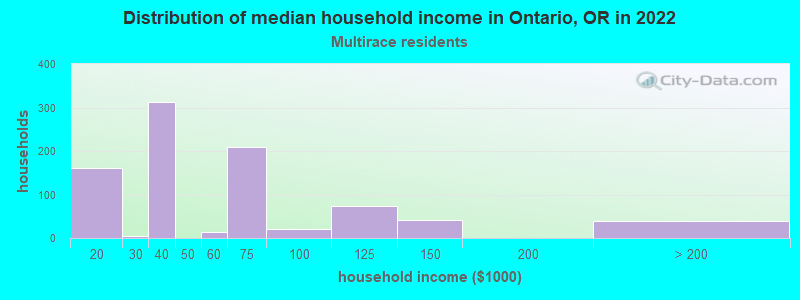
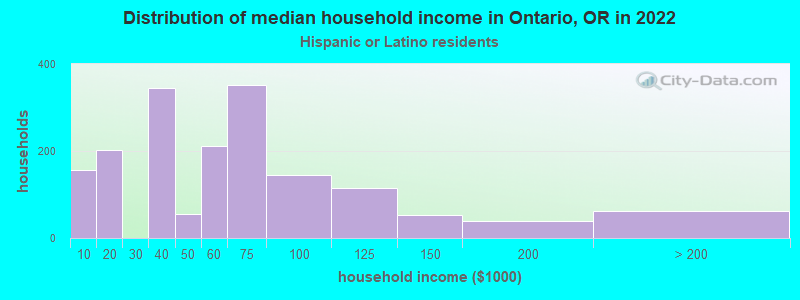
Income and house value in Ontario Median household income in 2022 $32,941 White non-Hispanic householders$81,198 American Indian and Alaska Native householders$43,309 Asian householders$40,068 Some other race householders$54,307 Hispanic or Latino race householdersMedian 2022 house value $220,176 White Non-Hispanic householders$201,637 Black or African American householders $228,873 Asian householders$167,535 Some other race householders$226,126 Two or more races householders$172,112 Hispanic or Latino householders
Median age by race in Ontario
39.9 Median age for White residents36.7 43.4 24.5 Median age for Black or African American residents25.4 -625,514,402.7 35.9 Median age for American Indian / Alaska Native residents17.4 40.1 66.9 Median age for Asian residents67.2 65.7 -764,705,881.6 Median age for Native Hawaiian / Pacific Islander residents-764,119,600.6 -774,891,774.1 28.9 Median age for Other race residents23.6 30.4 25.9 Median age for Two or more races residents30.4 25.3 52.4 Median age for White alone residents48.3 58.9 24.6 Median age for Hispanic or Latino residents23.2 25.6
Owner/renter occupied households by race in Ontario
House owners and renters - White residents 1,805 53.7% Owner occupied1,557 46.3% Renter occupiedHouse owners and renters - Black or African American residents 6 100.0% Renter occupiedHouse owners and renters - American Indian / Alaska Native residents 85 77.1% Owner occupied25 22.9% Renter occupiedHouse owners and renters - Asian residents 64 60.1% Owner occupied43 39.9% Renter occupiedHouse owners and renters - Other race residents 51 31.1% Owner occupied114 68.9% Renter occupiedHouse owners and renters - Two or more races residents 417 47.1% Owner occupied467 52.9% Renter occupiedHouse owners and renters - White alone residents 1,538 57.3% Owner occupied1,144 42.7% Renter occupiedHouse owners and renters - Hispanic or Latino residents 723 41.7% Owner occupied1,008 58.3% Renter occupied
Language usage in Ontario
English speakers - Total 66.6% of residents of Ontario speak English at home.
32.5% of residents speak Spanish at home 2,498 70.3% Speak English very well1,054 29.7% Speak English less than very well1.1% of residents speak other language at home 76 61.8% Speak English very well47 38.2% Speak English less than very well
English speakers - Born in the United States 87.2% of residents of Ontario speak English at home.
12.6% of residents speak Spanish at home 593 99.0% Speak English very well6 1.0% Speak English less than very well0.6% of residents speak other language at home 10 37.0% Speak English very well17 63.0% Speak English less than very well
English speakers - Native, born elsewhere 56.9% of residents of Ontario speak English at home.
24.1% of residents speak Spanish at home 14 100.0% Speak English very well5.2% of residents speak other language at home 3 100.0% Speak English very well
English speakers - Foreign-born 6.4% of residents of Ontario speak English at home.
91.5% of residents speak Spanish at home 440 37.2% Speak English very well744 62.8% Speak English less than very well5.7% of residents speak other language at home 44 59.5% Speak English very well30 40.5% Speak English less than very well
White (Caucasian) - Speak only English Native:
85.0% (5,943)Foreign-born:
10.7% (63)
White (Caucasian) - Speak another language Native:
12.3% (861)Foreign-born:
79.8% (471)
American Indian / Alaska Native - Speak another language Native:
43.2% (116)Foreign-born:
100.0% (132)
Asian - Speak only English Native:
83.4% (111)Foreign-born:
14.7% (10)
Asian - Speak another language Native:
17.5% (23)Foreign-born:
85.1% (56)
Other race - Speak only English Native:
20.0% (101)Foreign-born:
2.6% (5)
Other race - Speak another language Native:
76.6% (387)Foreign-born:
97.5% (197)
Two or more races - Speak another language Native:
57.5% (1,129)Foreign-born:
100.0% (237)
White alone - Speak only English Native:
97.7% (5,302)Foreign-born:
65.1% (37)
White alone - Speak another language Native:
2.3% (126)Foreign-born:
35.6% (20)
Hispanic or Latino - Speak only English Native:
40.7% (1,589)Foreign-born:
4.0% (50)
Hispanic or Latino - Speak another language Native:
58.1% (2,270)Foreign-born:
95.7% (1,183)
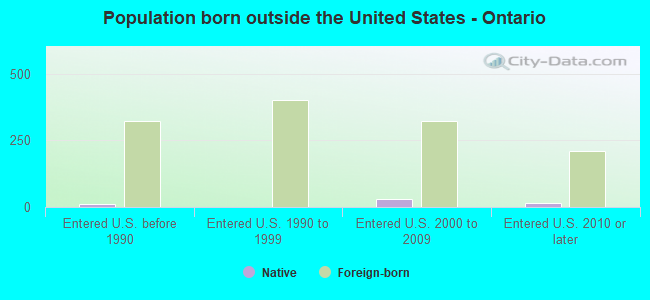
Foreign-born residents in Ontario 1,291 residents are foreign born (9.5% Latin America ).
This city:
11.1%Oregon:
9.8%
Marital status for residents in Ontario Marital status - White (Caucasian) population 15 years and over
Males 34.2% Never married40.5% Now married0.5% Separated8.9% Widowed15.8% DivorcedFemales 25.5% Never married41.0% Now married1.3% Separated16.3% Widowed16.0% DivorcedWomen who gave birth in the past 12 months Now married:
100.0% (138)Unmarried:
0.0% (0)
Women who did not give birth in the past 12 months Now married:
33.1% (461)Unmarried:
66.9% (933)
Marital status - Black or African American population 15 years and over
Males 94.4% Never married0.0% Now married0.0% Separated5.6% Widowed0.0% DivorcedFemales 0.0% Never married100.0% Now married0.0% Separated0.0% Widowed0.0% DivorcedMarital status - American Indian / Alaska Native population 15 years and over
Males 55.3% Never married29.3% Now married0.0% Separated9.3% Widowed6.0% DivorcedFemales 38.5% Never married36.0% Now married0.0% Separated11.8% Widowed13.7% DivorcedWomen who did not give birth in the past 12 months Now married:
37.3% (51)Unmarried:
62.7% (86)
Marital status - Asian population 15 years and over
Males 23.8% Never married38.1% Now married10.7% Separated0.0% Widowed27.4% DivorcedFemales 21.6% Never married35.3% Now married0.0% Separated34.3% Widowed8.8% DivorcedWomen who did not give birth in the past 12 months Now married:
29.0% (9)Unmarried:
71.0% (23)
Marital status - Other race population 15 years and over
Males 48.1% Never married17.1% Now married2.4% Separated0.0% Widowed32.4% DivorcedFemales 48.9% Never married32.1% Now married10.9% Separated0.5% Widowed7.7% DivorcedWomen who gave birth in the past 12 months Now married:
0.0% (0)Unmarried:
100.0% (11)
Women who did not give birth in the past 12 months Now married:
34.7% (79)Unmarried:
65.3% (149)
Marital status - Two or more races population 15 years and over
Males 48.9% Never married40.1% Now married3.3% Separated7.2% Widowed0.6% DivorcedFemales 44.4% Never married24.3% Now married17.5% Separated1.7% Widowed12.1% DivorcedWomen who gave birth in the past 12 months Now married:
100.0% (53)Unmarried:
0.0% (0)
Women who did not give birth in the past 12 months Now married:
17.6% (87)Unmarried:
82.4% (405)
Marital status - White alone, not Hispanic / Latino population 15 years and over
Males 32.8% Never married38.8% Now married0.7% Separated12.2% Widowed15.5% DivorcedFemales 23.2% Never married37.4% Now married0.4% Separated20.0% Widowed18.9% DivorcedWomen who gave birth in the past 12 months Now married:
100.0% (58)Unmarried:
0.0% (0)
Women who did not give birth in the past 12 months Now married:
28.1% (249)Unmarried:
71.9% (636)
Marital status - Hispanic or Latino population 15 years and over
Males 43.8% Never married39.1% Now married0.8% Separated2.9% Widowed13.4% DivorcedFemales 39.4% Never married39.0% Now married9.3% Separated3.0% Widowed9.3% DivorcedWomen who gave birth in the past 12 months Now married:
94.2% (136)Unmarried:
5.8% (8)
Women who did not give birth in the past 12 months Now married:
31.6% (406)Unmarried:
68.4% (880)
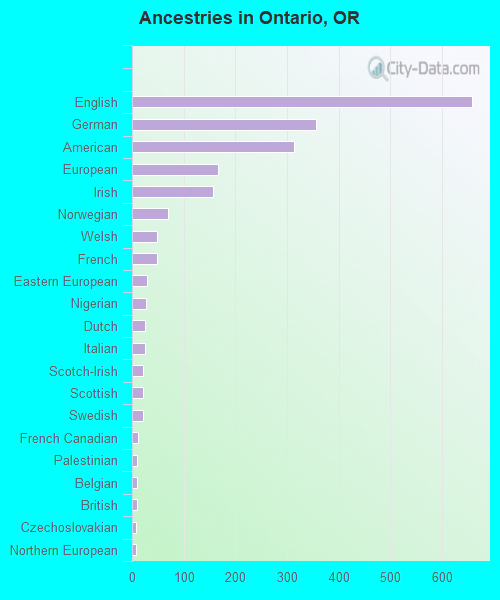
Ancestries in Ontario
658 10.4% English356 5.7% German313 5.0% American167 2.7% European157 2.5% Irish70 1.1% Norwegian49 0.8% Welsh48 0.8% French29 0.5% Eastern European27 0.4% Nigerian26 0.4% Dutch25 0.4% Italian22 0.3% Scotch-Irish21 0.3% Scottish21 0.3% Swedish12 0.2% French Canadian10 0.2% Palestinian9 0.1% Belgian9 0.1% British8 0.1% Czechoslovakian8 0.1% Northern European5 0.08% Polish5 0.08% Portuguese
Children Nativity (place of birth) in Ontario
Children under 6 years - Living with two parents Both parents native 363 100.0% NativeBoth parents foreign-born 186 100.0% NativeOne native, one foreign-born parent 86 100.0% NativeChildren under 6 years - Living with one parent Native parent 187 100.0% NativeForeign-born parent 29 100.0% NativeChildren 6 to 17 years - Living with two parents Both parents native 509 100.0% NativeBoth parents foreign-born 485 98.5% Native7 1.5% Foreign-bornOne native, one foreign-born parent 53 100.0% NativeChildren 6 to 17 years - Living with one parent Native parent 739 100.0% NativeForeign-born parent 168 50.1% Native167 49.9% Foreign-born
Grandparents responsible for own grandchildren in Ontario
Grandparents (30 to 59 years) White / Caucasian 22 100.0% Not responsible for grandchildrenOther race 75 100.0% Not responsible for grandchildrenTwo or more races 106 100.0% Responsible for grandchildrenWhite alone, not Hispanic / Latino 6 100.0% Not responsible for grandchildrenHispanic or Latino 95 57.6% Responsible for grandchildren70 42.4% Not responsible for grandchildrenGrandparents (60 years and over) White / Caucasian 25 74.8% Responsible for grandchildren8 25.2% Not responsible for grandchildrenTwo or more races 16 100.0% Not responsible for grandchildrenWhite alone, not Hispanic / Latino 26 74.6% Responsible for grandchildren9 25.4% Not responsible for grandchildrenHispanic or Latino 31 100.0% Not responsible for grandchildren