Races in Opal Cliffs, California (CA) Detailed Stats
Ancestries, Foreign-born residents, place of birth

Recent posts about races in Opal Cliffs, California on our local forum with over 2,400,000 registered users:
 | Where's my dream California city? (27 replies) |
7.9% of Opal Cliffs, CA residents are foreign-born (5.3% born in Latin America, 1.7% born in Europe), which is 227.3% less than the foreign-born rate of 26.0% across the entire state of California.
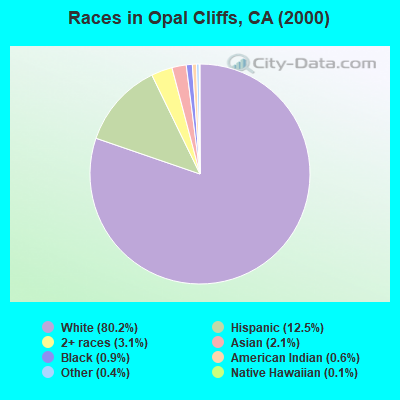
Race distribution in Opal Cliffs

- 5,17780.2%White alone
- 80812.5%Hispanic
- 2003.1%Two or more races
- 1382.1%Asian alone
- 590.9%Black alone
- 400.6%American Indian alone
- 270.4%Other race alone
- 90.1%Native Hawaiian and Other
Pacific Islander alone
2000
2022
-
- 15,816,79046.7%White alone
- 10,966,55632.4%Hispanic
- 3,648,86010.8%Asian alone
- 2,181,9266.4%Black alone
- 903,1152.7%Two or more races
- 178,9840.5%American Indian alone
- 103,7360.3%Native Hawaiian and Other
Pacific Islander alone - 71,6810.2%Other race alone

-
- 15,732,18440.3%Hispanic
- 13,160,42633.7%White alone
- 5,957,86715.3%Asian alone
- 2,025,2185.2%Black alone
- 1,663,2224.3%Two or more races
- 251,6180.6%Other race alone
- 135,7770.3%Native Hawaiian and Other
Pacific Islander alone - 103,0300.3%American Indian alone

Income and house value in Opal Cliffs
- Median household income in 2022
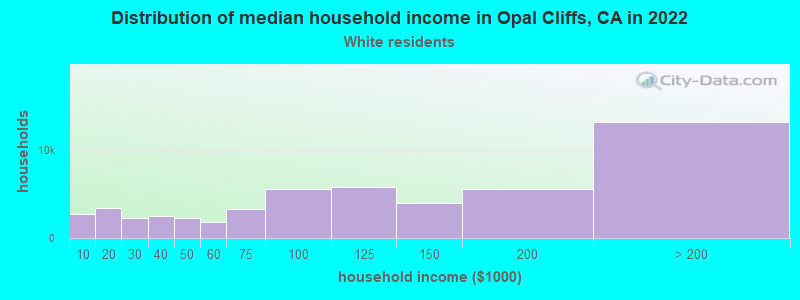
- $87,099White non-Hispanic householders
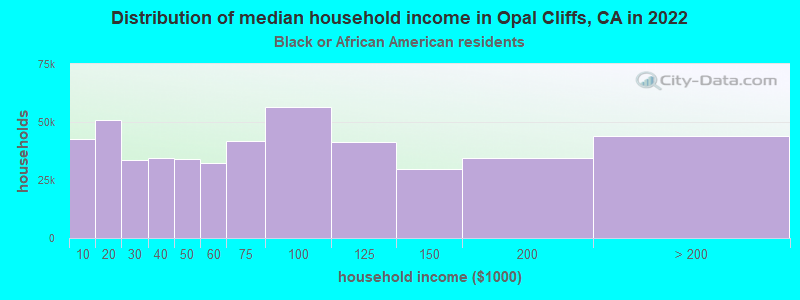
- $73,880Black householders
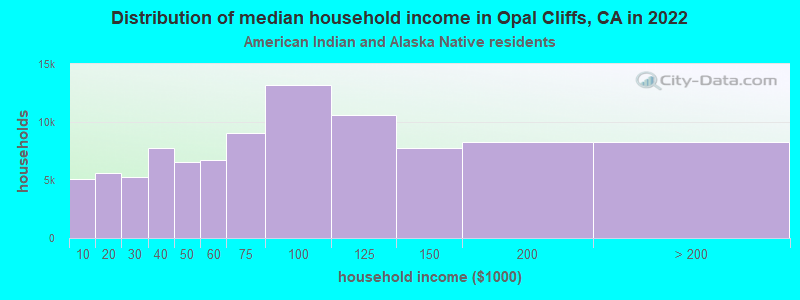
- $90,890American Indian and Alaska Native householders
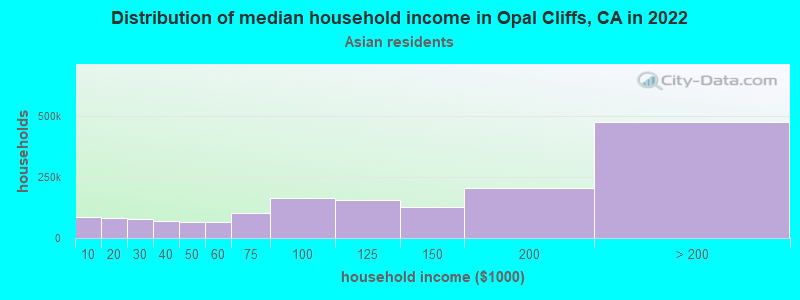
- $194,892Asian householders
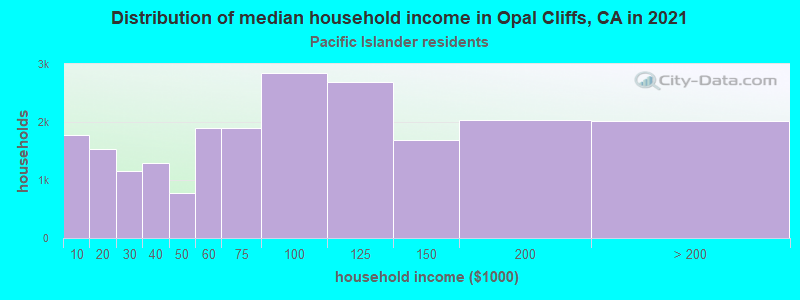
- $46,935Native Hawaiian and other Pacific Islander householders
- $78,068Some other race householders
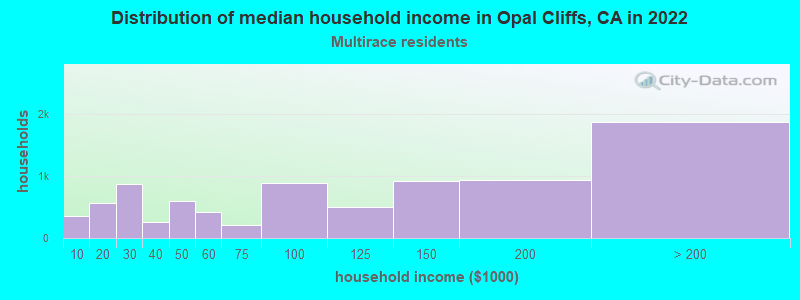
- $69,008Two or more races householders
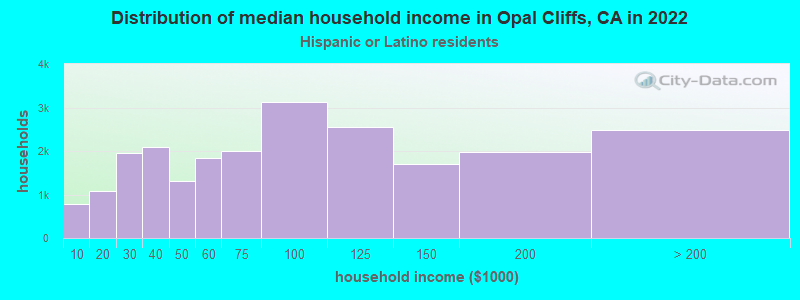
- $84,813Hispanic or Latino race householders
- Median 2022 house value
- over $1,000,000White Non-Hispanic householders
- over $1,000,000Black or African American householders
- over $1,000,000Asian householders
- over $1,000,000Some other race householders
- over $1,000,000Two or more races householders
- over $1,000,000Hispanic or Latino householders
Household income for White non-Hispanic householders
Household income for Black householders
Household income for American Indian and Alaska Native householders
Household income for Asian householders
Household income for Native Hawaiian and other Pacific Islander householders
Household income for Two or more races householders
Household income for Hispanic or Latino race householders
Foreign-born residents in Opal Cliffs
513 residents are foreign born (5.3% Latin America, 1.7% Europe).
| This city: | 7.9% |
| California: | 26.2% |
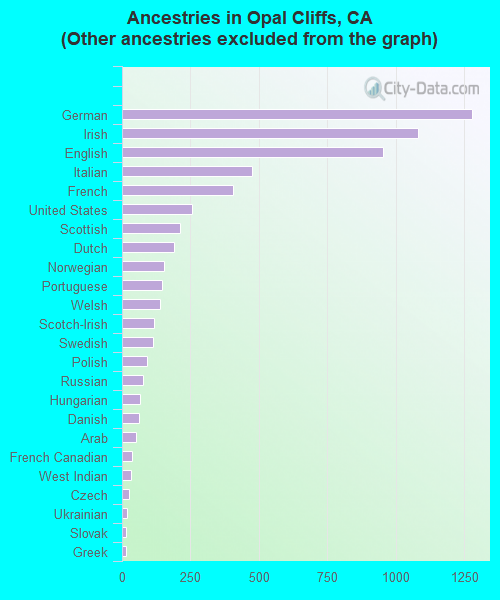
Ancestries in Opal Cliffs

- 1,86323.6%Other
- 1,27616.2%German
- 1,08013.7%Irish
- 95312.1%English
- 4766.0%Italian
- 4065.1%French
- 2573.3%United States
- 2112.7%Scottish
- 1912.4%Dutch
- 1552.0%Norwegian
- 1451.8%Portuguese
- 1371.7%Welsh
- 1171.5%Scotch-Irish
- 1131.4%Swedish
- 931.2%Polish
- 781.0%Russian
- 650.8%Hungarian
- 620.8%Danish
- 500.6%Arab
- 370.5%French Canadian
- 330.4%West Indian
- 250.3%Czech
- 190.2%Ukrainian
- 160.2%Slovak
- 150.2%Greek
- 80.1%Lithuanian
- 80.1%Swiss
Zip codes: 95062.