Races in Orford, New Hampshire (NH) Detailed Stats
Ancestries, Foreign-born residents, place of birth

Recent posts about races in Orford, New Hampshire on our local forum with over 2,400,000 registered users:
 | Relocation suggestions (30 replies) |
| Some ideas for relocation? (18 replies) |
| relocating to lebanon/hanover area (5 replies) |
| Finally received offer/start date at DHMC. Do I have enough time to find a place? (9 replies) |
| Upper Lakes Region? (7 replies) |
| I Want To Live In A Barn In Hanover (30 replies) |
2.5% of Orford, NH residents are foreign-born (0.7% born in Asia, 0.7% born in Africa, 0.5% born in Europe, 0.3% born in North America), which is 102.0% less than the foreign-born rate of 5.0% across the entire state of New Hampshire.
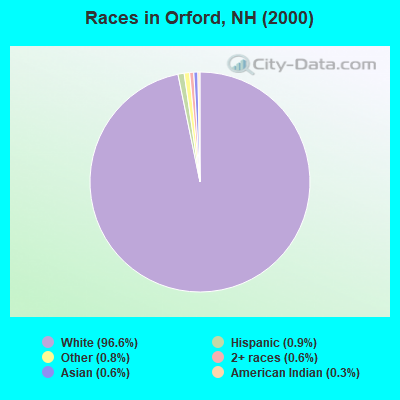
Race distribution in Orford

- 1,05496.6%White alone
- 100.9%Hispanic
- 90.8%Other race alone
- 70.6%Two or more races
- 70.6%Asian alone
- 30.3%American Indian alone
- 10.09%Black alone
2000
2022
-
- 1,175,25295.1%White alone
- 20,4891.7%Hispanic
- 15,8031.3%Asian alone
- 11,6060.9%Two or more races
- 8,3540.7%Black alone
- 2,6980.2%American Indian alone
- 1,2540.1%Other race alone
- 3300.03%Native Hawaiian and Other
Pacific Islander alone

-
- 1,208,10186.6%White alone
- 63,4794.5%Hispanic
- 60,7244.4%Two or more races
- 36,5192.6%Asian alone
- 17,9311.3%Black alone
- 6,6150.5%Other race alone
- 1,0140.07%American Indian alone
- 8480.06%Native Hawaiian and Other
Pacific Islander alone

Income and house value in Orford
- Median household income in 2022
- $89,585White non-Hispanic householders
- $167,841Asian householders
- over $200,000Two or more races householders
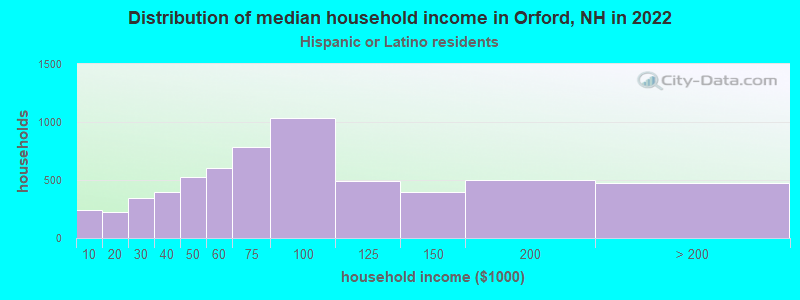
- $36,173Hispanic or Latino race householders
- Median 2022 house value
- $348,069White Non-Hispanic householders
- $359,575Asian householders
- $359,575Some other race householders
- $303,641Two or more races householders
- $359,575Hispanic or Latino householders
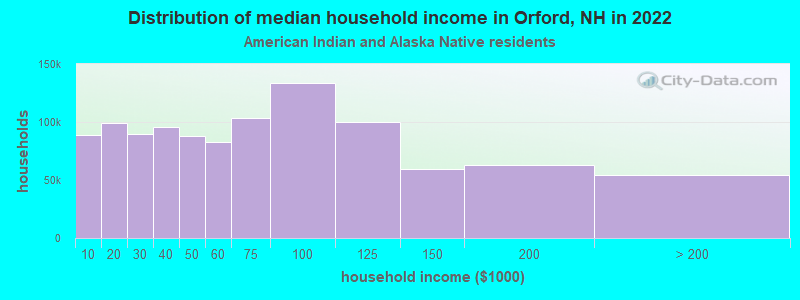
Household income for White non-Hispanic householders
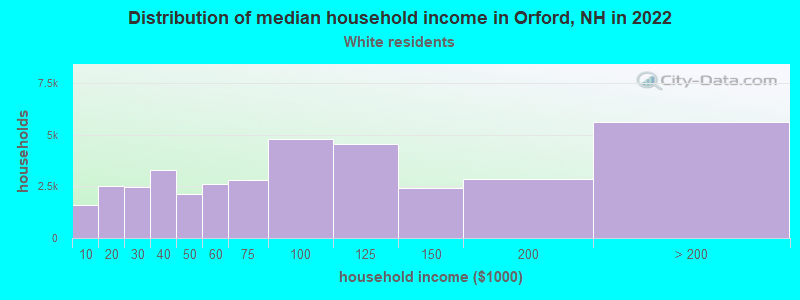
Household income for American Indian and Alaska Native householders
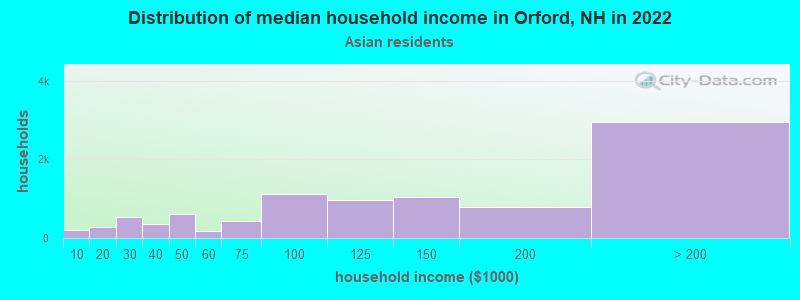
Household income for Asian householders
Household income for Two or more races householders
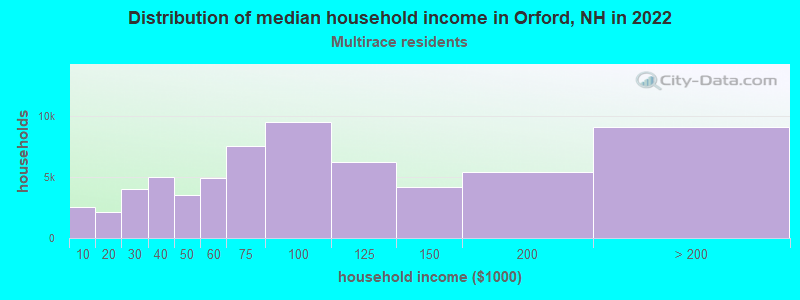
Household income for Hispanic or Latino race householders
Foreign-born residents in Orford
27 residents are foreign born (0.7% Asia, 0.7% Africa, 0.5% Europe, 0.3% North America).
| This city: | 2.5% |
| New Hampshire: | 4.4% |
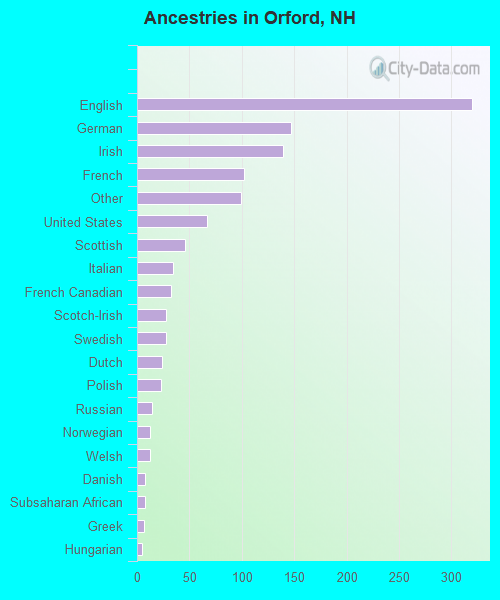
Ancestries in Orford

- 32027.5%English
- 14712.7%German
- 13912.0%Irish
- 1028.8%French
- 998.5%Other
- 675.8%United States
- 464.0%Scottish
- 342.9%Italian
- 322.8%French Canadian
- 282.4%Scotch-Irish
- 282.4%Swedish
- 242.1%Dutch
- 232.0%Polish
- 141.2%Russian
- 121.0%Norwegian
- 121.0%Welsh
- 80.7%Danish
- 80.7%Subsaharan African
- 70.6%Greek
- 50.4%Hungarian
- 20.2%Lithuanian
- 20.2%Portuguese
- 20.2%Swiss
- 10.09%Czech
Zip codes: 03777.