Races in Orinda, California (CA) Detailed Stats
Data:
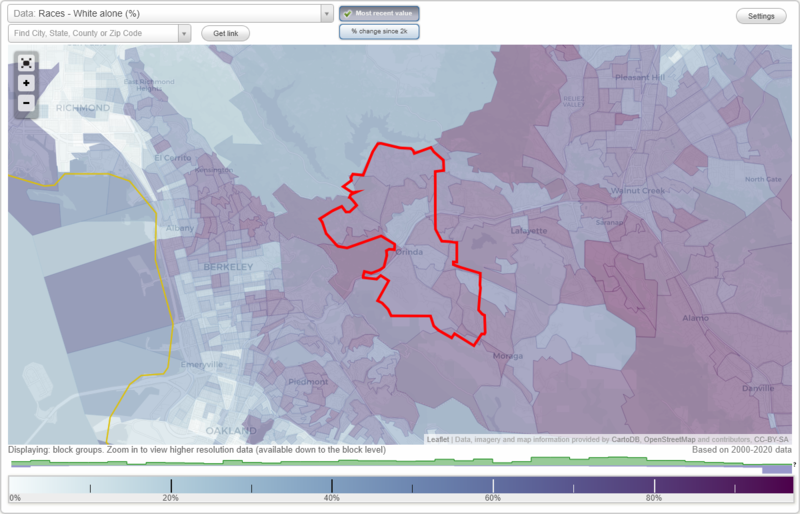
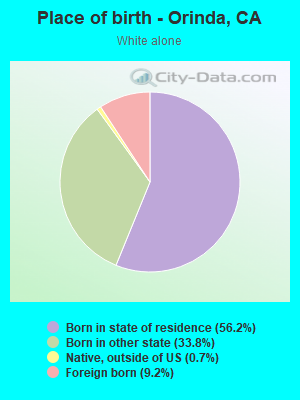
Races - White alone (%)
Races - White alone (% change since 2000)
Races - Black alone (%)
Races - Black alone (% change since 2000)
Races - American Indian alone (%)
Races - American Indian alone (% change since 2000)
Races - Asian alone (%)
Races - Asian alone (% change since 2000)
Races - Hispanic (%)
Races - Hispanic (% change since 2000)
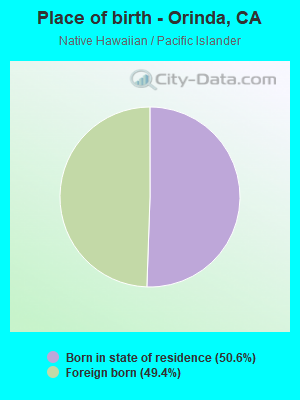
Races - Native Hawaiian and Other Pacific Islander alone (%)
Races - Native Hawaiian and Other Pacific Islander alone (% change since 2000)
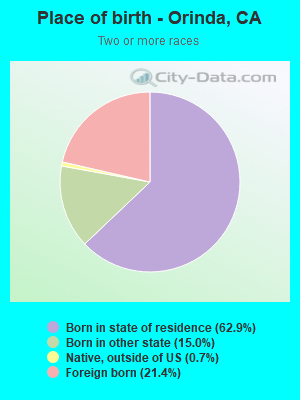
Races - Two or more races(%)
Races - Two or more races(% change since 2000)
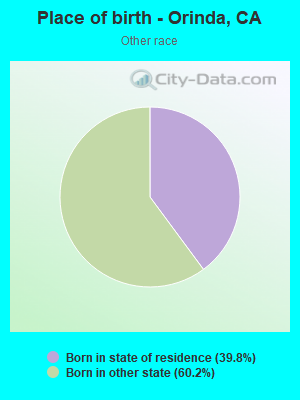
Races - Other race alone (%)
Races - Other race alone (% change since 2000)
Racial diversity
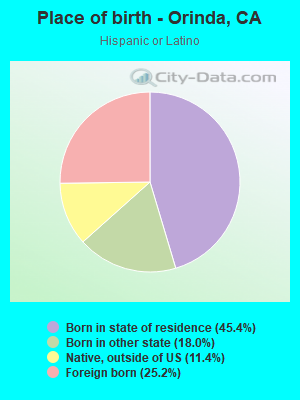
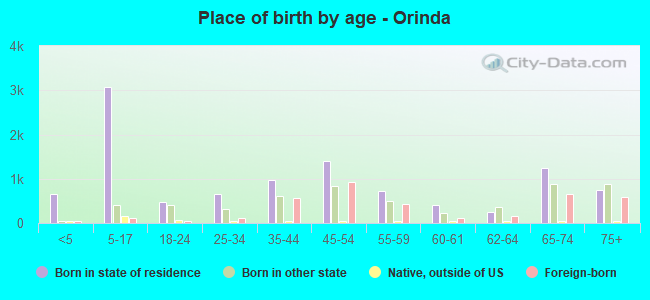
Place of birth - Born in state of residence (%)
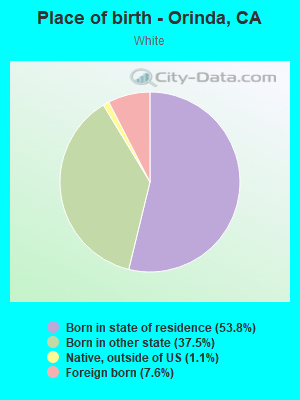
Place of birth - Born in state of residence (%) - White
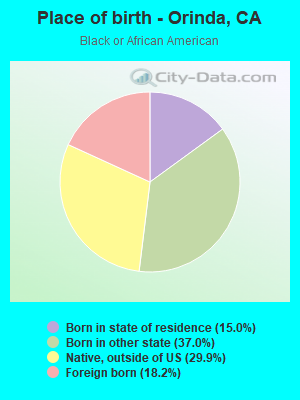
Place of birth - Born in state of residence (%) - Black or African American
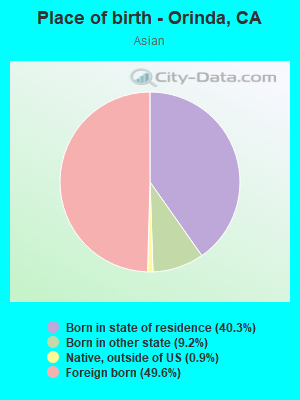
Place of birth - Born in state of residence (%) - Asian
Place of birth - Born in state of residence (%) - Hispanic or Latino
Place of birth - Born in state of residence (%) - American Indian and Alaska Native
Place of birth - Born in state of residence (%) - Multirace
Place of birth - Born in state of residence (%) - Other Race
Place of birth - Born in other state (%)
Place of birth - Born in other state (%) - White
Place of birth - Born in other state (%) - Black or African American
Place of birth - Born in other state (%) - Asian
Place of birth - Born in other state (%) - Hispanic or Latino
Place of birth - Born in other state (%) - American Indian and Alaska Native
Place of birth - Born in other state (%) - Multirace
Place of birth - Born in other state (%) - Other Race
Place of birth - Native, outside of US (%)
Place of birth - Native, outside of US (%) - White
Place of birth - Native, outside of US (%) - Black or African American
Place of birth - Native, outside of US (%) - Asian
Place of birth - Native, outside of US (%) - Hispanic or Latino
Place of birth - Native, outside of US (%) - American Indian and Alaska Native
Place of birth - Native, outside of US (%) - Multirace
Place of birth - Native, outside of US (%) - Other Race
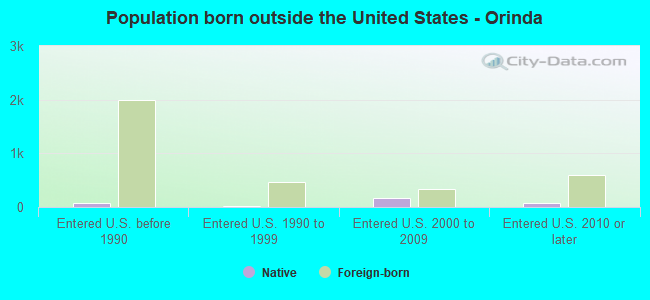
Place of birth - Foreign born (%)
Place of birth - Foreign born (%) - White
Place of birth - Foreign born (%) - Black or African American
Place of birth - Foreign born (%) - Asian
Place of birth - Foreign born (%) - Hispanic or Latino
Place of birth - Foreign born (%) - American Indian and Alaska Native
Place of birth - Foreign born (%) - Multirace
Place of birth - Foreign born (%) - Other Race
Residents speaking English at home (%)
Residents speaking English at home - Born in the United States (%)
Residents speaking English at home - Native, born elsewhere (%)
Residents speaking English at home - Foreign born (%)
Residents speaking Spanish at home (%)
Residents speaking Spanish at home - Born in the United States (%)
Residents speaking Spanish at home - Native, born elsewhere (%)
Residents speaking Spanish at home - Foreign born (%)
Residents speaking other language at home (%)
Residents speaking other language at home - Born in the United States (%)
Residents speaking other language at home - Native, born elsewhere (%)
Residents speaking other language at home - Foreign born (%)
Marital status - Never married (%)
Marital status - Now married (%)
Marital status - Separated (%)
Marital status - Widowed (%)
Marital status - Divorced (%)
Ancestries Reported - Arab (%)
Ancestries Reported - Czech (%)
Ancestries Reported - Danish (%)
Ancestries Reported - Dutch (%)
Ancestries Reported - English (%)
Ancestries Reported - French (%)
Ancestries Reported - French Canadian (%)
Ancestries Reported - German (%)
Ancestries Reported - Greek (%)
Ancestries Reported - Hungarian (%)
Ancestries Reported - Irish (%)
Ancestries Reported - Italian (%)
Ancestries Reported - Lithuanian (%)
Ancestries Reported - Norwegian (%)
Ancestries Reported - Polish (%)
Ancestries Reported - Portuguese (%)
Ancestries Reported - Russian (%)
Ancestries Reported - Scotch-Irish (%)
Ancestries Reported - Scottish (%)
Ancestries Reported - Slovak (%)
Ancestries Reported - Subsaharan African (%)
Ancestries Reported - Swedish (%)
Ancestries Reported - Swiss (%)
Ancestries Reported - Ukrainian (%)
Ancestries Reported - United States (%)
Ancestries Reported - Welsh (%)
Ancestries Reported - West Indian (%)
Ancestries Reported - Other (%)
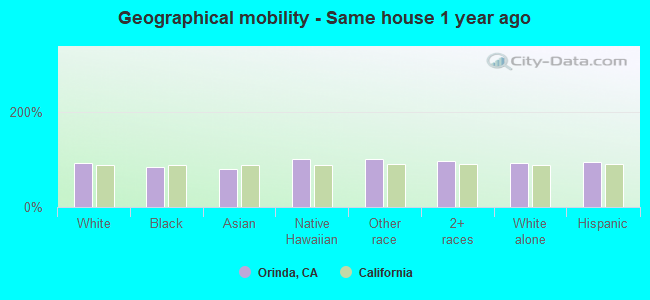
Geographical mobility - Same house 1 year ago (%)
Geographical mobility - Same house 1 year ago (%) - White
Geographical mobility - Same house 1 year ago (%) - Black or African American
Geographical mobility - Same house 1 year ago (%) - Asian
Geographical mobility - Same house 1 year ago (%) - Hispanic or Latino
Geographical mobility - Same house 1 year ago (%) - American Indian and Alaska Native
Geographical mobility - Same house 1 year ago (%) - Multirace
Geographical mobility - Same house 1 year ago (%) - Other Race
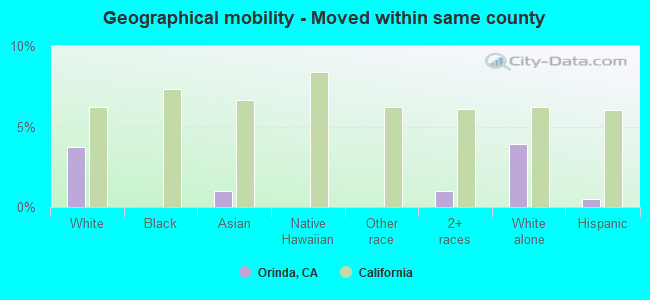
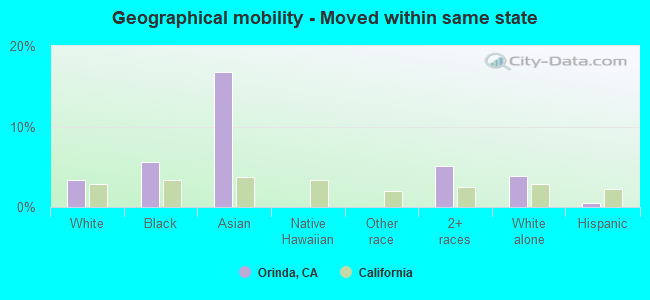
Geographical mobility - Moved within same county (%)
Geographical mobility - Moved within same county (%) - White
Geographical mobility - Moved within same county (%) - Black or African American
Geographical mobility - Moved within same county (%) - Asian
Geographical mobility - Moved within same county (%) - Hispanic or Latino
Geographical mobility - Moved within same county (%) - American Indian and Alaska Native
Geographical mobility - Moved within same county (%) - Multirace
Geographical mobility - Moved within same county (%) - Other Race
Geographical mobility - Moved from different county within same state (%)
Geographical mobility - Moved from different county within same state (%) - White
Geographical mobility - Moved from different county within same state (%) - Black or African American
Geographical mobility - Moved from different county within same state (%) - Asian
Geographical mobility - Moved from different county within same state (%) - Hispanic or Latino
Geographical mobility - Moved from different county within same state (%) - American Indian and Alaska Native
Geographical mobility - Moved from different county within same state (%) - Multirace
Geographical mobility - Moved from different county within same state (%) - Other Race
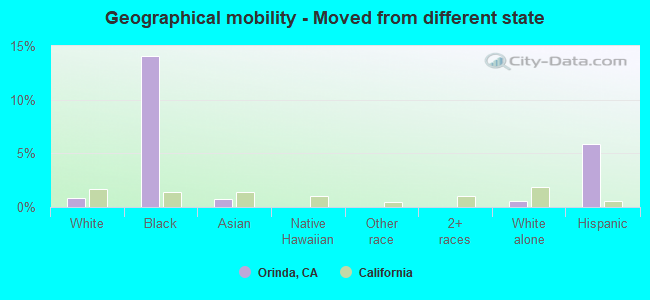
Geographical mobility - Moved from different state (%)
Geographical mobility - Moved from different state (%) - White
Geographical mobility - Moved from different state (%) - Black or African American
Geographical mobility - Moved from different state (%) - Asian
Geographical mobility - Moved from different state (%) - Hispanic or Latino
Geographical mobility - Moved from different state (%) - American Indian and Alaska Native
Geographical mobility - Moved from different state (%) - Multirace
Geographical mobility - Moved from different state (%) - Other Race
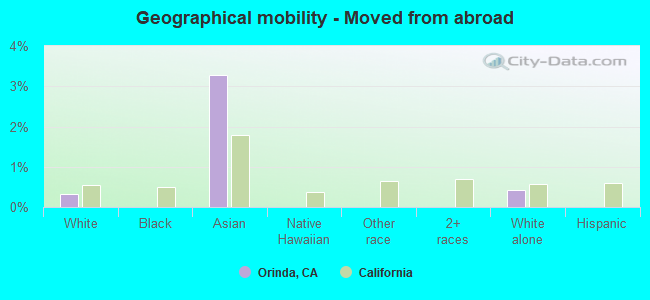
Geographical mobility - Moved from abroad (%)
Geographical mobility - Moved from abroad (%) - White
Geographical mobility - Moved from abroad (%) - Black or African American
Geographical mobility - Moved from abroad (%) - Asian
Geographical mobility - Moved from abroad (%) - Hispanic or Latino
Geographical mobility - Moved from abroad (%) - American Indian and Alaska Native
Geographical mobility - Moved from abroad (%) - Multirace
Geographical mobility - Moved from abroad (%) - Other Race
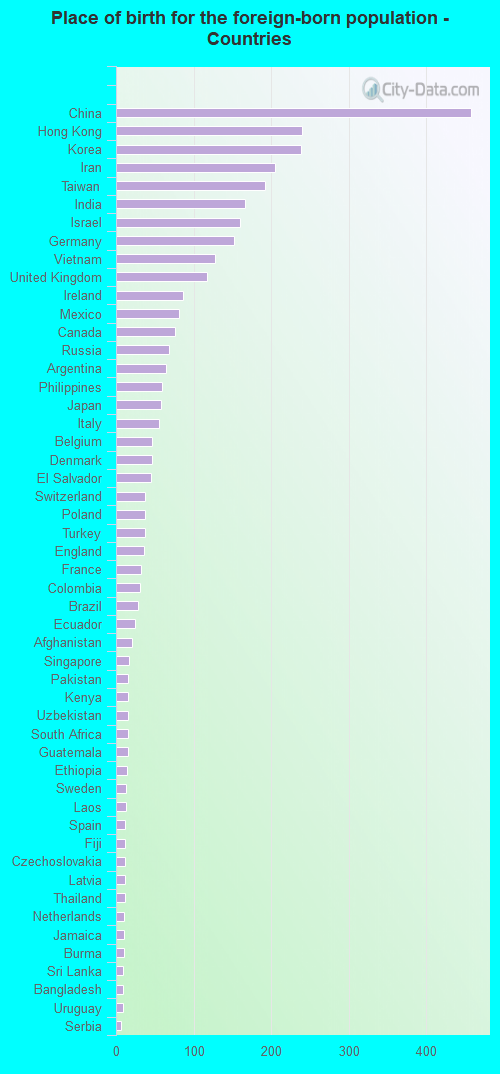
Place of birth for the foreign-born population - Ireland (%)
Place of birth for the foreign-born population - Denmark (%)
Place of birth for the foreign-born population - Norway (%)
Place of birth for the foreign-born population - Sweden (%)
Place of birth for the foreign-born population - United Kingdom (%)
Place of birth for the foreign-born population - England (%)
Place of birth for the foreign-born population - Scotland (%)
Place of birth for the foreign-born population - Other Northern Europe (%)
Place of birth for the foreign-born population - Austria (%)
Place of birth for the foreign-born population - Belgium (%)
Place of birth for the foreign-born population - France (%)
Place of birth for the foreign-born population - Germany (%)
Place of birth for the foreign-born population - Netherlands (%)
Place of birth for the foreign-born population - Switzerland (%)
Place of birth for the foreign-born population - Other Western Europe (%)
Place of birth for the foreign-born population - Greece (%)
Place of birth for the foreign-born population - Italy (%)
Place of birth for the foreign-born population - Portugal (%)
Place of birth for the foreign-born population - Spain (%)
Place of birth for the foreign-born population - Other Southern Europe (%)
Place of birth for the foreign-born population - Albania (%)
Place of birth for the foreign-born population - Belarus (%)
Place of birth for the foreign-born population - Bosnia and Herzegovina (%)
Place of birth for the foreign-born population - Bulgaria (%)
Place of birth for the foreign-born population - Croatia (%)
Place of birth for the foreign-born population - Czechoslovakia (%)
Place of birth for the foreign-born population - Hungary (%)
Place of birth for the foreign-born population - Latvia (%)
Place of birth for the foreign-born population - Lithuania (%)
Place of birth for the foreign-born population - North Macedonia (Macedonia) (%)
Place of birth for the foreign-born population - Moldova (%)
Place of birth for the foreign-born population - Poland (%)
Place of birth for the foreign-born population - Romania (%)
Place of birth for the foreign-born population - Russia (%)
Place of birth for the foreign-born population - Serbia (%)
Place of birth for the foreign-born population - Ukraine (%)
Place of birth for the foreign-born population - Other Eastern Europe (%)
Place of birth for the foreign-born population - China (%)
Place of birth for the foreign-born population - Hong Kong (%)
Place of birth for the foreign-born population - Taiwan (%)
Place of birth for the foreign-born population - Japan (%)
Place of birth for the foreign-born population - Korea (%)
Place of birth for the foreign-born population - Other Eastern Asia (%)
Place of birth for the foreign-born population - Afghanistan (%)
Place of birth for the foreign-born population - Bangladesh (%)
Place of birth for the foreign-born population - India (%)
Place of birth for the foreign-born population - Iran (%)
Place of birth for the foreign-born population - Kazakhstan (%)
Place of birth for the foreign-born population - Nepal (%)
Place of birth for the foreign-born population - Pakistan (%)
Place of birth for the foreign-born population - Sri Lanka (%)
Place of birth for the foreign-born population - Uzbekistan (%)
Place of birth for the foreign-born population - Other South Central Asia (%)
Place of birth for the foreign-born population - Burma (%)
Place of birth for the foreign-born population - Cambodia (%)
Place of birth for the foreign-born population - Indonesia (%)
Place of birth for the foreign-born population - Laos (%)
Place of birth for the foreign-born population - Malaysia (%)
Place of birth for the foreign-born population - Philippines (%)
Place of birth for the foreign-born population - Singapore (%)
Place of birth for the foreign-born population - Thailand (%)
Place of birth for the foreign-born population - Vietnam (%)
Place of birth for the foreign-born population - Other South Eastern Asia (%)
Place of birth for the foreign-born population - Armenia (%)
Place of birth for the foreign-born population - Iraq (%)
Place of birth for the foreign-born population - Israel (%)
Place of birth for the foreign-born population - Jordan (%)
Place of birth for the foreign-born population - Kuwait (%)
Place of birth for the foreign-born population - Lebanon (%)
Place of birth for the foreign-born population - Saudi Arabia (%)
Place of birth for the foreign-born population - Syria (%)
Place of birth for the foreign-born population - Turkey (%)
Place of birth for the foreign-born population - Yemen (%)
Place of birth for the foreign-born population - Other Western Asia (%)
Place of birth for the foreign-born population - Eritrea (%)
Place of birth for the foreign-born population - Ethiopia (%)
Place of birth for the foreign-born population - Kenya (%)
Place of birth for the foreign-born population - Somalia (%)
Place of birth for the foreign-born population - Uganda (%)
Place of birth for the foreign-born population - Zimbabwe (%)
Place of birth for the foreign-born population - Other Eastern Africa (%)
Place of birth for the foreign-born population - Cameroon (%)
Place of birth for the foreign-born population - Congo (%)
Place of birth for the foreign-born population - Democratic Republic of Congo (Zaire) (%)
Place of birth for the foreign-born population - Other Middle Africa (%)
Place of birth for the foreign-born population - Egypt (%)
Place of birth for the foreign-born population - Morocco (%)
Place of birth for the foreign-born population - Sudan (%)
Place of birth for the foreign-born population - Other Northern Africa (%)
Place of birth for the foreign-born population - South Africa (%)
Place of birth for the foreign-born population - Other Southern Africa (%)
Place of birth for the foreign-born population - Cabo Verde (%)
Place of birth for the foreign-born population - Ghana (%)
Place of birth for the foreign-born population - Liberia (%)
Place of birth for the foreign-born population - Nigeria (%)
Place of birth for the foreign-born population - Senegal (%)
Place of birth for the foreign-born population - Sierra Leone (%)
Place of birth for the foreign-born population - Other Western Africa (%)
Place of birth for the foreign-born population - Australia (%)
Place of birth for the foreign-born population - New Zealand (%)
Place of birth for the foreign-born population - Fiji (%)
Place of birth for the foreign-born population - Micronesia (%)
Place of birth for the foreign-born population - Bahamas (%)
Place of birth for the foreign-born population - Barbados (%)
Place of birth for the foreign-born population - Cuba (%)
Place of birth for the foreign-born population - Dominica (%)
Place of birth for the foreign-born population - Dominican Republic (%)
Place of birth for the foreign-born population - Grenada (%)
Place of birth for the foreign-born population - Haiti (%)
Place of birth for the foreign-born population - Jamaica (%)
Place of birth for the foreign-born population - St. Vincent and the Grenadines (%)
Place of birth for the foreign-born population - Trinidad and Tobago (%)
Place of birth for the foreign-born population - West Indies (%)
Place of birth for the foreign-born population - Other Caribbean (%)
Place of birth for the foreign-born population - Belize (%)
Place of birth for the foreign-born population - Costa Rica (%)
Place of birth for the foreign-born population - El Salvador (%)
Place of birth for the foreign-born population - Guatemala (%)
Place of birth for the foreign-born population - Honduras (%)
Place of birth for the foreign-born population - Mexico (%)
Place of birth for the foreign-born population - Nicaragua (%)
Place of birth for the foreign-born population - Panama (%)
Place of birth for the foreign-born population - Other Central America (%)
Place of birth for the foreign-born population - Argentina (%)
Place of birth for the foreign-born population - Bolivia (%)
Place of birth for the foreign-born population - Brazil (%)
Place of birth for the foreign-born population - Chile (%)
Place of birth for the foreign-born population - Colombia (%)
Place of birth for the foreign-born population - Ecuador (%)
Place of birth for the foreign-born population - Guyana (%)
Place of birth for the foreign-born population - Peru (%)
Place of birth for the foreign-born population - Uruguay (%)
Place of birth for the foreign-born population - Venezuela (%)
Place of birth for the foreign-born population - Other South America (%)
Place of birth for the foreign-born population - Canada (%)
Place of birth for the foreign-born population - Other Northern America (%)
Place of birth for the foreign-born population - Other (%)
Latest news about races in Orinda, CA collected exclusively by city-data.com from local newspapers, TV, and radio stations
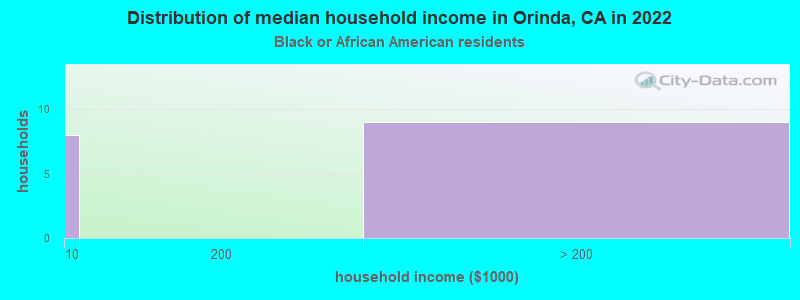
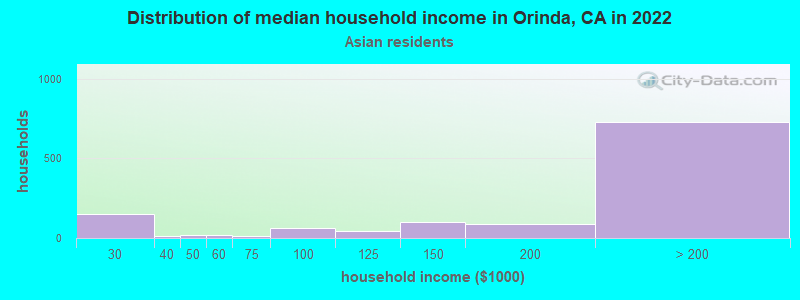
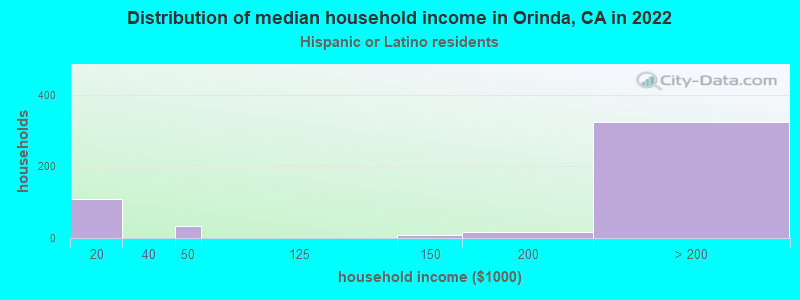
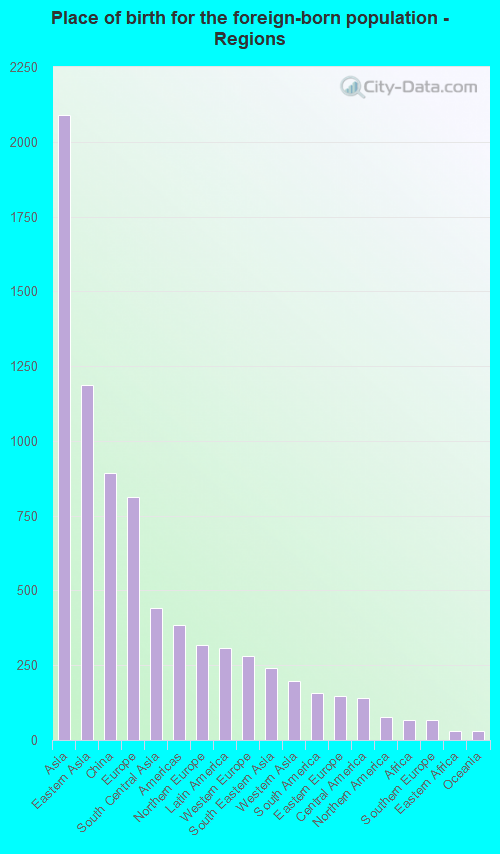
According to 2022 data, the most numerous races in Orinda, CA are Hispanic (1,092 residents), White alone (13,113 residents), and Asian alone (3,555 residents). 82.7% of Orinda residents speak English at home. 17.1% of Orinda, CA residents are foreign-born (10.5% born in Asia, 4.1% born in Europe), which is 52.4% less than the foreign-born rate of 26.0% across the entire state of California.
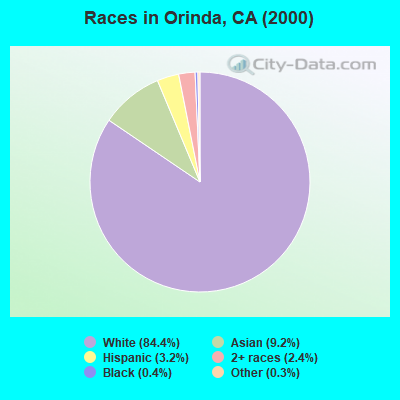
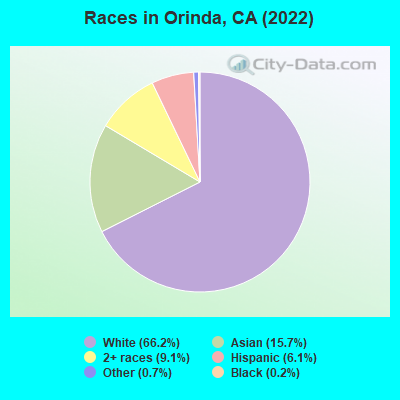
Race distribution in Orinda
2000 2022
15,816,790 46.7% White alone 10,966,556 32.4% Hispanic 3,648,860 10.8% Asian alone 2,181,926 6.4% Black alone 903,115 2.7% Two or more races 178,984 0.5% American Indian alone 103,736 0.3% Native Hawaiian and Other 71,681 0.2% Other race alone
15,732,184 40.3% Hispanic 13,160,426 33.7% White alone 5,957,867 15.3% Asian alone 2,025,218 5.2% Black alone 1,663,222 4.3% Two or more races 251,618 0.6% Other race alone 135,777 0.3% Native Hawaiian and Other 103,030 0.3% American Indian alone
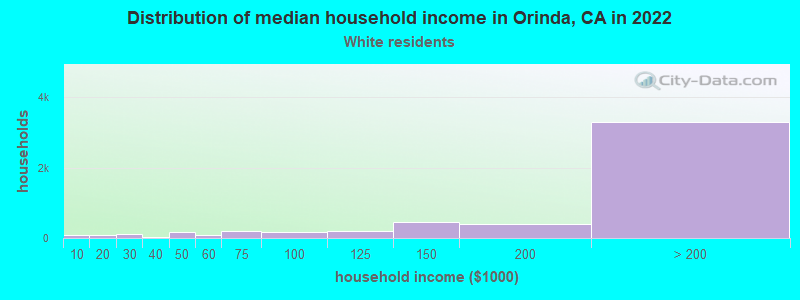
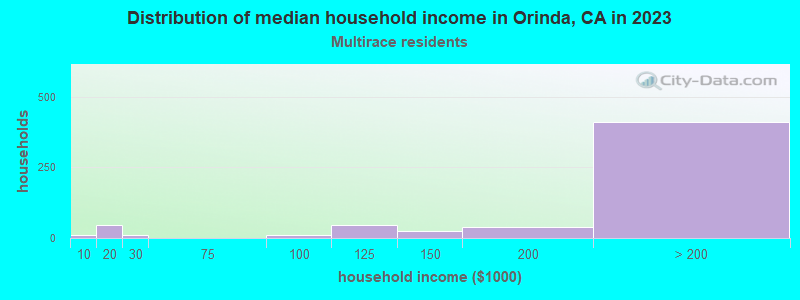
Income and house value in Orinda Median household income in 2022 over $200,000 White non-Hispanic householders$75,929 Black householdersover $200,000 American Indian and Alaska Native householdersover $200,000 Asian householders$105,504 Native Hawaiian and other Pacific Islander householdersover $200,000 Some other race householdersover $200,000 Two or more races householdersover $200,000 Hispanic or Latino race householdersMedian 2022 house value over $1,000,000 White Non-Hispanic householdersover $1,000,000 Black or African American householders$835,396 American Indian or Alaska Native householders over $1,000,000 Asian householdersover $1,000,000 Native Hawaiian and other Pacific Islander householders$826,758 Some other race householdersover $1,000,000 Two or more races householdersover $1,000,000 Hispanic or Latino householders
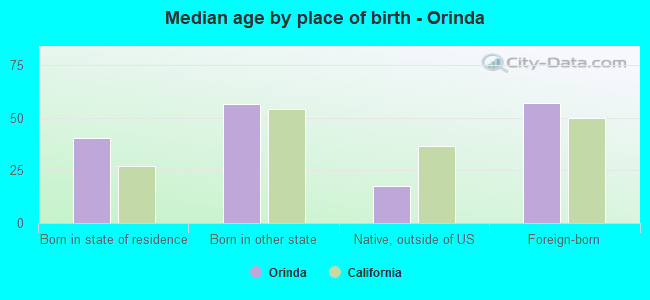
Median age by race in Orinda
55.4 Median age for White residents56.7 54.5 41.7 Median age for Black or African American residents65.7 38.4 39.7 Median age for American Indian / Alaska Native residents47.4 Median age for Asian residents46.3 48.1 41.2 Median age for Native Hawaiian / Pacific Islander residents52.5 Median age for Other race residents21.6 Median age for Two or more races residents23.8 19.0 52.1 Median age for White alone residents53.0 50.9 41.4 Median age for Hispanic or Latino residents41.0 41.1
Owner/renter occupied households by race in Orinda
House owners and renters - White residents 4,663 92.6% Owner occupied372 7.4% Renter occupiedHouse owners and renters - Black or African American residents 37 67.8% Owner occupied18 32.2% Renter occupiedHouse owners and renters - Asian residents 1,077 84.8% Owner occupied193 15.2% Renter occupiedHouse owners and renters - Native Hawaiian / Pacific Islander residents 21 100.0% Renter occupiedHouse owners and renters - Other race residents 25 100.0% Owner occupiedHouse owners and renters - Two or more races residents 494 90.5% Owner occupied52 9.5% Renter occupiedHouse owners and renters - White alone residents 4,851 91.4% Owner occupied456 8.6% Renter occupiedHouse owners and renters - Hispanic or Latino residents 264 100.0% Owner occupied
Language usage in Orinda
English speakers - Total 82.7% of residents of Orinda speak English at home.
2.4% of residents speak Spanish at home 420 91.5% Speak English very well39 8.5% Speak English less than very well15.6% of residents speak other language at home 2,379 80.1% Speak English very well590 19.9% Speak English less than very well
English speakers - Born in the United States 93.7% of residents of Orinda speak English at home.
1.8% of residents speak Spanish at home 99 100.0% Speak English very well4.5% of residents speak other language at home 198 80.8% Speak English very well47 19.2% Speak English less than very well
English speakers - Native, born elsewhere 55.5% of residents of Orinda speak English at home.
21.8% of residents speak Spanish at home 69 100.0% Speak English very well22.1% of residents speak other language at home 70 100.0% Speak English very well
English speakers - Foreign-born 35.8% of residents of Orinda speak English at home.
6.7% of residents speak Spanish at home 183 82.8% Speak English very well38 17.2% Speak English less than very well62.5% of residents speak other language at home 1,546 74.6% Speak English very well527 25.4% Speak English less than very well
White (Caucasian) - Speak only English Native:
100.0% (10,525)Foreign-born:
62.4% (557)
White (Caucasian) - Speak another language Native:
3.6% (379)Foreign-born:
55.3% (493)
Black or African American - Speak only English Native:
100.0% (183)Foreign-born:
78.4% (34)
Asian - Speak only English Native:
82.2% (1,344)Foreign-born:
28.7% (502)
Asian - Speak another language Native:
20.2% (330)Foreign-born:
74.1% (1,294)
Native Hawaiian / Pacific Islander - Speak another language Native:
81.6% (23)Foreign-born:
96.4% (36)
Two or more races - Speak only English Native:
72.9% (1,655)Foreign-born:
14.4% (126)
Two or more races - Speak another language Native:
12.8% (290)Foreign-born:
66.2% (580)
White alone - Speak only English Native:
95.7% (10,999)Foreign-born:
43.4% (575)
White alone - Speak another language Native:
4.3% (492)Foreign-born:
56.2% (745)
Hispanic or Latino - Speak only English Native:
75.7% (583)Foreign-born:
22.3% (62)
Hispanic or Latino - Speak another language Native:
24.3% (187)Foreign-born:
80.3% (223)
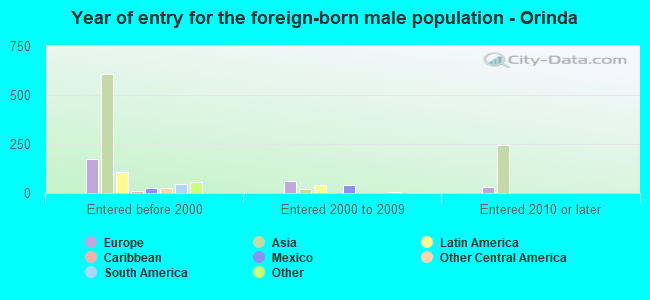
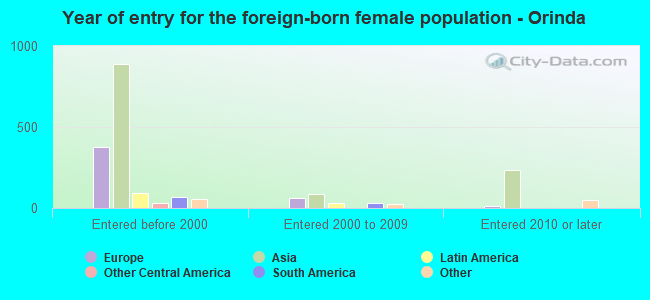
Foreign-born residents in Orinda 3,392 residents are foreign born (10.5% Asia , 4.1% Europe ).
This city:
17.1%California:
100.0%
Marital status for residents in Orinda Marital status - White (Caucasian) population 15 years and over
Males 19.5% Never married72.4% Now married0.6% Separated3.0% Widowed4.5% DivorcedFemales 21.9% Never married61.3% Now married0.8% Separated8.0% Widowed8.0% DivorcedWomen who gave birth in the past 12 months Now married:
85.7% (34)Unmarried:
14.3% (6)
Women who did not give birth in the past 12 months Now married:
50.4% (1,045)Unmarried:
49.6% (1,027)
Marital status - Black or African American population 15 years and over
Males 6.1% Never married84.8% Now married0.0% Separated0.0% Widowed9.1% DivorcedFemales 35.7% Never married23.5% Now married0.0% Separated40.8% Widowed0.0% DivorcedWomen who did not give birth in the past 12 months Now married:
39.7% (22)Unmarried:
60.3% (33)
Marital status - Asian population 15 years and over
Males 19.3% Never married76.9% Now married0.0% Separated1.8% Widowed2.1% DivorcedFemales 11.3% Never married73.4% Now married1.8% Separated8.8% Widowed4.7% DivorcedWomen who gave birth in the past 12 months Now married:
74.6% (51)Unmarried:
25.4% (17)
Women who did not give birth in the past 12 months Now married:
77.1% (519)Unmarried:
22.9% (154)
Marital status - Native Hawaiian / Pacific Islander population 15 years and over
Males 58.1% Never married41.9% Now married0.0% Separated0.0% Widowed0.0% DivorcedFemales 0.0% Never married100.0% Now married0.0% Separated0.0% Widowed0.0% DivorcedWomen who did not give birth in the past 12 months Now married:
100.0% (12)Unmarried:
0.0% (0)
Marital status - Other race population 15 years and over
Males 0.0% Never married100.0% Now married0.0% Separated0.0% Widowed0.0% DivorcedFemales 0.0% Never married100.0% Now married0.0% Separated0.0% Widowed0.0% DivorcedWomen who did not give birth in the past 12 months Now married:
100.0% (9)Unmarried:
0.0% (0)
Marital status - Two or more races population 15 years and over
Males 59.8% Never married40.2% Now married0.0% Separated0.0% Widowed0.0% DivorcedFemales 43.3% Never married48.3% Now married0.0% Separated8.4% Widowed0.0% DivorcedWomen who did not give birth in the past 12 months Now married:
39.0% (230)Unmarried:
61.0% (360)
Marital status - White alone, not Hispanic / Latino population 15 years and over
Males 18.9% Never married73.8% Now married0.7% Separated2.8% Widowed3.9% DivorcedFemales 21.0% Never married61.8% Now married0.8% Separated8.4% Widowed8.0% DivorcedWomen who gave birth in the past 12 months Now married:
81.0% (30)Unmarried:
19.0% (7)
Women who did not give birth in the past 12 months Now married:
51.4% (1,245)Unmarried:
48.6% (1,177)
Marital status - Hispanic or Latino population 15 years and over
Males 45.3% Never married38.7% Now married0.0% Separated3.8% Widowed12.2% DivorcedFemales 35.1% Never married57.9% Now married0.0% Separated0.8% Widowed6.2% DivorcedWomen who gave birth in the past 12 months Now married:
100.0% (14)Unmarried:
0.0% (0)
Women who did not give birth in the past 12 months Now married:
40.3% (94)Unmarried:
59.7% (140)
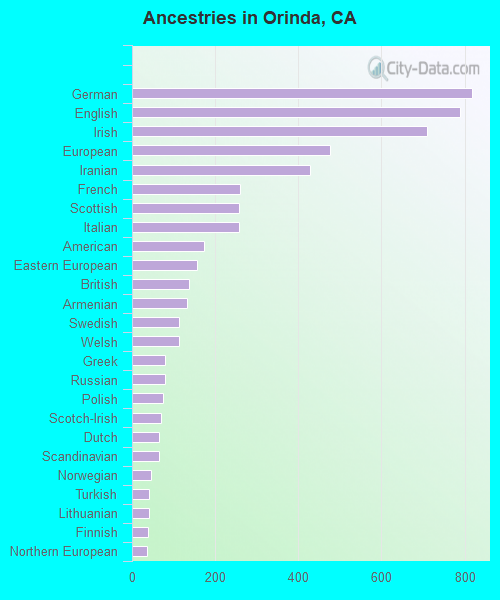
Ancestries in Orinda
1,204 12.6% European658 6.9% Irish596 6.2% English519 5.4% German458 4.8% American272 2.8% Italian209 2.2% British186 1.9% Northern European178 1.9% Iranian154 1.6% Eastern European131 1.4% Polish124 1.3% Norwegian113 1.2% Scottish105 1.1% Armenian96 1.0% Swedish91 1.0% Russian77 0.8% Dutch77 0.8% Scotch-Irish75 0.8% Danish65 0.7% Israeli62 0.6% Turkish51 0.5% French49 0.5% Finnish46 0.5% French Canadian42 0.4% Greek38 0.4% Scandinavian36 0.4% Ukrainian28 0.3% Austrian28 0.3% Afghan27 0.3% Welsh25 0.3% African23 0.2% Slovak21 0.2% Portuguese17 0.2% Swiss16 0.2% Latvian16 0.2% Ethiopian14 0.1% Croatian11 0.1% Jamaican9 0.09% Icelander8 0.08% Belgian8 0.08% Assyrian7 0.07% Czech7 0.07% Lithuanian6 0.06% Serbian4 0.04% Arab3 0.03% Slavic2 0.02% Canadian
Children Nativity (place of birth) in Orinda
Children under 6 years - Living with two parents Both parents native 501 100.0% NativeBoth parents foreign-born 68 89.2% Native8 10.8% Foreign-bornOne native, one foreign-born parent 247 100.0% NativeChildren under 6 years - Living with one parent Native parent 48 99.9% Native0 0.1% Foreign-bornForeign-born parent 13 49.7% Native13 50.3% Foreign-bornChildren 6 to 17 years - Living with two parents Both parents native 2,219 99.5% Native11 0.5% Foreign-bornBoth parents foreign-born 286 81.9% Native63 18.1% Foreign-bornOne native, one foreign-born parent 576 98.2% Native10 1.8% Foreign-bornChildren 6 to 17 years - Living with one parent Native parent 263 100.0% NativeForeign-born parent 10 50.0% Native10 50.0% Foreign-born
Grandparents responsible for own grandchildren in Orinda
Grandparents (30 to 59 years) White / Caucasian 7 100.0% Responsible for grandchildrenAsian 8 100.0% Responsible for grandchildrenWhite alone, not Hispanic / Latino 4 100.0% Responsible for grandchildrenGrandparents (60 years and over) White / Caucasian 58 100.0% Not responsible for grandchildrenAsian 13 19.5% Responsible for grandchildren52 80.5% Not responsible for grandchildrenWhite alone, not Hispanic / Latino 68 100.0% Not responsible for grandchildren