Races in Overland, Missouri (MO) Detailed Stats
Data:
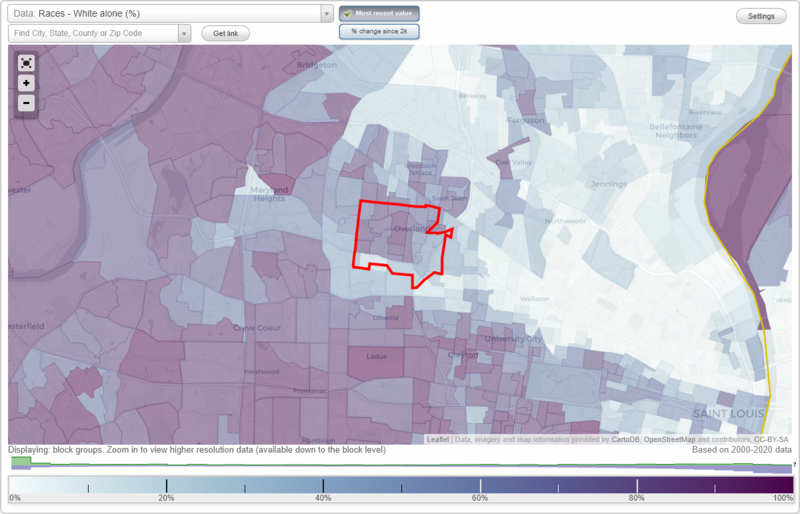
Races - White alone (%)
Races - White alone (% change since 2000)
Races - Black alone (%)
Races - Black alone (% change since 2000)
Races - American Indian alone (%)
Races - American Indian alone (% change since 2000)
Races - Asian alone (%)
Races - Asian alone (% change since 2000)
Races - Hispanic (%)
Races - Hispanic (% change since 2000)
Races - Native Hawaiian and Other Pacific Islander alone (%)
Races - Native Hawaiian and Other Pacific Islander alone (% change since 2000)
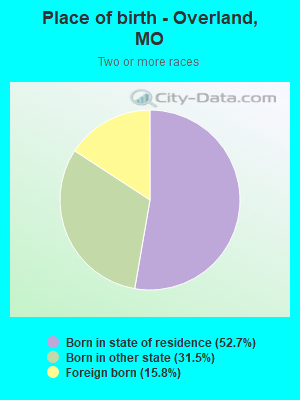
Races - Two or more races(%)
Races - Two or more races(% change since 2000)
Races - Other race alone (%)
Races - Other race alone (% change since 2000)
Racial diversity
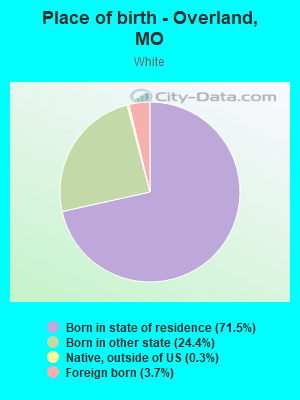
Place of birth - Born in state of residence (%)
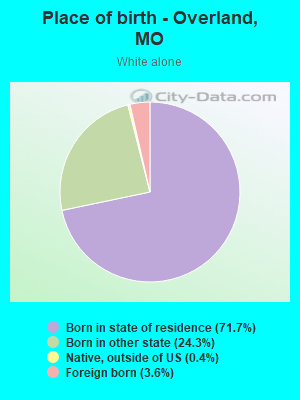
Place of birth - Born in state of residence (%) - White
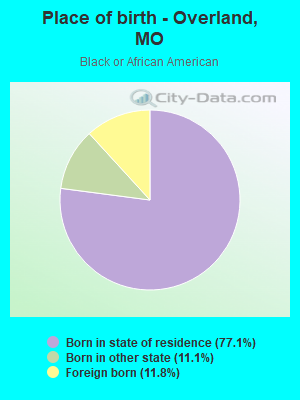
Place of birth - Born in state of residence (%) - Black or African American
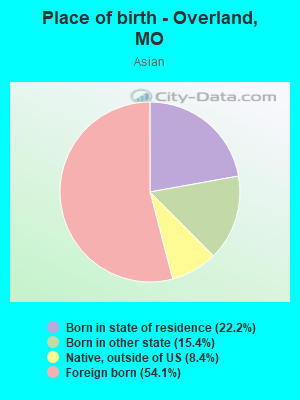
Place of birth - Born in state of residence (%) - Asian
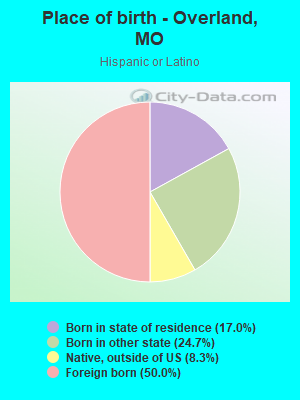
Place of birth - Born in state of residence (%) - Hispanic or Latino
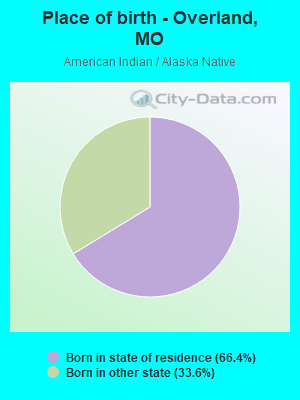
Place of birth - Born in state of residence (%) - American Indian and Alaska Native
Place of birth - Born in state of residence (%) - Multirace
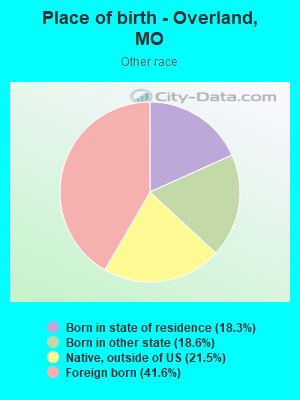
Place of birth - Born in state of residence (%) - Other Race
Place of birth - Born in other state (%)
Place of birth - Born in other state (%) - White
Place of birth - Born in other state (%) - Black or African American
Place of birth - Born in other state (%) - Asian
Place of birth - Born in other state (%) - Hispanic or Latino
Place of birth - Born in other state (%) - American Indian and Alaska Native
Place of birth - Born in other state (%) - Multirace
Place of birth - Born in other state (%) - Other Race
Place of birth - Native, outside of US (%)
Place of birth - Native, outside of US (%) - White
Place of birth - Native, outside of US (%) - Black or African American
Place of birth - Native, outside of US (%) - Asian
Place of birth - Native, outside of US (%) - Hispanic or Latino
Place of birth - Native, outside of US (%) - American Indian and Alaska Native
Place of birth - Native, outside of US (%) - Multirace
Place of birth - Native, outside of US (%) - Other Race
Place of birth - Foreign born (%)
Place of birth - Foreign born (%) - White
Place of birth - Foreign born (%) - Black or African American
Place of birth - Foreign born (%) - Asian
Place of birth - Foreign born (%) - Hispanic or Latino
Place of birth - Foreign born (%) - American Indian and Alaska Native
Place of birth - Foreign born (%) - Multirace
Place of birth - Foreign born (%) - Other Race
Residents speaking English at home (%)
Residents speaking English at home - Born in the United States (%)
Residents speaking English at home - Native, born elsewhere (%)
Residents speaking English at home - Foreign born (%)
Residents speaking Spanish at home (%)
Residents speaking Spanish at home - Born in the United States (%)
Residents speaking Spanish at home - Native, born elsewhere (%)
Residents speaking Spanish at home - Foreign born (%)
Residents speaking other language at home (%)
Residents speaking other language at home - Born in the United States (%)
Residents speaking other language at home - Native, born elsewhere (%)
Residents speaking other language at home - Foreign born (%)
Marital status - Never married (%)
Marital status - Now married (%)
Marital status - Separated (%)
Marital status - Widowed (%)
Marital status - Divorced (%)
Ancestries Reported - Arab (%)
Ancestries Reported - Czech (%)
Ancestries Reported - Danish (%)
Ancestries Reported - Dutch (%)
Ancestries Reported - English (%)
Ancestries Reported - French (%)
Ancestries Reported - French Canadian (%)
Ancestries Reported - German (%)
Ancestries Reported - Greek (%)
Ancestries Reported - Hungarian (%)
Ancestries Reported - Irish (%)
Ancestries Reported - Italian (%)
Ancestries Reported - Lithuanian (%)
Ancestries Reported - Norwegian (%)
Ancestries Reported - Polish (%)
Ancestries Reported - Portuguese (%)
Ancestries Reported - Russian (%)
Ancestries Reported - Scotch-Irish (%)
Ancestries Reported - Scottish (%)
Ancestries Reported - Slovak (%)
Ancestries Reported - Subsaharan African (%)
Ancestries Reported - Swedish (%)
Ancestries Reported - Swiss (%)
Ancestries Reported - Ukrainian (%)
Ancestries Reported - United States (%)
Ancestries Reported - Welsh (%)
Ancestries Reported - West Indian (%)
Ancestries Reported - Other (%)
Geographical mobility - Same house 1 year ago (%)
Geographical mobility - Same house 1 year ago (%) - White
Geographical mobility - Same house 1 year ago (%) - Black or African American
Geographical mobility - Same house 1 year ago (%) - Asian
Geographical mobility - Same house 1 year ago (%) - Hispanic or Latino
Geographical mobility - Same house 1 year ago (%) - American Indian and Alaska Native
Geographical mobility - Same house 1 year ago (%) - Multirace
Geographical mobility - Same house 1 year ago (%) - Other Race
Geographical mobility - Moved within same county (%)
Geographical mobility - Moved within same county (%) - White
Geographical mobility - Moved within same county (%) - Black or African American
Geographical mobility - Moved within same county (%) - Asian
Geographical mobility - Moved within same county (%) - Hispanic or Latino
Geographical mobility - Moved within same county (%) - American Indian and Alaska Native
Geographical mobility - Moved within same county (%) - Multirace
Geographical mobility - Moved within same county (%) - Other Race
Geographical mobility - Moved from different county within same state (%)
Geographical mobility - Moved from different county within same state (%) - White
Geographical mobility - Moved from different county within same state (%) - Black or African American
Geographical mobility - Moved from different county within same state (%) - Asian
Geographical mobility - Moved from different county within same state (%) - Hispanic or Latino
Geographical mobility - Moved from different county within same state (%) - American Indian and Alaska Native
Geographical mobility - Moved from different county within same state (%) - Multirace
Geographical mobility - Moved from different county within same state (%) - Other Race
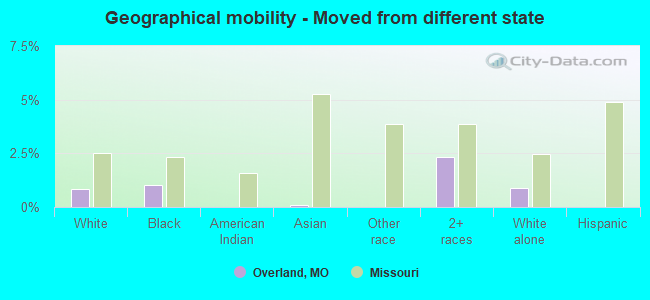
Geographical mobility - Moved from different state (%)
Geographical mobility - Moved from different state (%) - White
Geographical mobility - Moved from different state (%) - Black or African American
Geographical mobility - Moved from different state (%) - Asian
Geographical mobility - Moved from different state (%) - Hispanic or Latino
Geographical mobility - Moved from different state (%) - American Indian and Alaska Native
Geographical mobility - Moved from different state (%) - Multirace
Geographical mobility - Moved from different state (%) - Other Race
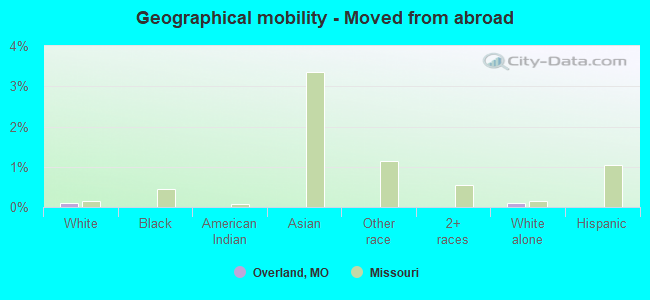
Geographical mobility - Moved from abroad (%)
Geographical mobility - Moved from abroad (%) - White
Geographical mobility - Moved from abroad (%) - Black or African American
Geographical mobility - Moved from abroad (%) - Asian
Geographical mobility - Moved from abroad (%) - Hispanic or Latino
Geographical mobility - Moved from abroad (%) - American Indian and Alaska Native
Geographical mobility - Moved from abroad (%) - Multirace
Geographical mobility - Moved from abroad (%) - Other Race
Place of birth for the foreign-born population - Ireland (%)
Place of birth for the foreign-born population - Denmark (%)
Place of birth for the foreign-born population - Norway (%)
Place of birth for the foreign-born population - Sweden (%)
Place of birth for the foreign-born population - United Kingdom (%)
Place of birth for the foreign-born population - England (%)
Place of birth for the foreign-born population - Scotland (%)
Place of birth for the foreign-born population - Other Northern Europe (%)
Place of birth for the foreign-born population - Austria (%)
Place of birth for the foreign-born population - Belgium (%)
Place of birth for the foreign-born population - France (%)
Place of birth for the foreign-born population - Germany (%)
Place of birth for the foreign-born population - Netherlands (%)
Place of birth for the foreign-born population - Switzerland (%)
Place of birth for the foreign-born population - Other Western Europe (%)
Place of birth for the foreign-born population - Greece (%)
Place of birth for the foreign-born population - Italy (%)
Place of birth for the foreign-born population - Portugal (%)
Place of birth for the foreign-born population - Spain (%)
Place of birth for the foreign-born population - Other Southern Europe (%)
Place of birth for the foreign-born population - Albania (%)
Place of birth for the foreign-born population - Belarus (%)
Place of birth for the foreign-born population - Bosnia and Herzegovina (%)
Place of birth for the foreign-born population - Bulgaria (%)
Place of birth for the foreign-born population - Croatia (%)
Place of birth for the foreign-born population - Czechoslovakia (%)
Place of birth for the foreign-born population - Hungary (%)
Place of birth for the foreign-born population - Latvia (%)
Place of birth for the foreign-born population - Lithuania (%)
Place of birth for the foreign-born population - North Macedonia (Macedonia) (%)
Place of birth for the foreign-born population - Moldova (%)
Place of birth for the foreign-born population - Poland (%)
Place of birth for the foreign-born population - Romania (%)
Place of birth for the foreign-born population - Russia (%)
Place of birth for the foreign-born population - Serbia (%)
Place of birth for the foreign-born population - Ukraine (%)
Place of birth for the foreign-born population - Other Eastern Europe (%)
Place of birth for the foreign-born population - China (%)
Place of birth for the foreign-born population - Hong Kong (%)
Place of birth for the foreign-born population - Taiwan (%)
Place of birth for the foreign-born population - Japan (%)
Place of birth for the foreign-born population - Korea (%)
Place of birth for the foreign-born population - Other Eastern Asia (%)
Place of birth for the foreign-born population - Afghanistan (%)
Place of birth for the foreign-born population - Bangladesh (%)
Place of birth for the foreign-born population - India (%)
Place of birth for the foreign-born population - Iran (%)
Place of birth for the foreign-born population - Kazakhstan (%)
Place of birth for the foreign-born population - Nepal (%)
Place of birth for the foreign-born population - Pakistan (%)
Place of birth for the foreign-born population - Sri Lanka (%)
Place of birth for the foreign-born population - Uzbekistan (%)
Place of birth for the foreign-born population - Other South Central Asia (%)
Place of birth for the foreign-born population - Burma (%)
Place of birth for the foreign-born population - Cambodia (%)
Place of birth for the foreign-born population - Indonesia (%)
Place of birth for the foreign-born population - Laos (%)
Place of birth for the foreign-born population - Malaysia (%)
Place of birth for the foreign-born population - Philippines (%)
Place of birth for the foreign-born population - Singapore (%)
Place of birth for the foreign-born population - Thailand (%)
Place of birth for the foreign-born population - Vietnam (%)
Place of birth for the foreign-born population - Other South Eastern Asia (%)
Place of birth for the foreign-born population - Armenia (%)
Place of birth for the foreign-born population - Iraq (%)
Place of birth for the foreign-born population - Israel (%)
Place of birth for the foreign-born population - Jordan (%)
Place of birth for the foreign-born population - Kuwait (%)
Place of birth for the foreign-born population - Lebanon (%)
Place of birth for the foreign-born population - Saudi Arabia (%)
Place of birth for the foreign-born population - Syria (%)
Place of birth for the foreign-born population - Turkey (%)
Place of birth for the foreign-born population - Yemen (%)
Place of birth for the foreign-born population - Other Western Asia (%)
Place of birth for the foreign-born population - Eritrea (%)
Place of birth for the foreign-born population - Ethiopia (%)
Place of birth for the foreign-born population - Kenya (%)
Place of birth for the foreign-born population - Somalia (%)
Place of birth for the foreign-born population - Uganda (%)
Place of birth for the foreign-born population - Zimbabwe (%)
Place of birth for the foreign-born population - Other Eastern Africa (%)
Place of birth for the foreign-born population - Cameroon (%)
Place of birth for the foreign-born population - Congo (%)
Place of birth for the foreign-born population - Democratic Republic of Congo (Zaire) (%)
Place of birth for the foreign-born population - Other Middle Africa (%)
Place of birth for the foreign-born population - Egypt (%)
Place of birth for the foreign-born population - Morocco (%)
Place of birth for the foreign-born population - Sudan (%)
Place of birth for the foreign-born population - Other Northern Africa (%)
Place of birth for the foreign-born population - South Africa (%)
Place of birth for the foreign-born population - Other Southern Africa (%)
Place of birth for the foreign-born population - Cabo Verde (%)
Place of birth for the foreign-born population - Ghana (%)
Place of birth for the foreign-born population - Liberia (%)
Place of birth for the foreign-born population - Nigeria (%)
Place of birth for the foreign-born population - Senegal (%)
Place of birth for the foreign-born population - Sierra Leone (%)
Place of birth for the foreign-born population - Other Western Africa (%)
Place of birth for the foreign-born population - Australia (%)
Place of birth for the foreign-born population - New Zealand (%)
Place of birth for the foreign-born population - Fiji (%)
Place of birth for the foreign-born population - Micronesia (%)
Place of birth for the foreign-born population - Bahamas (%)
Place of birth for the foreign-born population - Barbados (%)
Place of birth for the foreign-born population - Cuba (%)
Place of birth for the foreign-born population - Dominica (%)
Place of birth for the foreign-born population - Dominican Republic (%)
Place of birth for the foreign-born population - Grenada (%)
Place of birth for the foreign-born population - Haiti (%)
Place of birth for the foreign-born population - Jamaica (%)
Place of birth for the foreign-born population - St. Vincent and the Grenadines (%)
Place of birth for the foreign-born population - Trinidad and Tobago (%)
Place of birth for the foreign-born population - West Indies (%)
Place of birth for the foreign-born population - Other Caribbean (%)
Place of birth for the foreign-born population - Belize (%)
Place of birth for the foreign-born population - Costa Rica (%)
Place of birth for the foreign-born population - El Salvador (%)
Place of birth for the foreign-born population - Guatemala (%)
Place of birth for the foreign-born population - Honduras (%)
Place of birth for the foreign-born population - Mexico (%)
Place of birth for the foreign-born population - Nicaragua (%)
Place of birth for the foreign-born population - Panama (%)
Place of birth for the foreign-born population - Other Central America (%)
Place of birth for the foreign-born population - Argentina (%)
Place of birth for the foreign-born population - Bolivia (%)
Place of birth for the foreign-born population - Brazil (%)
Place of birth for the foreign-born population - Chile (%)
Place of birth for the foreign-born population - Colombia (%)
Place of birth for the foreign-born population - Ecuador (%)
Place of birth for the foreign-born population - Guyana (%)
Place of birth for the foreign-born population - Peru (%)
Place of birth for the foreign-born population - Uruguay (%)
Place of birth for the foreign-born population - Venezuela (%)
Place of birth for the foreign-born population - Other South America (%)
Place of birth for the foreign-born population - Canada (%)
Place of birth for the foreign-born population - Other Northern America (%)
Place of birth for the foreign-born population - Other (%)
Latest news about races in Overland, MO collected exclusively by city-data.com from local newspapers, TV, and radio stations
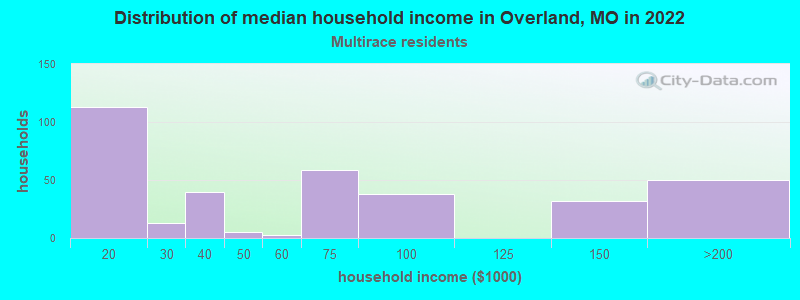
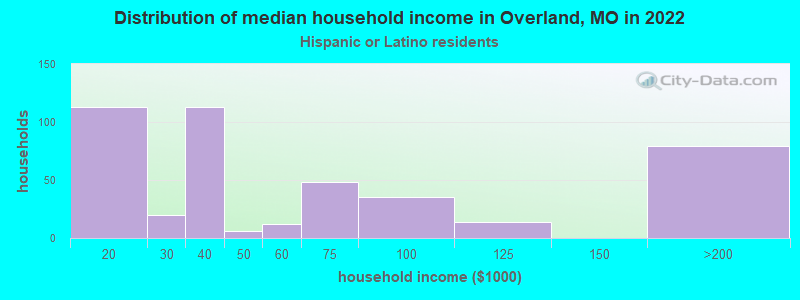
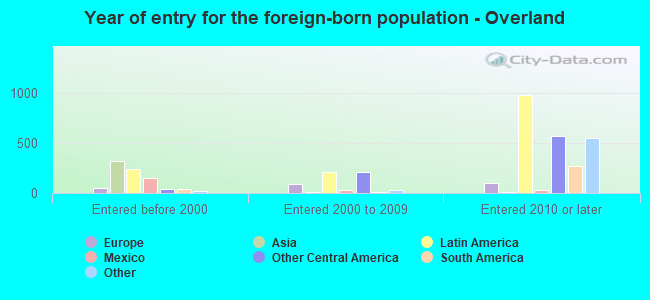
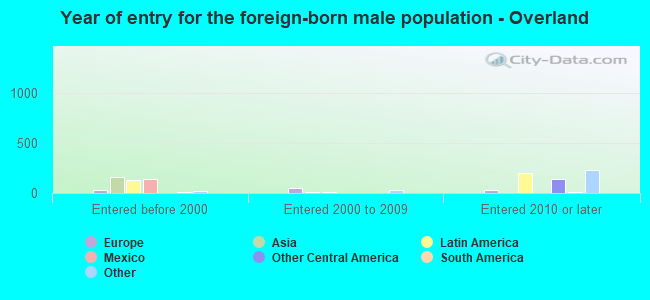
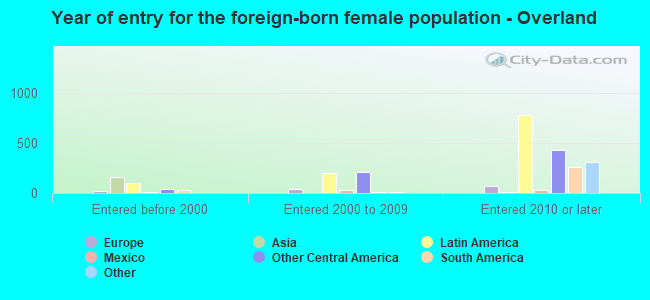
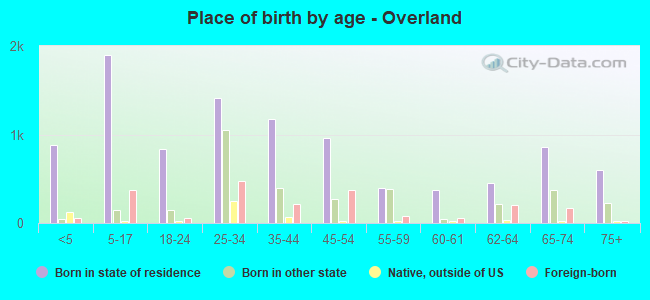
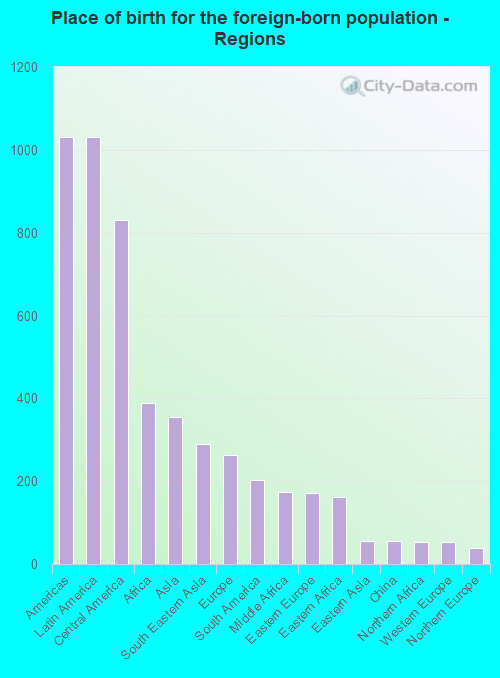
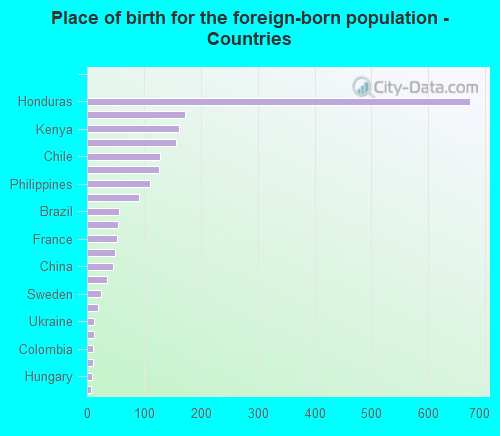
According to 2022 data, the most numerous races in Overland, MO are White alone (8,395 residents), Black alone (3,391 residents), and Two or more races (897 residents). 78.0% of Overland residents speak English at home. 13.0% of Overland, MO residents are foreign-born (6.7% born in Latin America, 2.5% born in Africa, 2.3% born in Asia, 1.7% born in Europe), which is 69.2% greater than the foreign-born rate of 4.0% across the entire state of Missouri.
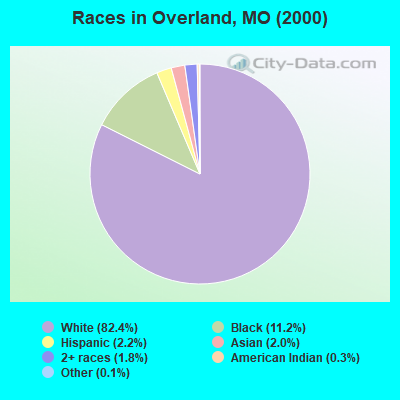
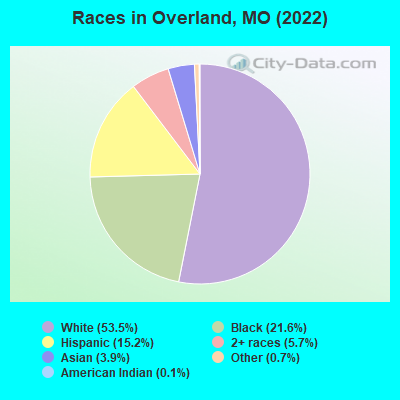
Race distribution in Overland
2000 2022
4,686,474 83.8% White alone 625,667 11.2% Black alone 118,592 2.1% Hispanic 71,905 1.3% Two or more races 61,041 1.1% Asian alone 23,302 0.4% American Indian alone 5,291 0.09% Other race alone 2,939 0.05% Native Hawaiian and Other
4,733,411 76.6% White alone 656,739 10.6% Black alone 316,300 5.1% Two or more races 291,763 4.7% Hispanic 132,436 2.1% Asian alone 27,467 0.4% Other race alone 12,313 0.2% American Indian alone 7,528 0.1% Native Hawaiian and Other
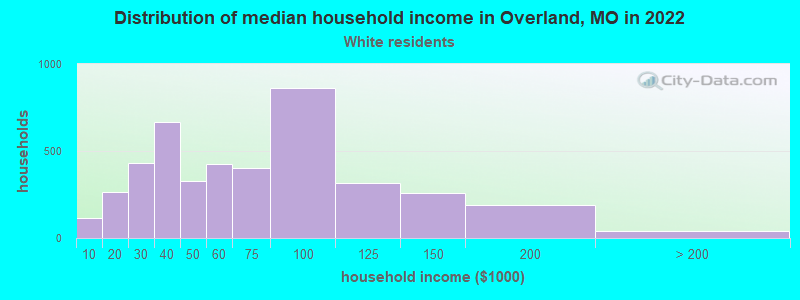
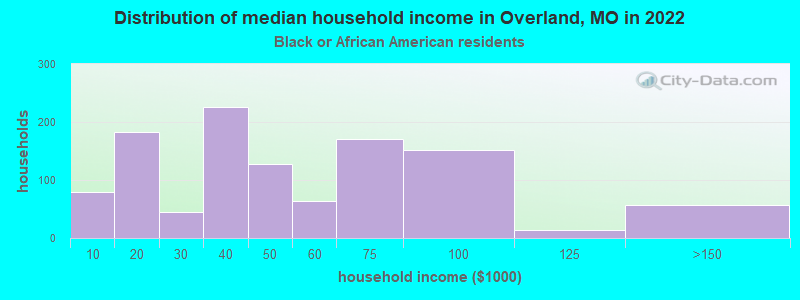
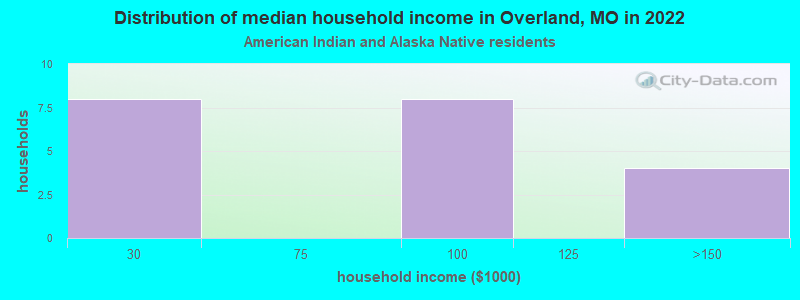
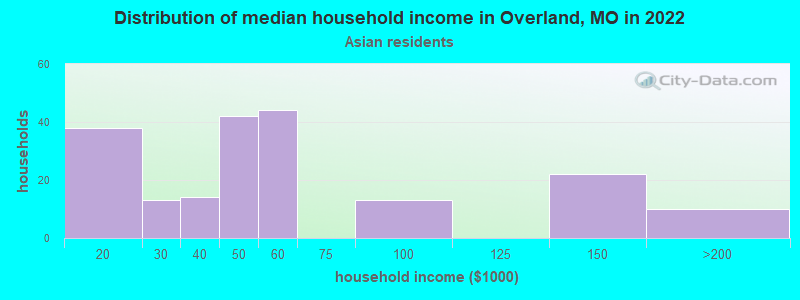
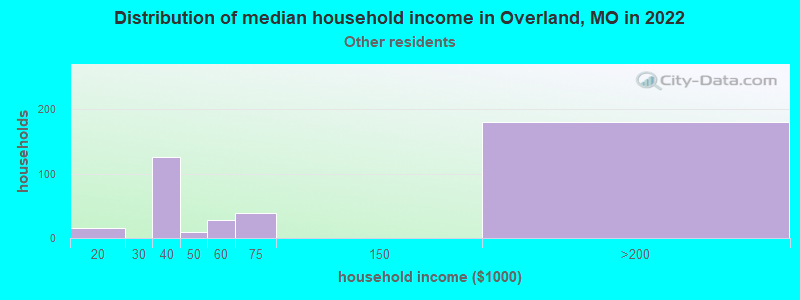
Income and house value in Overland Median household income in 2022 $57,300 White non-Hispanic householders$42,209 Black householders$46,600 Asian householders$58,282 Two or more races householdersMedian 2022 house value $115,899 White Non-Hispanic householders$116,677 Black or African American householders $129,706 Asian householders$131,262 Some other race householders$112,594 Two or more races householders$175,016 Hispanic or Latino householders
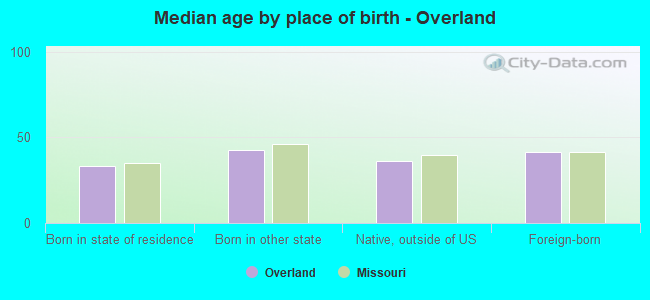
Median age by race in Overland
46.2 Median age for White residents41.1 51.6 28.0 Median age for Black or African American residents27.5 29.0 41.0 Median age for American Indian / Alaska Native residents51.0 -505,494,505.0 55.4 Median age for Asian residents50.4 66.1 -710,303,029.6 Median age for Native Hawaiian / Pacific Islander residents-1,449,781,657.9 -752,136,751.4 25.1 Median age for Other race residents27.1 26.0 30.9 Median age for Two or more races residents34.7 35.7 46.2 Median age for White alone residents41.0 51.5 28.5 Median age for Hispanic or Latino residents28.7 27.1
Owner/renter occupied households by race in Overland
House owners and renters - White residents 3,258 75.1% Owner occupied1,082 24.9% Renter occupiedHouse owners and renters - Black or African American residents 300 25.9% Owner occupied858 74.1% Renter occupiedHouse owners and renters - American Indian / Alaska Native residents 3 25.2% Owner occupied10 74.8% Renter occupiedHouse owners and renters - Asian residents 172 72.4% Owner occupied66 27.6% Renter occupiedHouse owners and renters - Other race residents 160 47.5% Owner occupied177 52.5% Renter occupiedHouse owners and renters - Two or more races residents 206 57.4% Owner occupied153 42.6% Renter occupiedHouse owners and renters - White alone residents 3,234 75.0% Owner occupied1,078 25.0% Renter occupiedHouse owners and renters - Hispanic or Latino residents 232 46.7% Owner occupied265 53.3% Renter occupied
Language usage in Overland
English speakers - Total 78.0% of residents of Overland speak English at home.
13.0% of residents speak Spanish at home 1,223 64.7% Speak English very well668 35.3% Speak English less than very well8.8% of residents speak other language at home 642 50.5% Speak English very well630 49.5% Speak English less than very well
English speakers - Born in the United States 82.6% of residents of Overland speak English at home.
13.3% of residents speak Spanish at home 373 86.7% Speak English very well57 13.3% Speak English less than very well3.1% of residents speak other language at home 47 46.5% Speak English very well54 53.5% Speak English less than very well
English speakers - Native, born elsewhere 4.2% of residents of Overland speak English at home.
65.2% of residents speak Spanish at home 164 87.7% Speak English very well23 12.3% Speak English less than very well24.0% of residents speak other language at home 69 100.0% Speak English very well
English speakers - Foreign-born 10.4% of residents of Overland speak English at home.
50.4% of residents speak Spanish at home 445 44.1% Speak English very well565 55.9% Speak English less than very well43.3% of residents speak other language at home 401 46.2% Speak English very well467 53.8% Speak English less than very well
White (Caucasian) - Speak only English Native:
96.7% (7,523)Foreign-born:
29.0% (93)
White (Caucasian) - Speak another language Native:
3.3% (254)Foreign-born:
69.5% (223)
Black or African American - Speak only English Native:
96.4% (2,605)Foreign-born:
15.7% (62)
Black or African American - Speak another language Native:
4.6% (124)Foreign-born:
79.8% (317)
Asian - Speak only English Native:
20.0% (61)Foreign-born:
7.1% (25)
Asian - Speak another language Native:
70.7% (215)Foreign-born:
90.3% (315)
Other race - Speak only English Native:
20.6% (195)Foreign-born:
3.2% (28)
Other race - Speak another language Native:
52.4% (498)Foreign-born:
89.2% (762)
Two or more races - Speak another language Native:
3.1% (24)Foreign-born:
100.0% (173)
White alone - Speak only English Native:
96.5% (7,460)Foreign-born:
29.0% (88)
White alone - Speak another language Native:
3.5% (271)Foreign-born:
69.8% (211)
Hispanic or Latino - Speak only English Native:
20.4% (211)Foreign-born:
1.5% (15)
Hispanic or Latino - Speak another language Native:
67.2% (696)Foreign-born:
99.7% (1,024)
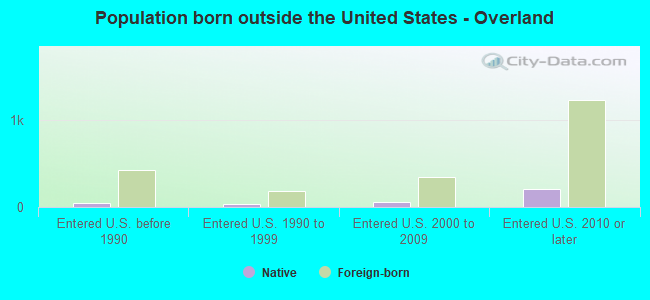
Foreign-born residents in Overland 2,040 residents are foreign born (6.7% Latin America , 2.5% Africa , 2.3% Asia , 1.7% Europe ).
This city:
13.0%Missouri:
4.2%
Marital status for residents in Overland Marital status - White (Caucasian) population 15 years and over
Males 45.8% Never married32.9% Now married2.9% Separated2.5% Widowed16.0% DivorcedFemales 25.4% Never married36.2% Now married1.1% Separated14.7% Widowed22.6% DivorcedWomen who gave birth in the past 12 months Now married:
54.1% (107)Unmarried:
45.9% (90)
Women who did not give birth in the past 12 months Now married:
37.3% (495)Unmarried:
62.7% (832)
Marital status - Black or African American population 15 years and over
Males 57.2% Never married22.5% Now married2.0% Separated8.0% Widowed10.3% DivorcedFemales 59.4% Never married21.0% Now married4.9% Separated5.0% Widowed9.7% DivorcedWomen who gave birth in the past 12 months Now married:
42.6% (73)Unmarried:
57.4% (98)
Women who did not give birth in the past 12 months Now married:
19.9% (133)Unmarried:
80.1% (536)
Marital status - American Indian / Alaska Native population 15 years and over
Males 0.0% Never married21.1% Now married0.0% Separated0.0% Widowed78.9% DivorcedFemales 0.0% Never married50.0% Now married0.0% Separated50.0% Widowed0.0% DivorcedWomen who did not give birth in the past 12 months Now married:
50.0% (2)Unmarried:
50.0% (2)
Marital status - Asian population 15 years and over
Males 36.0% Never married47.6% Now married0.0% Separated0.0% Widowed16.4% DivorcedFemales 5.8% Never married61.4% Now married0.0% Separated10.8% Widowed22.0% DivorcedWomen who did not give birth in the past 12 months Now married:
66.7% (30)Unmarried:
33.3% (15)
Marital status - Other race population 15 years and over
Males 40.4% Never married58.5% Now married0.0% Separated0.0% Widowed1.1% DivorcedFemales 40.0% Never married44.8% Now married3.2% Separated0.0% Widowed12.0% DivorcedWomen who gave birth in the past 12 months Now married:
42.6% (28)Unmarried:
57.4% (38)
Women who did not give birth in the past 12 months Now married:
55.9% (338)Unmarried:
44.1% (267)
Marital status - Two or more races population 15 years and over
Males 41.0% Never married41.7% Now married1.6% Separated2.3% Widowed13.4% DivorcedFemales 36.3% Never married30.8% Now married21.2% Separated2.2% Widowed9.6% DivorcedWomen who did not give birth in the past 12 months Now married:
46.9% (121)Unmarried:
53.1% (137)
Marital status - White alone, not Hispanic / Latino population 15 years and over
Males 46.6% Never married32.6% Now married2.9% Separated2.5% Widowed15.4% DivorcedFemales 25.6% Never married35.6% Now married1.1% Separated14.8% Widowed22.8% DivorcedWomen who gave birth in the past 12 months Now married:
54.1% (108)Unmarried:
45.9% (91)
Women who did not give birth in the past 12 months Now married:
36.4% (479)Unmarried:
63.6% (838)
Marital status - Hispanic or Latino population 15 years and over
Males 37.0% Never married57.6% Now married0.0% Separated0.0% Widowed5.4% DivorcedFemales 39.9% Never married45.2% Now married2.9% Separated0.0% Widowed12.0% DivorcedWomen who gave birth in the past 12 months Now married:
42.6% (28)Unmarried:
57.4% (38)
Women who did not give birth in the past 12 months Now married:
56.9% (368)Unmarried:
43.1% (278)
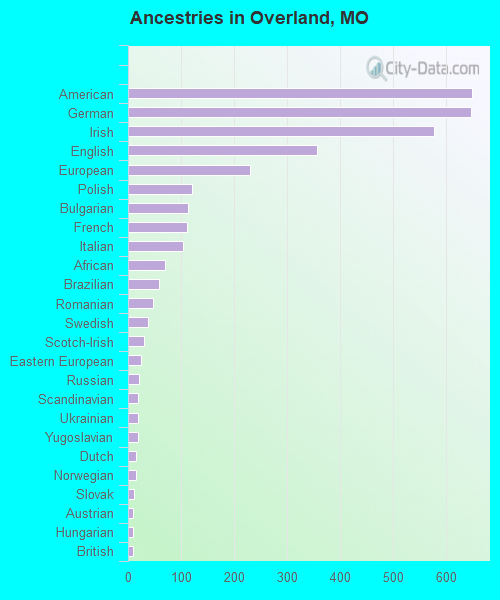
Ancestries in Overland
648 8.4% American646 8.4% German576 7.5% Irish356 4.6% English230 3.0% European121 1.6% Polish114 1.5% Bulgarian112 1.5% French103 1.3% Italian69 0.9% African58 0.8% Brazilian48 0.6% Romanian38 0.5% Swedish31 0.4% Scotch-Irish24 0.3% Eastern European20 0.3% Russian19 0.2% Scandinavian18 0.2% Ukrainian18 0.2% Yugoslavian16 0.2% Dutch16 0.2% Norwegian11 0.1% Slovak10 0.1% Austrian10 0.1% Hungarian9 0.1% British9 0.1% Finnish3 0.04% Greek
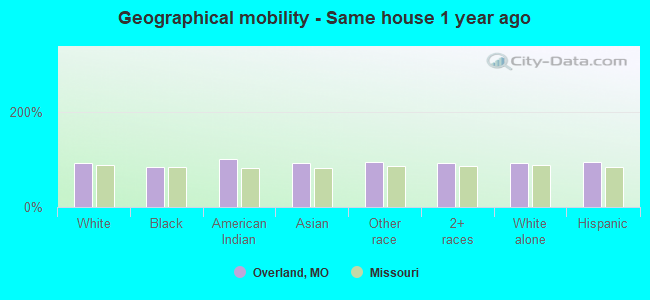
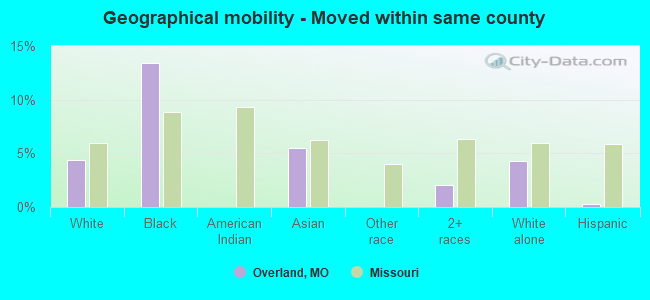
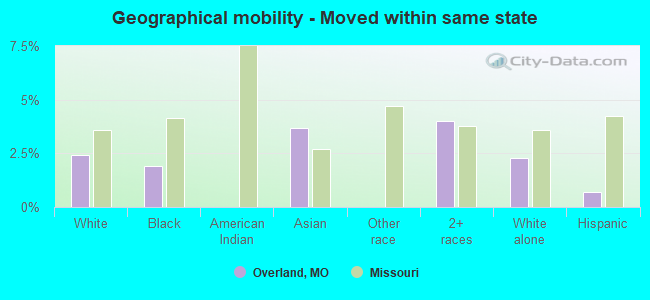
Geographical mobility in Overland Same house 1 year ago 7,684 92.3% White (Caucasian)2,715 83.5% Black or African American23 100.0% American Indian / Alaska Native577 93.2% Asian1,939 94.5% Other race1,011 93.4% Two or more races7,609 92.6% White alone, not Hispanic / Latino2,237 95.0% Hispanic or LatinoMoved within same county 366 4.4% White / Caucasian435 13.4% Black or African American34 5.5% Asian22 2.0% Two or more races355 4.3% White alone, not Hispanic / Latino8 0.3% Hispanic or LatinoMoved within same state 201 2.4% White / Caucasian62 1.9% Black or African American23 3.7% Asian44 4.0% Two or more races186 2.3% White alone, not Hispanic / Latino16 0.7% Hispanic or LatinoMoved from different state 71 0.9% White / Caucasian34 1.0% Black or African American1 0.1% Asian25 2.3% Two or more races71 0.9% White alone, not Hispanic / LatinoMoved from abroad 8 0.1% White8 0.1% White alone, not Hispanic / Latino
Children Nativity (place of birth) in Overland
Children under 6 years - Living with two parents Both parents native 138 100.0% NativeBoth parents foreign-born 277 100.0% NativeOne native, one foreign-born parent 490 100.0% NativeChildren under 6 years - Living with one parent Native parent 524 100.0% NativeChildren 6 to 17 years - Living with two parents Both parents native 456 100.0% NativeBoth parents foreign-born 31 20.5% Native120 79.5% Foreign-bornOne native, one foreign-born parent 13 100.0% NativeChildren 6 to 17 years - Living with one parent Native parent 852 99.0% Native8 1.0% Foreign-bornForeign-born parent 80 77.5% Native23 22.5% Foreign-born
Grandparents responsible for own grandchildren in Overland
Grandparents (30 to 59 years) White / Caucasian 38 69.1% Responsible for grandchildren17 30.9% Not responsible for grandchildrenBlack or African American 28 100.0% Not responsible for grandchildrenTwo or more races 22 100.0% Not responsible for grandchildrenWhite alone, not Hispanic / Latino 40 70.4% Responsible for grandchildren17 29.6% Not responsible for grandchildrenGrandparents (60 years and over) White / Caucasian 36 66.2% Responsible for grandchildren18 33.8% Not responsible for grandchildrenBlack or African American 38 100.0% Responsible for grandchildrenWhite alone, not Hispanic / Latino 36 65.8% Responsible for grandchildren19 34.2% Not responsible for grandchildren