Races in Palermo, California (CA) Detailed Stats
Data:
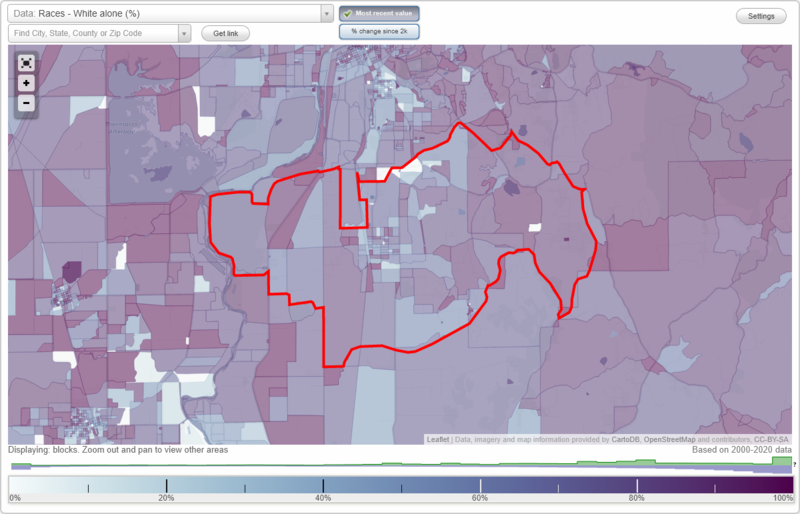
Races - White alone (%)
Races - White alone (% change since 2000)
Races - Black alone (%)
Races - Black alone (% change since 2000)
Races - American Indian alone (%)
Races - American Indian alone (% change since 2000)
Races - Asian alone (%)
Races - Asian alone (% change since 2000)
Races - Hispanic (%)
Races - Hispanic (% change since 2000)
Races - Native Hawaiian and Other Pacific Islander alone (%)
Races - Native Hawaiian and Other Pacific Islander alone (% change since 2000)
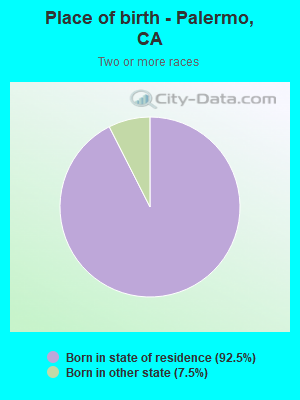
Races - Two or more races(%)
Races - Two or more races(% change since 2000)
Races - Other race alone (%)
Races - Other race alone (% change since 2000)
Racial diversity
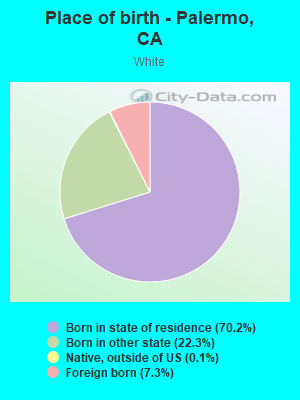
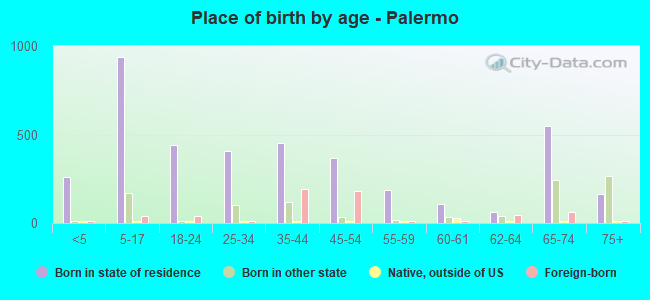
Place of birth - Born in state of residence (%)
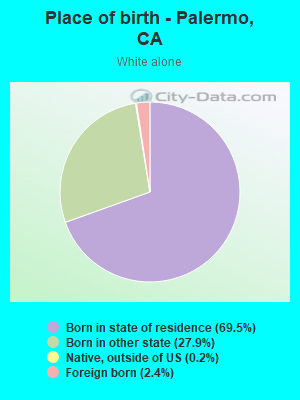
Place of birth - Born in state of residence (%) - White
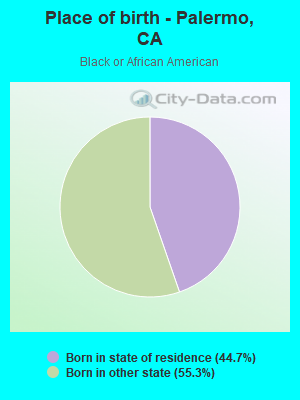
Place of birth - Born in state of residence (%) - Black or African American
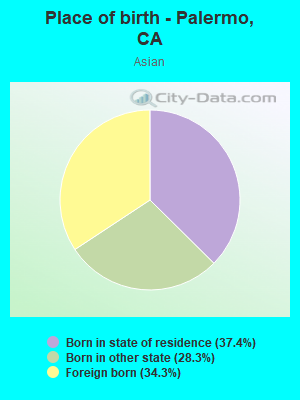
Place of birth - Born in state of residence (%) - Asian
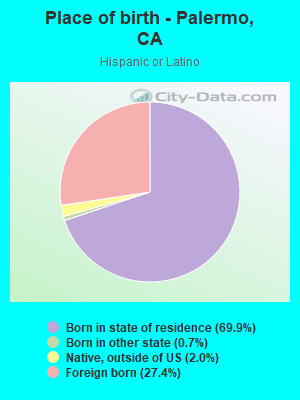
Place of birth - Born in state of residence (%) - Hispanic or Latino
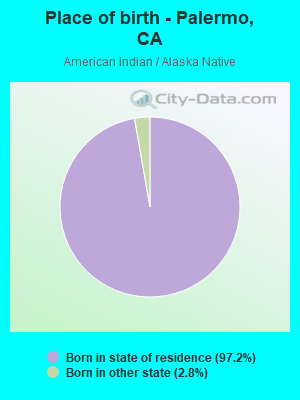
Place of birth - Born in state of residence (%) - American Indian and Alaska Native
Place of birth - Born in state of residence (%) - Multirace
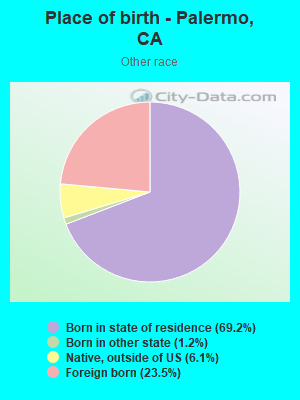
Place of birth - Born in state of residence (%) - Other Race
Place of birth - Born in other state (%)
Place of birth - Born in other state (%) - White
Place of birth - Born in other state (%) - Black or African American
Place of birth - Born in other state (%) - Asian
Place of birth - Born in other state (%) - Hispanic or Latino
Place of birth - Born in other state (%) - American Indian and Alaska Native
Place of birth - Born in other state (%) - Multirace
Place of birth - Born in other state (%) - Other Race
Place of birth - Native, outside of US (%)
Place of birth - Native, outside of US (%) - White
Place of birth - Native, outside of US (%) - Black or African American
Place of birth - Native, outside of US (%) - Asian
Place of birth - Native, outside of US (%) - Hispanic or Latino
Place of birth - Native, outside of US (%) - American Indian and Alaska Native
Place of birth - Native, outside of US (%) - Multirace
Place of birth - Native, outside of US (%) - Other Race
Place of birth - Foreign born (%)
Place of birth - Foreign born (%) - White
Place of birth - Foreign born (%) - Black or African American
Place of birth - Foreign born (%) - Asian
Place of birth - Foreign born (%) - Hispanic or Latino
Place of birth - Foreign born (%) - American Indian and Alaska Native
Place of birth - Foreign born (%) - Multirace
Place of birth - Foreign born (%) - Other Race
Residents speaking English at home (%)
Residents speaking English at home - Born in the United States (%)
Residents speaking English at home - Native, born elsewhere (%)
Residents speaking English at home - Foreign born (%)
Residents speaking Spanish at home (%)
Residents speaking Spanish at home - Born in the United States (%)
Residents speaking Spanish at home - Native, born elsewhere (%)
Residents speaking Spanish at home - Foreign born (%)
Residents speaking other language at home (%)
Residents speaking other language at home - Born in the United States (%)
Residents speaking other language at home - Native, born elsewhere (%)
Residents speaking other language at home - Foreign born (%)
Marital status - Never married (%)
Marital status - Now married (%)
Marital status - Separated (%)
Marital status - Widowed (%)
Marital status - Divorced (%)
Ancestries Reported - Arab (%)
Ancestries Reported - Czech (%)
Ancestries Reported - Danish (%)
Ancestries Reported - Dutch (%)
Ancestries Reported - English (%)
Ancestries Reported - French (%)
Ancestries Reported - French Canadian (%)
Ancestries Reported - German (%)
Ancestries Reported - Greek (%)
Ancestries Reported - Hungarian (%)
Ancestries Reported - Irish (%)
Ancestries Reported - Italian (%)
Ancestries Reported - Lithuanian (%)
Ancestries Reported - Norwegian (%)
Ancestries Reported - Polish (%)
Ancestries Reported - Portuguese (%)
Ancestries Reported - Russian (%)
Ancestries Reported - Scotch-Irish (%)
Ancestries Reported - Scottish (%)
Ancestries Reported - Slovak (%)
Ancestries Reported - Subsaharan African (%)
Ancestries Reported - Swedish (%)
Ancestries Reported - Swiss (%)
Ancestries Reported - Ukrainian (%)
Ancestries Reported - United States (%)
Ancestries Reported - Welsh (%)
Ancestries Reported - West Indian (%)
Ancestries Reported - Other (%)
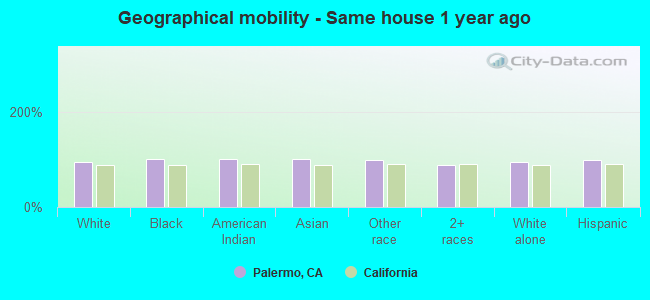
Geographical mobility - Same house 1 year ago (%)
Geographical mobility - Same house 1 year ago (%) - White
Geographical mobility - Same house 1 year ago (%) - Black or African American
Geographical mobility - Same house 1 year ago (%) - Asian
Geographical mobility - Same house 1 year ago (%) - Hispanic or Latino
Geographical mobility - Same house 1 year ago (%) - American Indian and Alaska Native
Geographical mobility - Same house 1 year ago (%) - Multirace
Geographical mobility - Same house 1 year ago (%) - Other Race
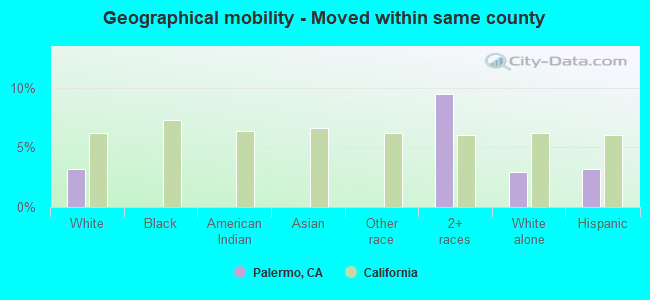
Geographical mobility - Moved within same county (%)
Geographical mobility - Moved within same county (%) - White
Geographical mobility - Moved within same county (%) - Black or African American
Geographical mobility - Moved within same county (%) - Asian
Geographical mobility - Moved within same county (%) - Hispanic or Latino
Geographical mobility - Moved within same county (%) - American Indian and Alaska Native
Geographical mobility - Moved within same county (%) - Multirace
Geographical mobility - Moved within same county (%) - Other Race
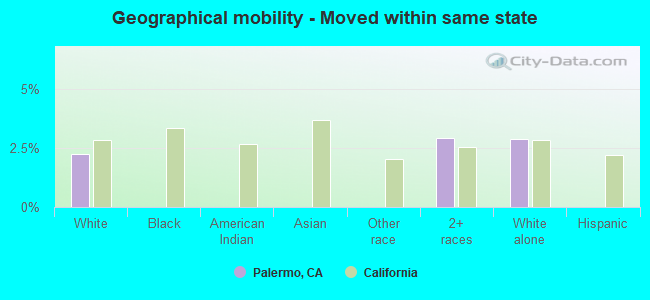
Geographical mobility - Moved from different county within same state (%)
Geographical mobility - Moved from different county within same state (%) - White
Geographical mobility - Moved from different county within same state (%) - Black or African American
Geographical mobility - Moved from different county within same state (%) - Asian
Geographical mobility - Moved from different county within same state (%) - Hispanic or Latino
Geographical mobility - Moved from different county within same state (%) - American Indian and Alaska Native
Geographical mobility - Moved from different county within same state (%) - Multirace
Geographical mobility - Moved from different county within same state (%) - Other Race
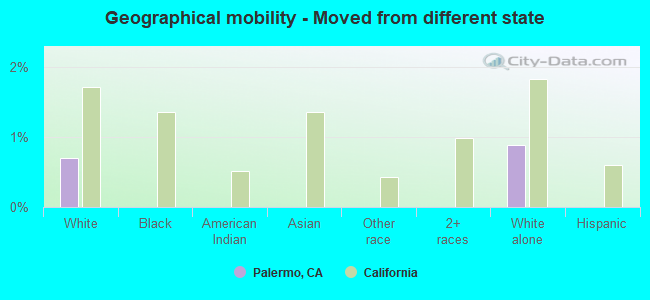
Geographical mobility - Moved from different state (%)
Geographical mobility - Moved from different state (%) - White
Geographical mobility - Moved from different state (%) - Black or African American
Geographical mobility - Moved from different state (%) - Asian
Geographical mobility - Moved from different state (%) - Hispanic or Latino
Geographical mobility - Moved from different state (%) - American Indian and Alaska Native
Geographical mobility - Moved from different state (%) - Multirace
Geographical mobility - Moved from different state (%) - Other Race
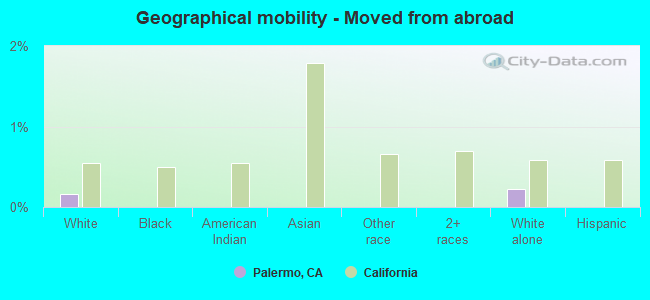
Geographical mobility - Moved from abroad (%)
Geographical mobility - Moved from abroad (%) - White
Geographical mobility - Moved from abroad (%) - Black or African American
Geographical mobility - Moved from abroad (%) - Asian
Geographical mobility - Moved from abroad (%) - Hispanic or Latino
Geographical mobility - Moved from abroad (%) - American Indian and Alaska Native
Geographical mobility - Moved from abroad (%) - Multirace
Geographical mobility - Moved from abroad (%) - Other Race
Place of birth for the foreign-born population - Ireland (%)
Place of birth for the foreign-born population - Denmark (%)
Place of birth for the foreign-born population - Norway (%)
Place of birth for the foreign-born population - Sweden (%)
Place of birth for the foreign-born population - United Kingdom (%)
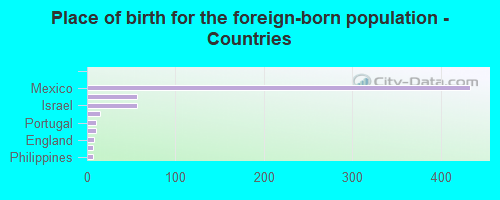
Place of birth for the foreign-born population - England (%)
Place of birth for the foreign-born population - Scotland (%)
Place of birth for the foreign-born population - Other Northern Europe (%)
Place of birth for the foreign-born population - Austria (%)
Place of birth for the foreign-born population - Belgium (%)
Place of birth for the foreign-born population - France (%)
Place of birth for the foreign-born population - Germany (%)
Place of birth for the foreign-born population - Netherlands (%)
Place of birth for the foreign-born population - Switzerland (%)
Place of birth for the foreign-born population - Other Western Europe (%)
Place of birth for the foreign-born population - Greece (%)
Place of birth for the foreign-born population - Italy (%)
Place of birth for the foreign-born population - Portugal (%)
Place of birth for the foreign-born population - Spain (%)
Place of birth for the foreign-born population - Other Southern Europe (%)
Place of birth for the foreign-born population - Albania (%)
Place of birth for the foreign-born population - Belarus (%)
Place of birth for the foreign-born population - Bosnia and Herzegovina (%)
Place of birth for the foreign-born population - Bulgaria (%)
Place of birth for the foreign-born population - Croatia (%)
Place of birth for the foreign-born population - Czechoslovakia (%)
Place of birth for the foreign-born population - Hungary (%)
Place of birth for the foreign-born population - Latvia (%)
Place of birth for the foreign-born population - Lithuania (%)
Place of birth for the foreign-born population - North Macedonia (Macedonia) (%)
Place of birth for the foreign-born population - Moldova (%)
Place of birth for the foreign-born population - Poland (%)
Place of birth for the foreign-born population - Romania (%)
Place of birth for the foreign-born population - Russia (%)
Place of birth for the foreign-born population - Serbia (%)
Place of birth for the foreign-born population - Ukraine (%)
Place of birth for the foreign-born population - Other Eastern Europe (%)
Place of birth for the foreign-born population - China (%)
Place of birth for the foreign-born population - Hong Kong (%)
Place of birth for the foreign-born population - Taiwan (%)
Place of birth for the foreign-born population - Japan (%)
Place of birth for the foreign-born population - Korea (%)
Place of birth for the foreign-born population - Other Eastern Asia (%)
Place of birth for the foreign-born population - Afghanistan (%)
Place of birth for the foreign-born population - Bangladesh (%)
Place of birth for the foreign-born population - India (%)
Place of birth for the foreign-born population - Iran (%)
Place of birth for the foreign-born population - Kazakhstan (%)
Place of birth for the foreign-born population - Nepal (%)
Place of birth for the foreign-born population - Pakistan (%)
Place of birth for the foreign-born population - Sri Lanka (%)
Place of birth for the foreign-born population - Uzbekistan (%)
Place of birth for the foreign-born population - Other South Central Asia (%)
Place of birth for the foreign-born population - Burma (%)
Place of birth for the foreign-born population - Cambodia (%)
Place of birth for the foreign-born population - Indonesia (%)
Place of birth for the foreign-born population - Laos (%)
Place of birth for the foreign-born population - Malaysia (%)
Place of birth for the foreign-born population - Philippines (%)
Place of birth for the foreign-born population - Singapore (%)
Place of birth for the foreign-born population - Thailand (%)
Place of birth for the foreign-born population - Vietnam (%)
Place of birth for the foreign-born population - Other South Eastern Asia (%)
Place of birth for the foreign-born population - Armenia (%)
Place of birth for the foreign-born population - Iraq (%)
Place of birth for the foreign-born population - Israel (%)
Place of birth for the foreign-born population - Jordan (%)
Place of birth for the foreign-born population - Kuwait (%)
Place of birth for the foreign-born population - Lebanon (%)
Place of birth for the foreign-born population - Saudi Arabia (%)
Place of birth for the foreign-born population - Syria (%)
Place of birth for the foreign-born population - Turkey (%)
Place of birth for the foreign-born population - Yemen (%)
Place of birth for the foreign-born population - Other Western Asia (%)
Place of birth for the foreign-born population - Eritrea (%)
Place of birth for the foreign-born population - Ethiopia (%)
Place of birth for the foreign-born population - Kenya (%)
Place of birth for the foreign-born population - Somalia (%)
Place of birth for the foreign-born population - Uganda (%)
Place of birth for the foreign-born population - Zimbabwe (%)
Place of birth for the foreign-born population - Other Eastern Africa (%)
Place of birth for the foreign-born population - Cameroon (%)
Place of birth for the foreign-born population - Congo (%)
Place of birth for the foreign-born population - Democratic Republic of Congo (Zaire) (%)
Place of birth for the foreign-born population - Other Middle Africa (%)
Place of birth for the foreign-born population - Egypt (%)
Place of birth for the foreign-born population - Morocco (%)
Place of birth for the foreign-born population - Sudan (%)
Place of birth for the foreign-born population - Other Northern Africa (%)
Place of birth for the foreign-born population - South Africa (%)
Place of birth for the foreign-born population - Other Southern Africa (%)
Place of birth for the foreign-born population - Cabo Verde (%)
Place of birth for the foreign-born population - Ghana (%)
Place of birth for the foreign-born population - Liberia (%)
Place of birth for the foreign-born population - Nigeria (%)
Place of birth for the foreign-born population - Senegal (%)
Place of birth for the foreign-born population - Sierra Leone (%)
Place of birth for the foreign-born population - Other Western Africa (%)
Place of birth for the foreign-born population - Australia (%)
Place of birth for the foreign-born population - New Zealand (%)
Place of birth for the foreign-born population - Fiji (%)
Place of birth for the foreign-born population - Micronesia (%)
Place of birth for the foreign-born population - Bahamas (%)
Place of birth for the foreign-born population - Barbados (%)
Place of birth for the foreign-born population - Cuba (%)
Place of birth for the foreign-born population - Dominica (%)
Place of birth for the foreign-born population - Dominican Republic (%)
Place of birth for the foreign-born population - Grenada (%)
Place of birth for the foreign-born population - Haiti (%)
Place of birth for the foreign-born population - Jamaica (%)
Place of birth for the foreign-born population - St. Vincent and the Grenadines (%)
Place of birth for the foreign-born population - Trinidad and Tobago (%)
Place of birth for the foreign-born population - West Indies (%)
Place of birth for the foreign-born population - Other Caribbean (%)
Place of birth for the foreign-born population - Belize (%)
Place of birth for the foreign-born population - Costa Rica (%)
Place of birth for the foreign-born population - El Salvador (%)
Place of birth for the foreign-born population - Guatemala (%)
Place of birth for the foreign-born population - Honduras (%)
Place of birth for the foreign-born population - Mexico (%)
Place of birth for the foreign-born population - Nicaragua (%)
Place of birth for the foreign-born population - Panama (%)
Place of birth for the foreign-born population - Other Central America (%)
Place of birth for the foreign-born population - Argentina (%)
Place of birth for the foreign-born population - Bolivia (%)
Place of birth for the foreign-born population - Brazil (%)
Place of birth for the foreign-born population - Chile (%)
Place of birth for the foreign-born population - Colombia (%)
Place of birth for the foreign-born population - Ecuador (%)
Place of birth for the foreign-born population - Guyana (%)
Place of birth for the foreign-born population - Peru (%)
Place of birth for the foreign-born population - Uruguay (%)
Place of birth for the foreign-born population - Venezuela (%)
Place of birth for the foreign-born population - Other South America (%)
Place of birth for the foreign-born population - Canada (%)
Place of birth for the foreign-born population - Other Northern America (%)
Place of birth for the foreign-born population - Other (%)
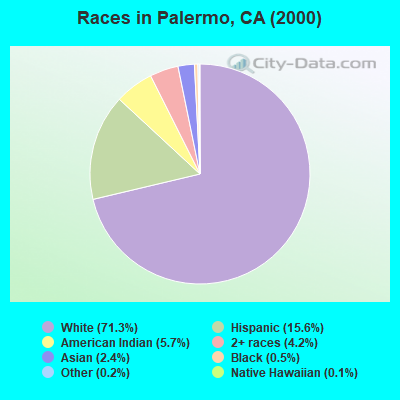
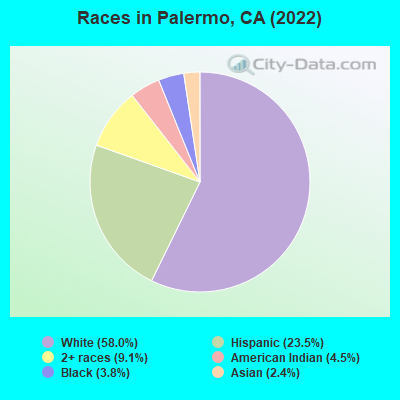
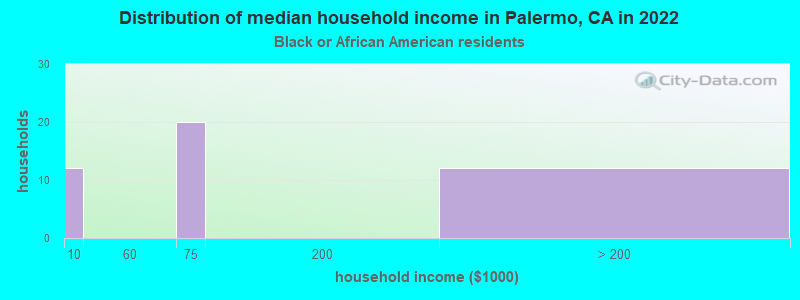
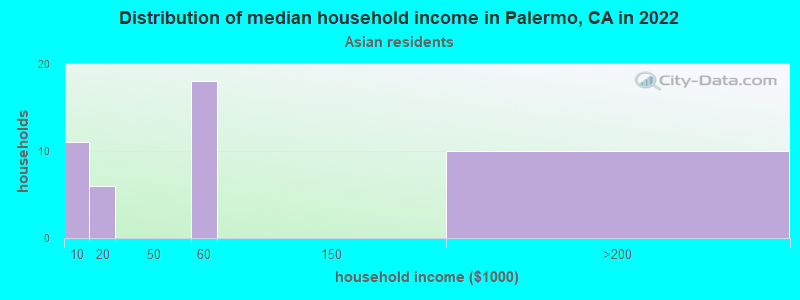
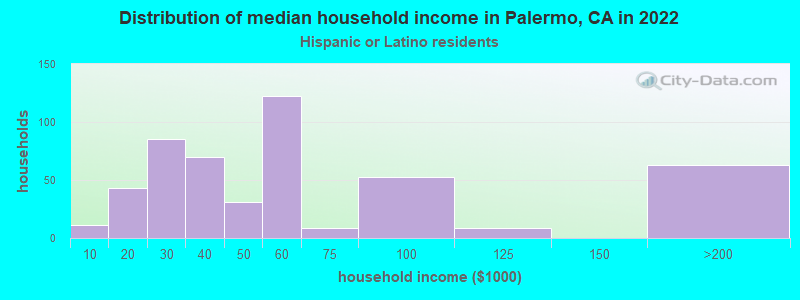
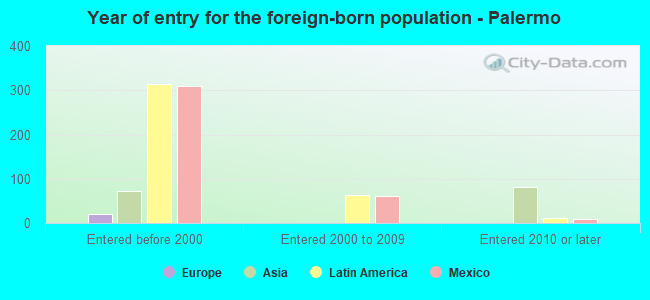
According to 2022 data, the most numerous races in Palermo, CA are Hispanic (1,567 residents), White alone (2,851 residents), and Asian alone (219 residents). 73.4% of Palermo residents speak English at home. 11.3% of Palermo, CA residents are foreign-born (7.9% born in Latin America, 2.5% born in Asia), which is 129.6% less than the foreign-born rate of 26.0% across the entire state of California.
Race distribution in Palermo
2000 2022
15,816,790 46.7% White alone 10,966,556 32.4% Hispanic 3,648,860 10.8% Asian alone 2,181,926 6.4% Black alone 903,115 2.7% Two or more races 178,984 0.5% American Indian alone 103,736 0.3% Native Hawaiian and Other 71,681 0.2% Other race alone
15,732,184 40.3% Hispanic 13,160,426 33.7% White alone 5,957,867 15.3% Asian alone 2,025,218 5.2% Black alone 1,663,222 4.3% Two or more races 251,618 0.6% Other race alone 135,777 0.3% Native Hawaiian and Other 103,030 0.3% American Indian alone
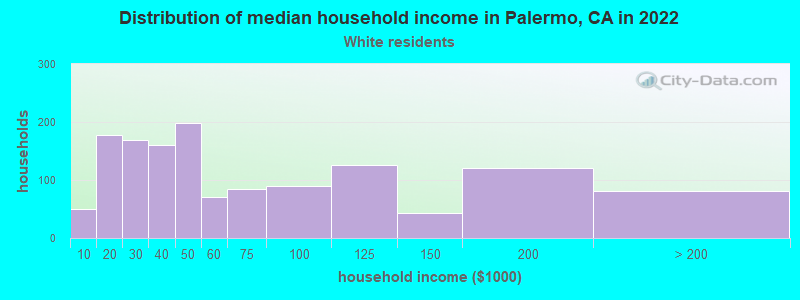
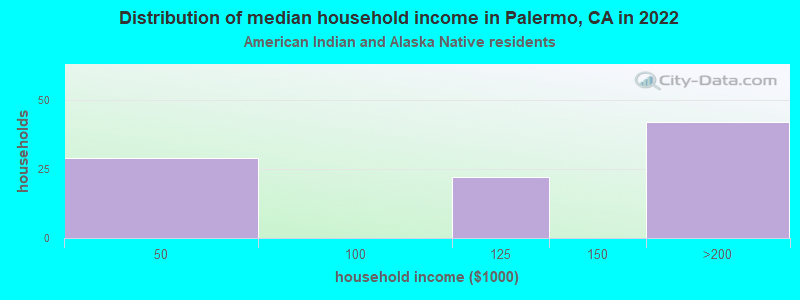
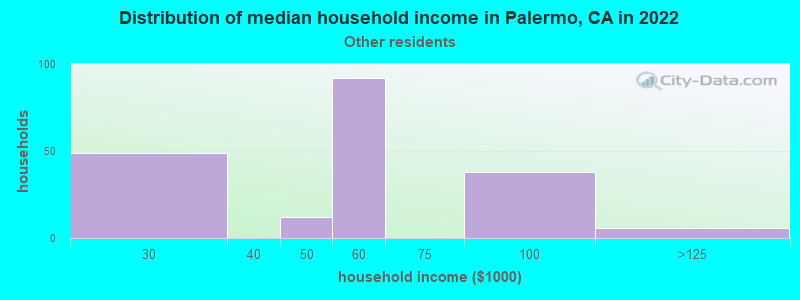
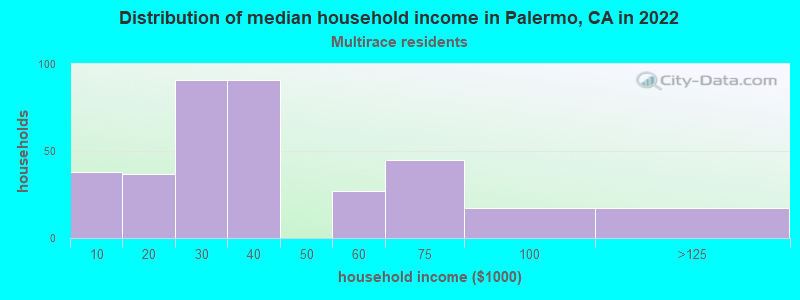
Income and house value in Palermo Median household income in 2022 $57,627 White non-Hispanic householders$38,617 Black householders$11,386 American Indian and Alaska Native householders$143,029 Asian householders$87,905 Some other race householders$74,407 Two or more races householders$71,494 Hispanic or Latino race householdersMedian 2022 house value $354,530 White Non-Hispanic householders$240,073 American Indian or Alaska Native householders $425,796 Asian householders$233,954 Some other race householders$294,062 Two or more races householders$238,993 Hispanic or Latino householders
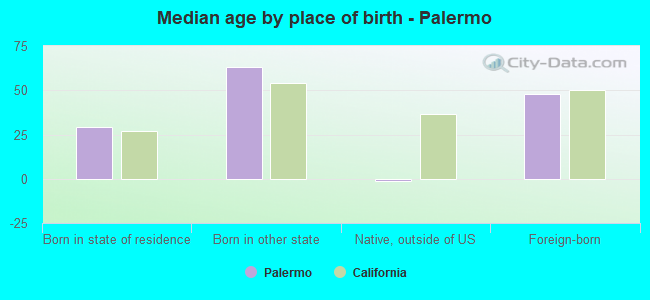
Median age by race in Palermo
42.7 Median age for White residents41.3 42.8 50.0 Median age for Black or African American residents52.7 72.7 45.0 Median age for American Indian / Alaska Native residents68.8 22.9 34.5 Median age for Asian residents30.1 41.7 26.5 Median age for Other race residents21.1 28.6 33.4 Median age for Two or more races residents32.8 47.8 49.9 Median age for White alone residents48.6 49.8 24.6 Median age for Hispanic or Latino residents24.1 29.2
Owner/renter occupied households by race in Palermo
House owners and renters - White residents 949 79.4% Owner occupied246 20.6% Renter occupiedHouse owners and renters - Black or African American residents 22 100.0% Owner occupiedHouse owners and renters - American Indian / Alaska Native residents 48 70.1% Owner occupied21 29.9% Renter occupiedHouse owners and renters - Asian residents 59 87.5% Owner occupied8 12.5% Renter occupiedHouse owners and renters - Other race residents 172 78.8% Owner occupied46 21.2% Renter occupiedHouse owners and renters - Two or more races residents 313 89.5% Owner occupied37 10.5% Renter occupiedHouse owners and renters - White alone residents 873 78.5% Owner occupied239 21.5% Renter occupiedHouse owners and renters - Hispanic or Latino residents 367 80.2% Owner occupied91 19.8% Renter occupied
Language usage in Palermo
English speakers - Total 73.4% of residents of Palermo speak English at home.
20.4% of residents speak Spanish at home 427 40.7% Speak English very well621 59.3% Speak English less than very well6.1% of residents speak other language at home 255 81.2% Speak English very well59 18.8% Speak English less than very well
English speakers - Born in the United States 93.2% of residents of Palermo speak English at home.
7.0% of residents speak other language at home 70 100.0% Speak English very well
English speakers - Native, born elsewhere 15.2% of residents of Palermo speak English at home.
87.9% of residents speak Spanish at home 29 100.0% Speak English very well
English speakers - Foreign-born 5.9% of residents of Palermo speak English at home.
69.4% of residents speak Spanish at home 43 10.7% Speak English very well360 89.3% Speak English less than very well22.0% of residents speak other language at home 83 64.8% Speak English very well45 35.2% Speak English less than very well
White (Caucasian) - Speak only English Native:
91.7% (2,639)Foreign-born:
5.1% (12)
White (Caucasian) - Speak another language Native:
11.7% (336)Foreign-born:
96.0% (226)
Asian - Speak only English Native:
8.5% (16)Foreign-born:
17.4% (9)
Asian - Speak another language Native:
69.5% (134)Foreign-born:
84.2% (45)
Other race - Speak only English Native:
42.0% (183)Foreign-born:
3.4% (7)
Other race - Speak another language Native:
57.4% (249)Foreign-born:
95.7% (191)
White alone - Speak only English Native:
98.0% (2,630)Foreign-born:
20.4% (13)
White alone - Speak another language Native:
1.9% (50)Foreign-born:
87.0% (55)
Hispanic or Latino - Speak only English Native:
30.6% (301)Foreign-born:
1.2% (6)
Hispanic or Latino - Speak another language Native:
72.3% (710)Foreign-born:
99.3% (493)
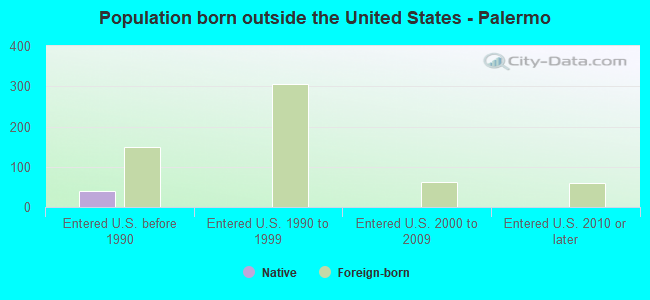
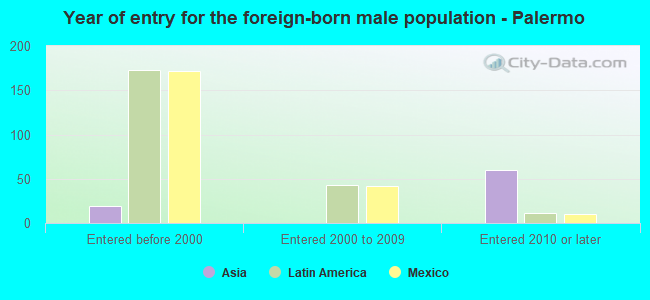
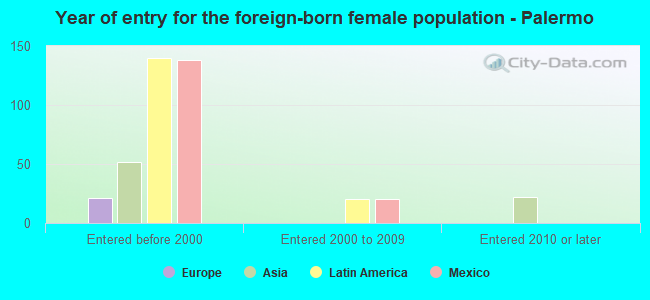
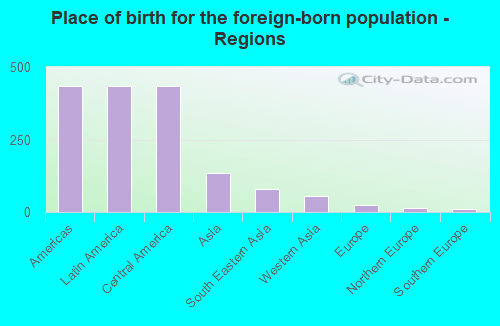
Foreign-born residents in Palermo 594 residents are foreign born (7.9% Latin America , 2.5% Asia ).
This city:
11.3%California:
100.0%
Marital status for residents in Palermo Marital status - White (Caucasian) population 15 years and over
Males 32.9% Never married51.1% Now married2.4% Separated2.2% Widowed11.4% DivorcedFemales 23.0% Never married57.1% Now married3.2% Separated6.5% Widowed10.2% DivorcedWomen who gave birth in the past 12 months Now married:
61.1% (8)Unmarried:
38.9% (5)
Women who did not give birth in the past 12 months Now married:
59.9% (339)Unmarried:
40.1% (227)
Marital status - Black or African American population 15 years and over
Males 18.8% Never married81.3% Now married0.0% Separated0.0% Widowed0.0% DivorcedFemales 0.0% Never married23.8% Now married0.0% Separated76.2% Widowed0.0% DivorcedMarital status - American Indian / Alaska Native population 15 years and over
Males 15.4% Never married50.0% Now married0.0% Separated34.6% Widowed0.0% DivorcedFemales 0.0% Never married34.6% Now married0.0% Separated20.2% Widowed45.2% DivorcedWomen who did not give birth in the past 12 months Now married:
7.8% (6)Unmarried:
92.2% (68)
Marital status - Asian population 15 years and over
Males 74.4% Never married25.6% Now married0.0% Separated0.0% Widowed0.0% DivorcedFemales 16.7% Never married37.2% Now married10.3% Separated26.9% Widowed9.0% DivorcedWomen who gave birth in the past 12 months Now married:
100.0% (15)Unmarried:
0.0% (0)
Women who did not give birth in the past 12 months Now married:
53.6% (17)Unmarried:
46.4% (14)
Marital status - Other race population 15 years and over
Males 31.1% Never married46.4% Now married13.6% Separated8.9% Widowed0.0% DivorcedFemales 44.8% Never married44.8% Now married6.5% Separated3.9% Widowed0.0% DivorcedWomen who gave birth in the past 12 months Now married:
100.0% (38)Unmarried:
0.0% (0)
Women who did not give birth in the past 12 months Now married:
24.2% (28)Unmarried:
75.8% (87)
Marital status - Two or more races population 15 years and over
Males 65.7% Never married13.7% Now married17.6% Separated2.9% Widowed0.0% DivorcedFemales 45.7% Never married14.1% Now married18.5% Separated0.0% Widowed21.7% DivorcedWomen who gave birth in the past 12 months Now married:
0.0% (0)Unmarried:
100.0% (33)
Women who did not give birth in the past 12 months Now married:
59.6% (83)Unmarried:
40.4% (56)
Marital status - White alone, not Hispanic / Latino population 15 years and over
Males 27.6% Never married54.7% Now married3.0% Separated2.8% Widowed12.0% DivorcedFemales 22.8% Never married54.3% Now married3.9% Separated7.9% Widowed11.0% DivorcedWomen who gave birth in the past 12 months Now married:
100.0% (2)Unmarried:
0.0% (0)
Women who did not give birth in the past 12 months Now married:
56.9% (272)Unmarried:
43.1% (206)
Marital status - Hispanic or Latino population 15 years and over
Males 45.2% Never married40.4% Now married5.4% Separated3.6% Widowed5.4% DivorcedFemales 31.0% Never married61.2% Now married2.4% Separated1.4% Widowed4.0% DivorcedWomen who gave birth in the past 12 months Now married:
84.8% (41)Unmarried:
15.2% (7)
Women who did not give birth in the past 12 months Now married:
54.5% (176)Unmarried:
45.5% (147)
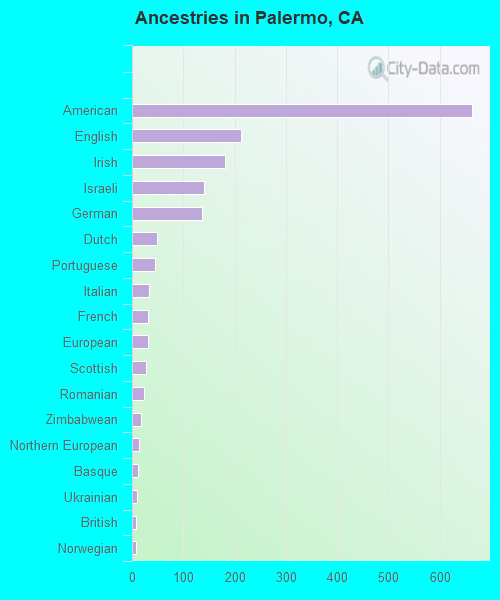
Ancestries in Palermo
664 22.3% American176 5.9% Irish170 5.7% German72 2.4% Israeli64 2.1% English46 1.5% Italian33 1.1% French27 0.9% Portuguese25 0.8% Scottish22 0.7% European16 0.5% British9 0.3% Greek8 0.3% Czech7 0.2% Belgian6 0.2% Russian
Children Nativity (place of birth) in Palermo
Children under 6 years - Living with two parents Both parents native 139 100.0% NativeBoth parents foreign-born 18 100.0% NativeOne native, one foreign-born parent 22 100.0% NativeChildren under 6 years - Living with one parent Native parent 125 100.0% NativeChildren 6 to 17 years - Living with two parents Both parents native 330 100.0% NativeBoth parents foreign-born 242 100.0% NativeOne native, one foreign-born parent 20 31.6% Native43 68.4% Foreign-bornChildren 6 to 17 years - Living with one parent Native parent 316 100.0% NativeForeign-born parent 96 50.0% Native96 50.0% Foreign-born
Grandparents responsible for own grandchildren in Palermo
Grandparents (30 to 59 years) American Indian / Alaska Native 3 100.0% Responsible for grandchildrenOther race 7 100.0% Responsible for grandchildrenHispanic or Latino 6 100.0% Responsible for grandchildren
Grandparents (60 years and over) American Indian / Alaska Native 11 100.0% Not responsible for grandchildren