Races in Palm City, Florida (FL) Detailed Stats
Data:
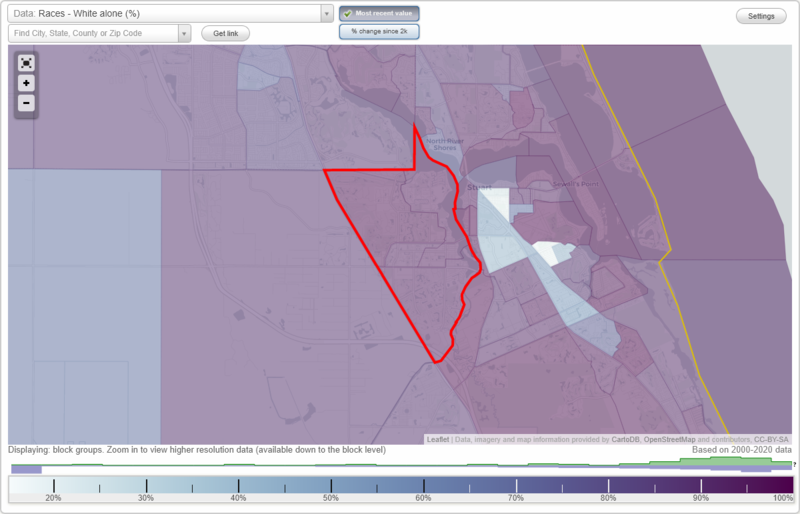
Races - White alone (%)
Races - White alone (% change since 2000)
Races - Black alone (%)
Races - Black alone (% change since 2000)
Races - American Indian alone (%)
Races - American Indian alone (% change since 2000)
Races - Asian alone (%)
Races - Asian alone (% change since 2000)
Races - Hispanic (%)
Races - Hispanic (% change since 2000)
Races - Native Hawaiian and Other Pacific Islander alone (%)
Races - Native Hawaiian and Other Pacific Islander alone (% change since 2000)
Races - Two or more races(%)
Races - Two or more races(% change since 2000)
Races - Other race alone (%)
Races - Other race alone (% change since 2000)
Racial diversity
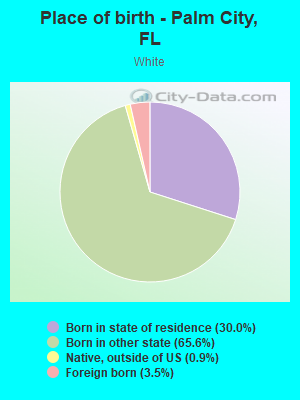
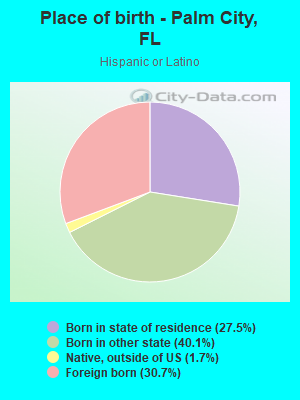
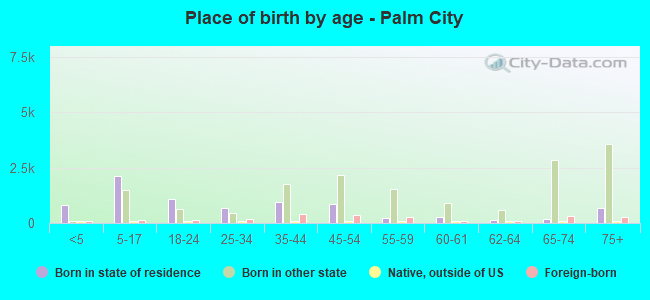
Place of birth - Born in state of residence (%)
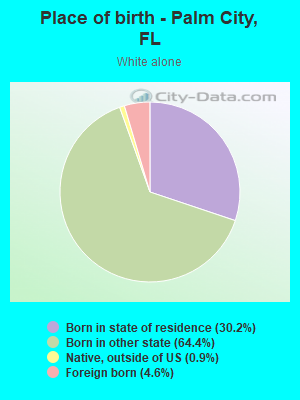
Place of birth - Born in state of residence (%) - White
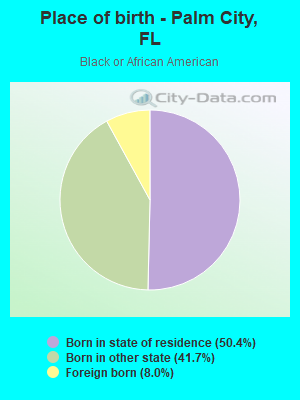
Place of birth - Born in state of residence (%) - Black or African American
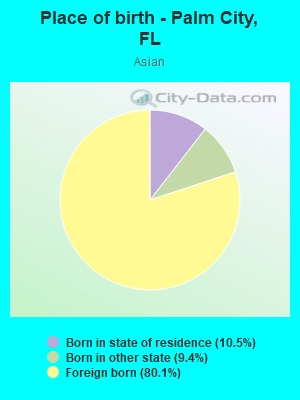
Place of birth - Born in state of residence (%) - Asian
Place of birth - Born in state of residence (%) - Hispanic or Latino
Place of birth - Born in state of residence (%) - American Indian and Alaska Native
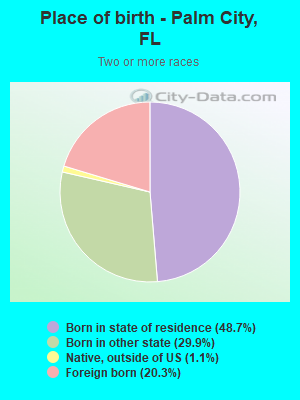
Place of birth - Born in state of residence (%) - Multirace
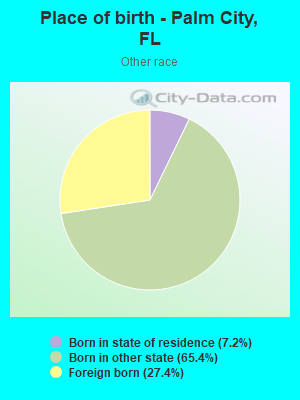
Place of birth - Born in state of residence (%) - Other Race
Place of birth - Born in other state (%)
Place of birth - Born in other state (%) - White
Place of birth - Born in other state (%) - Black or African American
Place of birth - Born in other state (%) - Asian
Place of birth - Born in other state (%) - Hispanic or Latino
Place of birth - Born in other state (%) - American Indian and Alaska Native
Place of birth - Born in other state (%) - Multirace
Place of birth - Born in other state (%) - Other Race
Place of birth - Native, outside of US (%)
Place of birth - Native, outside of US (%) - White
Place of birth - Native, outside of US (%) - Black or African American
Place of birth - Native, outside of US (%) - Asian
Place of birth - Native, outside of US (%) - Hispanic or Latino
Place of birth - Native, outside of US (%) - American Indian and Alaska Native
Place of birth - Native, outside of US (%) - Multirace
Place of birth - Native, outside of US (%) - Other Race
Place of birth - Foreign born (%)
Place of birth - Foreign born (%) - White
Place of birth - Foreign born (%) - Black or African American
Place of birth - Foreign born (%) - Asian
Place of birth - Foreign born (%) - Hispanic or Latino
Place of birth - Foreign born (%) - American Indian and Alaska Native
Place of birth - Foreign born (%) - Multirace
Place of birth - Foreign born (%) - Other Race
Residents speaking English at home (%)
Residents speaking English at home - Born in the United States (%)
Residents speaking English at home - Native, born elsewhere (%)
Residents speaking English at home - Foreign born (%)
Residents speaking Spanish at home (%)
Residents speaking Spanish at home - Born in the United States (%)
Residents speaking Spanish at home - Native, born elsewhere (%)
Residents speaking Spanish at home - Foreign born (%)
Residents speaking other language at home (%)
Residents speaking other language at home - Born in the United States (%)
Residents speaking other language at home - Native, born elsewhere (%)
Residents speaking other language at home - Foreign born (%)
Marital status - Never married (%)
Marital status - Now married (%)
Marital status - Separated (%)
Marital status - Widowed (%)
Marital status - Divorced (%)
Ancestries Reported - Arab (%)
Ancestries Reported - Czech (%)
Ancestries Reported - Danish (%)
Ancestries Reported - Dutch (%)
Ancestries Reported - English (%)
Ancestries Reported - French (%)
Ancestries Reported - French Canadian (%)
Ancestries Reported - German (%)
Ancestries Reported - Greek (%)
Ancestries Reported - Hungarian (%)
Ancestries Reported - Irish (%)
Ancestries Reported - Italian (%)
Ancestries Reported - Lithuanian (%)
Ancestries Reported - Norwegian (%)
Ancestries Reported - Polish (%)
Ancestries Reported - Portuguese (%)
Ancestries Reported - Russian (%)
Ancestries Reported - Scotch-Irish (%)
Ancestries Reported - Scottish (%)
Ancestries Reported - Slovak (%)
Ancestries Reported - Subsaharan African (%)
Ancestries Reported - Swedish (%)
Ancestries Reported - Swiss (%)
Ancestries Reported - Ukrainian (%)
Ancestries Reported - United States (%)
Ancestries Reported - Welsh (%)
Ancestries Reported - West Indian (%)
Ancestries Reported - Other (%)
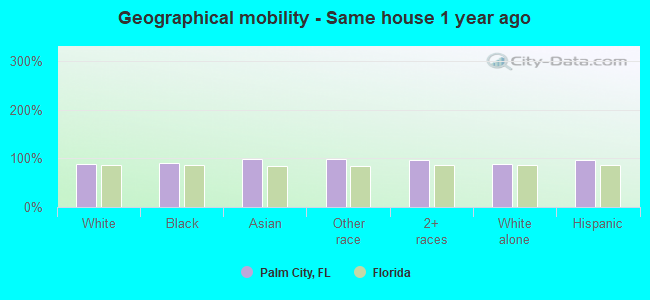
Geographical mobility - Same house 1 year ago (%)
Geographical mobility - Same house 1 year ago (%) - White
Geographical mobility - Same house 1 year ago (%) - Black or African American
Geographical mobility - Same house 1 year ago (%) - Asian
Geographical mobility - Same house 1 year ago (%) - Hispanic or Latino
Geographical mobility - Same house 1 year ago (%) - American Indian and Alaska Native
Geographical mobility - Same house 1 year ago (%) - Multirace
Geographical mobility - Same house 1 year ago (%) - Other Race
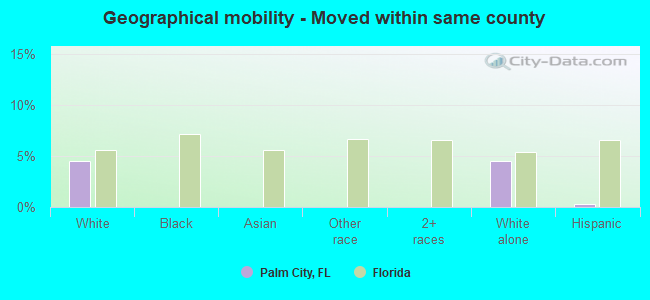
Geographical mobility - Moved within same county (%)
Geographical mobility - Moved within same county (%) - White
Geographical mobility - Moved within same county (%) - Black or African American
Geographical mobility - Moved within same county (%) - Asian
Geographical mobility - Moved within same county (%) - Hispanic or Latino
Geographical mobility - Moved within same county (%) - American Indian and Alaska Native
Geographical mobility - Moved within same county (%) - Multirace
Geographical mobility - Moved within same county (%) - Other Race
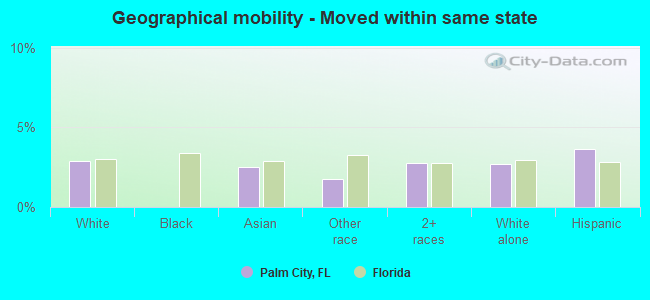
Geographical mobility - Moved from different county within same state (%)
Geographical mobility - Moved from different county within same state (%) - White
Geographical mobility - Moved from different county within same state (%) - Black or African American
Geographical mobility - Moved from different county within same state (%) - Asian
Geographical mobility - Moved from different county within same state (%) - Hispanic or Latino
Geographical mobility - Moved from different county within same state (%) - American Indian and Alaska Native
Geographical mobility - Moved from different county within same state (%) - Multirace
Geographical mobility - Moved from different county within same state (%) - Other Race
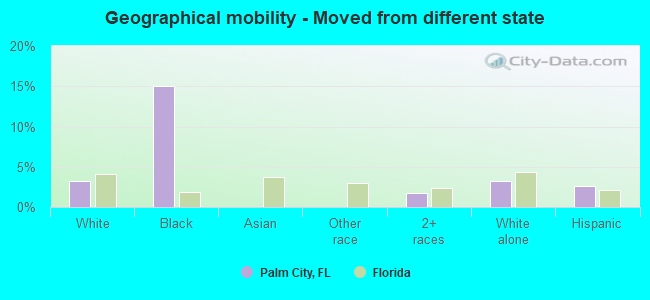
Geographical mobility - Moved from different state (%)
Geographical mobility - Moved from different state (%) - White
Geographical mobility - Moved from different state (%) - Black or African American
Geographical mobility - Moved from different state (%) - Asian
Geographical mobility - Moved from different state (%) - Hispanic or Latino
Geographical mobility - Moved from different state (%) - American Indian and Alaska Native
Geographical mobility - Moved from different state (%) - Multirace
Geographical mobility - Moved from different state (%) - Other Race
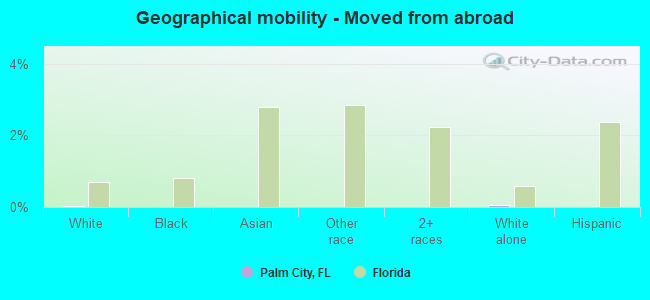
Geographical mobility - Moved from abroad (%)
Geographical mobility - Moved from abroad (%) - White
Geographical mobility - Moved from abroad (%) - Black or African American
Geographical mobility - Moved from abroad (%) - Asian
Geographical mobility - Moved from abroad (%) - Hispanic or Latino
Geographical mobility - Moved from abroad (%) - American Indian and Alaska Native
Geographical mobility - Moved from abroad (%) - Multirace
Geographical mobility - Moved from abroad (%) - Other Race
Place of birth for the foreign-born population - Ireland (%)
Place of birth for the foreign-born population - Denmark (%)
Place of birth for the foreign-born population - Norway (%)
Place of birth for the foreign-born population - Sweden (%)
Place of birth for the foreign-born population - United Kingdom (%)
Place of birth for the foreign-born population - England (%)
Place of birth for the foreign-born population - Scotland (%)
Place of birth for the foreign-born population - Other Northern Europe (%)
Place of birth for the foreign-born population - Austria (%)
Place of birth for the foreign-born population - Belgium (%)
Place of birth for the foreign-born population - France (%)
Place of birth for the foreign-born population - Germany (%)
Place of birth for the foreign-born population - Netherlands (%)
Place of birth for the foreign-born population - Switzerland (%)
Place of birth for the foreign-born population - Other Western Europe (%)
Place of birth for the foreign-born population - Greece (%)
Place of birth for the foreign-born population - Italy (%)
Place of birth for the foreign-born population - Portugal (%)
Place of birth for the foreign-born population - Spain (%)
Place of birth for the foreign-born population - Other Southern Europe (%)
Place of birth for the foreign-born population - Albania (%)
Place of birth for the foreign-born population - Belarus (%)
Place of birth for the foreign-born population - Bosnia and Herzegovina (%)
Place of birth for the foreign-born population - Bulgaria (%)
Place of birth for the foreign-born population - Croatia (%)
Place of birth for the foreign-born population - Czechoslovakia (%)
Place of birth for the foreign-born population - Hungary (%)
Place of birth for the foreign-born population - Latvia (%)
Place of birth for the foreign-born population - Lithuania (%)
Place of birth for the foreign-born population - North Macedonia (Macedonia) (%)
Place of birth for the foreign-born population - Moldova (%)
Place of birth for the foreign-born population - Poland (%)
Place of birth for the foreign-born population - Romania (%)
Place of birth for the foreign-born population - Russia (%)
Place of birth for the foreign-born population - Serbia (%)
Place of birth for the foreign-born population - Ukraine (%)
Place of birth for the foreign-born population - Other Eastern Europe (%)
Place of birth for the foreign-born population - China (%)
Place of birth for the foreign-born population - Hong Kong (%)
Place of birth for the foreign-born population - Taiwan (%)
Place of birth for the foreign-born population - Japan (%)
Place of birth for the foreign-born population - Korea (%)
Place of birth for the foreign-born population - Other Eastern Asia (%)
Place of birth for the foreign-born population - Afghanistan (%)
Place of birth for the foreign-born population - Bangladesh (%)
Place of birth for the foreign-born population - India (%)
Place of birth for the foreign-born population - Iran (%)
Place of birth for the foreign-born population - Kazakhstan (%)
Place of birth for the foreign-born population - Nepal (%)
Place of birth for the foreign-born population - Pakistan (%)
Place of birth for the foreign-born population - Sri Lanka (%)
Place of birth for the foreign-born population - Uzbekistan (%)
Place of birth for the foreign-born population - Other South Central Asia (%)
Place of birth for the foreign-born population - Burma (%)
Place of birth for the foreign-born population - Cambodia (%)
Place of birth for the foreign-born population - Indonesia (%)
Place of birth for the foreign-born population - Laos (%)
Place of birth for the foreign-born population - Malaysia (%)
Place of birth for the foreign-born population - Philippines (%)
Place of birth for the foreign-born population - Singapore (%)
Place of birth for the foreign-born population - Thailand (%)
Place of birth for the foreign-born population - Vietnam (%)
Place of birth for the foreign-born population - Other South Eastern Asia (%)
Place of birth for the foreign-born population - Armenia (%)
Place of birth for the foreign-born population - Iraq (%)
Place of birth for the foreign-born population - Israel (%)
Place of birth for the foreign-born population - Jordan (%)
Place of birth for the foreign-born population - Kuwait (%)
Place of birth for the foreign-born population - Lebanon (%)
Place of birth for the foreign-born population - Saudi Arabia (%)
Place of birth for the foreign-born population - Syria (%)
Place of birth for the foreign-born population - Turkey (%)
Place of birth for the foreign-born population - Yemen (%)
Place of birth for the foreign-born population - Other Western Asia (%)
Place of birth for the foreign-born population - Eritrea (%)
Place of birth for the foreign-born population - Ethiopia (%)
Place of birth for the foreign-born population - Kenya (%)
Place of birth for the foreign-born population - Somalia (%)
Place of birth for the foreign-born population - Uganda (%)
Place of birth for the foreign-born population - Zimbabwe (%)
Place of birth for the foreign-born population - Other Eastern Africa (%)
Place of birth for the foreign-born population - Cameroon (%)
Place of birth for the foreign-born population - Congo (%)
Place of birth for the foreign-born population - Democratic Republic of Congo (Zaire) (%)
Place of birth for the foreign-born population - Other Middle Africa (%)
Place of birth for the foreign-born population - Egypt (%)
Place of birth for the foreign-born population - Morocco (%)
Place of birth for the foreign-born population - Sudan (%)
Place of birth for the foreign-born population - Other Northern Africa (%)
Place of birth for the foreign-born population - South Africa (%)
Place of birth for the foreign-born population - Other Southern Africa (%)
Place of birth for the foreign-born population - Cabo Verde (%)
Place of birth for the foreign-born population - Ghana (%)
Place of birth for the foreign-born population - Liberia (%)
Place of birth for the foreign-born population - Nigeria (%)
Place of birth for the foreign-born population - Senegal (%)
Place of birth for the foreign-born population - Sierra Leone (%)
Place of birth for the foreign-born population - Other Western Africa (%)
Place of birth for the foreign-born population - Australia (%)
Place of birth for the foreign-born population - New Zealand (%)
Place of birth for the foreign-born population - Fiji (%)
Place of birth for the foreign-born population - Micronesia (%)
Place of birth for the foreign-born population - Bahamas (%)
Place of birth for the foreign-born population - Barbados (%)
Place of birth for the foreign-born population - Cuba (%)
Place of birth for the foreign-born population - Dominica (%)
Place of birth for the foreign-born population - Dominican Republic (%)
Place of birth for the foreign-born population - Grenada (%)
Place of birth for the foreign-born population - Haiti (%)
Place of birth for the foreign-born population - Jamaica (%)
Place of birth for the foreign-born population - St. Vincent and the Grenadines (%)
Place of birth for the foreign-born population - Trinidad and Tobago (%)
Place of birth for the foreign-born population - West Indies (%)
Place of birth for the foreign-born population - Other Caribbean (%)
Place of birth for the foreign-born population - Belize (%)
Place of birth for the foreign-born population - Costa Rica (%)
Place of birth for the foreign-born population - El Salvador (%)
Place of birth for the foreign-born population - Guatemala (%)
Place of birth for the foreign-born population - Honduras (%)
Place of birth for the foreign-born population - Mexico (%)
Place of birth for the foreign-born population - Nicaragua (%)
Place of birth for the foreign-born population - Panama (%)
Place of birth for the foreign-born population - Other Central America (%)
Place of birth for the foreign-born population - Argentina (%)
Place of birth for the foreign-born population - Bolivia (%)
Place of birth for the foreign-born population - Brazil (%)
Place of birth for the foreign-born population - Chile (%)
Place of birth for the foreign-born population - Colombia (%)
Place of birth for the foreign-born population - Ecuador (%)
Place of birth for the foreign-born population - Guyana (%)
Place of birth for the foreign-born population - Peru (%)
Place of birth for the foreign-born population - Uruguay (%)
Place of birth for the foreign-born population - Venezuela (%)
Place of birth for the foreign-born population - Other South America (%)
Place of birth for the foreign-born population - Canada (%)
Place of birth for the foreign-born population - Other Northern America (%)
Place of birth for the foreign-born population - Other (%)
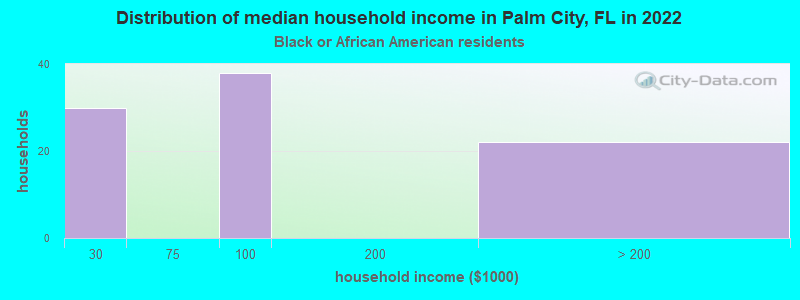
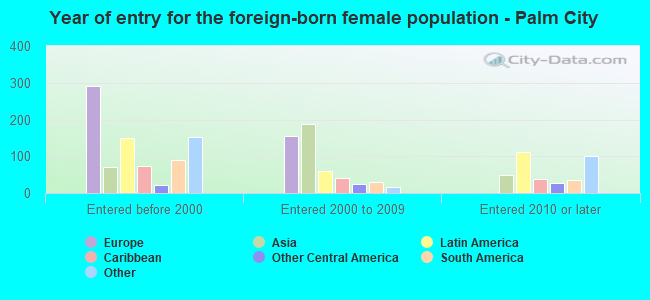
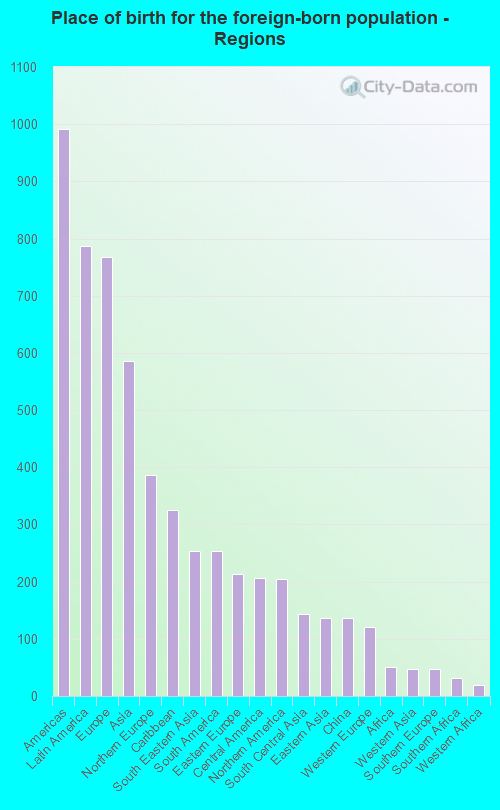
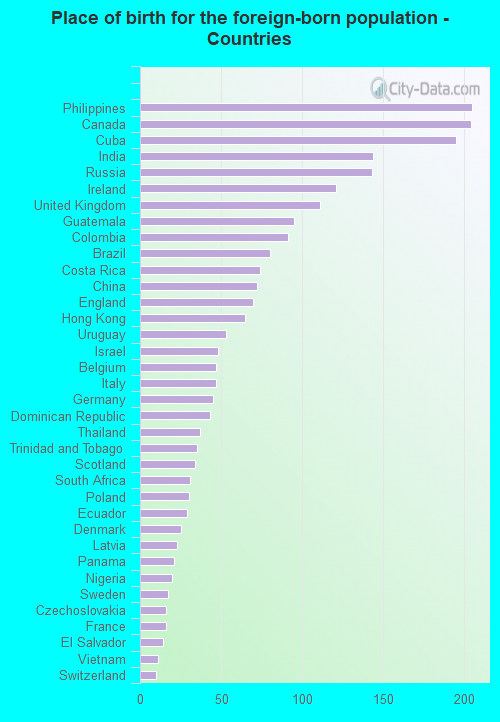
According to 2022 data, the most numerous races in Palm City, FL are White alone (22,152 residents), Hispanic (2,050 residents), and Black alone (210 residents). 91.6% of Palm City residents speak English at home. 9.1% of Palm City, FL residents are foreign-born (2.9% born in Latin America, 2.8% born in Europe, 2.1% born in Asia), which is 131.2% less than the foreign-born rate of 21.0% across the entire state of Florida.
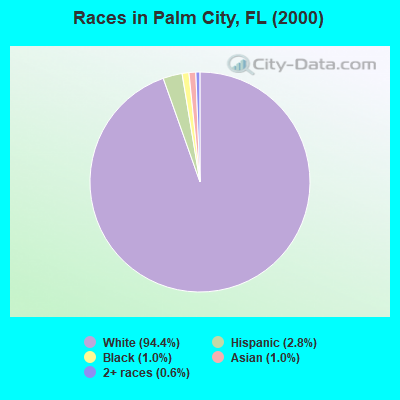
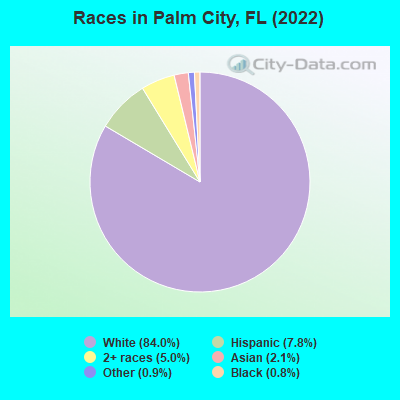
Race distribution in Palm City
2000 2022
10,458,509 65.4% White alone 2,682,715 16.8% Hispanic 2,264,268 14.2% Black alone 261,693 1.6% Asian alone 236,954 1.5% Two or more races 42,358 0.3% American Indian alone 28,994 0.2% Other race alone 6,887 0.04% Native Hawaiian and Other
11,309,403 50.8% White alone 6,025,039 27.1% Hispanic 3,241,015 14.6% Black alone 861,630 3.9% Two or more races 623,692 2.8% Asian alone 152,054 0.7% Other race alone 22,504 0.1% American Indian alone 9,486 0.04% Native Hawaiian and Other
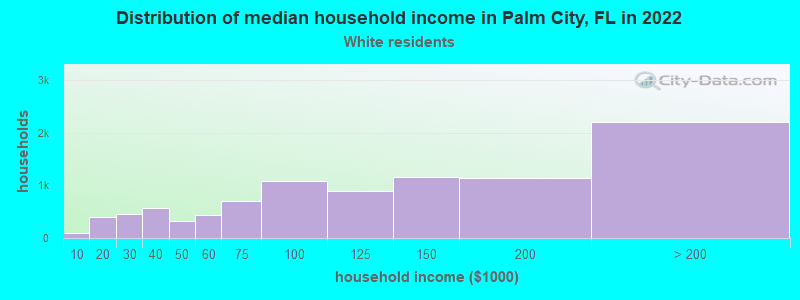
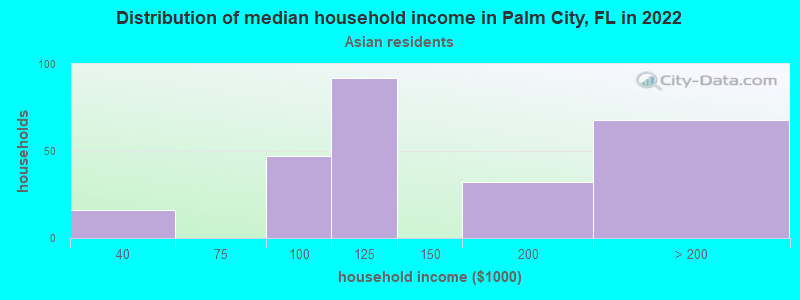
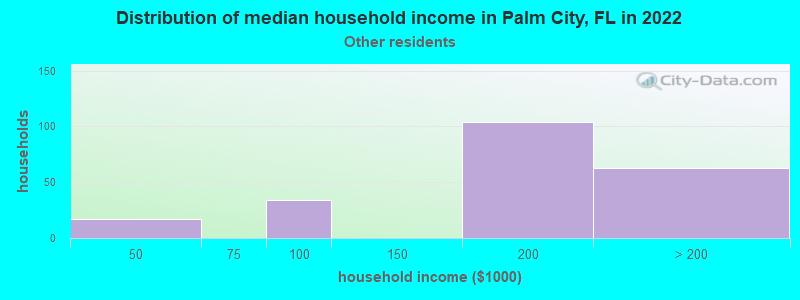
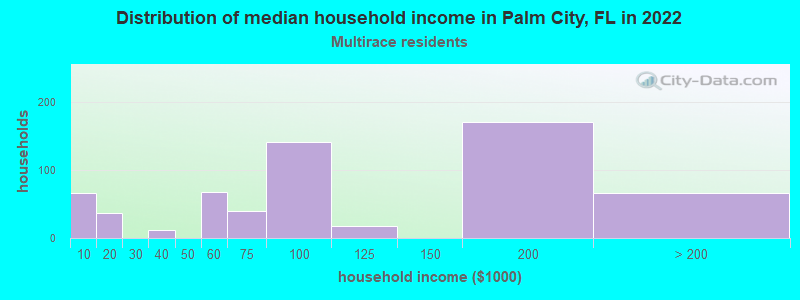
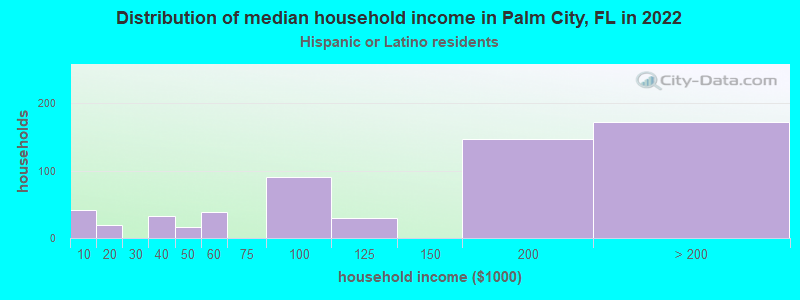
Income and house value in Palm City Median household income in 2022 $111,426 White non-Hispanic householders$98,163 Black householders$117,990 Asian householdersover $200,000 Some other race householders$79,571 Two or more races householders$177,255 Hispanic or Latino race householdersMedian 2022 house value $616,789 White Non-Hispanic householders$666,558 Black or African American householders $733,392 Asian householders$488,809 Two or more races householders$751,167 Hispanic or Latino householders
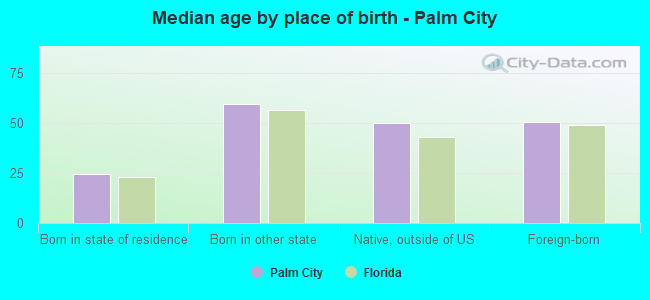
Median age by race in Palm City
54.8 Median age for White residents56.5 53.1 41.9 Median age for Black or African American residents29.9 64.8 -700,813,007.4 Median age for American Indian / Alaska Native residents-465,564,737.8 -924,867,723.9 50.5 Median age for Asian residents50.4 46.9 -666,666,666.0 Median age for Native Hawaiian / Pacific Islander residents-666,666,666.0 -666,666,666.0 32.1 Median age for Other race residents30.8 13.9 25.8 Median age for Two or more races residents27.5 33.3 54.2 Median age for White alone residents55.2 53.3 39.7 Median age for Hispanic or Latino residents40.2 36.5
Owner/renter occupied households by race in Palm City
House owners and renters - White residents 8,446 89.7% Owner occupied965 10.3% Renter occupiedHouse owners and renters - Black or African American residents 22 24.3% Owner occupied68 75.7% Renter occupiedHouse owners and renters - Asian residents 88 56.7% Owner occupied67 43.3% Renter occupiedHouse owners and renters - Other race residents 76 58.9% Owner occupied53 41.1% Renter occupiedHouse owners and renters - Two or more races residents 471 95.3% Owner occupied23 4.7% Renter occupiedHouse owners and renters - White alone residents 8,416 89.7% Owner occupied966 10.3% Renter occupiedHouse owners and renters - Hispanic or Latino residents 334 85.9% Owner occupied55 14.1% Renter occupied
Language usage in Palm City
English speakers - Total 91.6% of residents of Palm City speak English at home.
5.5% of residents speak Spanish at home 1,276 91.7% Speak English very well115 8.3% Speak English less than very well4.1% of residents speak other language at home 875 84.2% Speak English very well164 15.8% Speak English less than very well
English speakers - Born in the United States 96.2% of residents of Palm City speak English at home.
2.4% of residents speak Spanish at home 296 76.1% Speak English very well93 23.9% Speak English less than very well1.1% of residents speak other language at home 173 100.0% Speak English very well
All residents speak only English at home
English speakers - Foreign-born 42.3% of residents of Palm City speak English at home.
30.6% of residents speak Spanish at home 655 95.3% Speak English very well32 4.7% Speak English less than very well35.9% of residents speak other language at home 652 80.8% Speak English very well155 19.2% Speak English less than very well
White (Caucasian) - Speak only English Native:
97.8% (20,305)Foreign-born:
97.2% (753)
White (Caucasian) - Speak another language Native:
2.5% (523)Foreign-born:
25.1% (194)
Black or African American - Speak only English Native:
91.9% (207)Foreign-born:
97.0% (19)
Asian - Speak only English Native:
68.4% (118)Foreign-born:
17.7% (107)
Asian - Speak another language Native:
31.9% (55)Foreign-born:
82.4% (498)
Other race - Speak only English Native:
100.0% (395)Foreign-born:
29.6% (65)
Other race - Speak another language Native:
7.9% (31)Foreign-born:
72.7% (160)
Two or more races - Speak only English Native:
81.1% (1,525)Foreign-born:
13.3% (72)
Two or more races - Speak another language Native:
18.6% (349)Foreign-born:
77.9% (424)
White alone - Speak only English Native:
97.6% (20,076)Foreign-born:
75.6% (767)
White alone - Speak another language Native:
2.3% (470)Foreign-born:
26.9% (273)
Hispanic or Latino - Speak only English Native:
70.6% (876)Foreign-born:
15.4% (101)
Hispanic or Latino - Speak another language Native:
31.0% (384)Foreign-born:
81.8% (539)
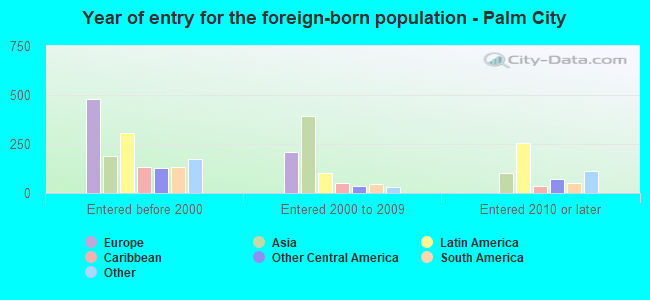
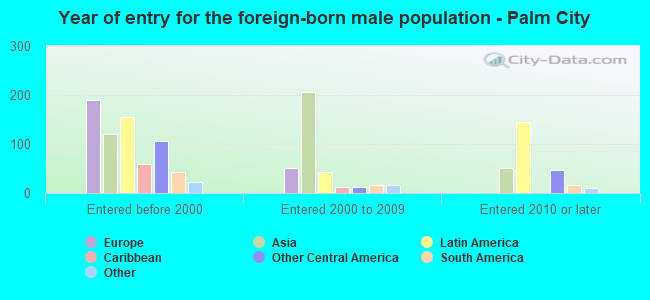
Foreign-born residents in Palm City 2,396 residents are foreign born (2.9% Latin America , 2.8% Europe , 2.1% Asia ).
This city:
9.1%Florida:
21.1%
Marital status for residents in Palm City Marital status - White (Caucasian) population 15 years and over
Males 19.2% Never married67.8% Now married1.0% Separated3.7% Widowed8.4% DivorcedFemales 17.6% Never married57.1% Now married1.3% Separated10.9% Widowed13.1% DivorcedWomen who gave birth in the past 12 months Now married:
100.0% (170)Unmarried:
0.0% (0)
Women who did not give birth in the past 12 months Now married:
51.5% (1,955)Unmarried:
48.5% (1,838)
Marital status - Black or African American population 15 years and over
Males 58.8% Never married27.2% Now married0.0% Separated0.0% Widowed14.0% DivorcedFemales 53.6% Never married38.1% Now married0.0% Separated0.0% Widowed8.2% DivorcedWomen who gave birth in the past 12 months Now married:
100.0% (23)Unmarried:
0.0% (0)
Women who did not give birth in the past 12 months Now married:
32.6% (14)Unmarried:
67.4% (29)
Marital status - Asian population 15 years and over
Males 3.6% Never married91.0% Now married0.0% Separated5.4% Widowed0.0% DivorcedFemales 31.6% Never married65.2% Now married0.0% Separated0.0% Widowed3.1% DivorcedWomen who gave birth in the past 12 months Now married:
100.0% (42)Unmarried:
0.0% (0)
Women who did not give birth in the past 12 months Now married:
58.6% (163)Unmarried:
41.4% (115)
Marital status - Other race population 15 years and over
Males 34.6% Never married65.4% Now married0.0% Separated0.0% Widowed0.0% DivorcedFemales 0.0% Never married93.1% Now married0.0% Separated0.0% Widowed6.9% DivorcedWomen who did not give birth in the past 12 months Now married:
90.9% (158)Unmarried:
9.1% (16)
Marital status - Two or more races population 15 years and over
Males 33.3% Never married61.0% Now married0.0% Separated0.0% Widowed5.7% DivorcedFemales 40.7% Never married56.0% Now married0.0% Separated0.0% Widowed3.3% DivorcedWomen who did not give birth in the past 12 months Now married:
50.5% (253)Unmarried:
49.5% (248)
Marital status - White alone, not Hispanic / Latino population 15 years and over
Males 19.3% Never married67.4% Now married1.0% Separated3.7% Widowed8.5% DivorcedFemales 17.1% Never married57.4% Now married1.2% Separated11.3% Widowed13.1% DivorcedWomen who gave birth in the past 12 months Now married:
100.0% (179)Unmarried:
0.0% (0)
Women who did not give birth in the past 12 months Now married:
52.3% (1,979)Unmarried:
47.7% (1,809)
Marital status - Hispanic or Latino population 15 years and over
Males 25.2% Never married69.5% Now married0.0% Separated0.0% Widowed5.3% DivorcedFemales 33.6% Never married52.7% Now married2.6% Separated0.0% Widowed11.1% DivorcedWomen who did not give birth in the past 12 months Now married:
46.0% (229)Unmarried:
54.0% (269)
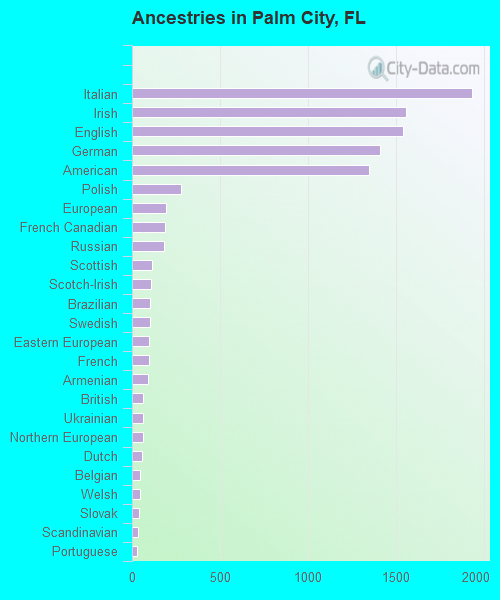
Ancestries in Palm City
1,934 16.5% Italian1,558 13.3% Irish1,541 13.1% English1,411 12.0% German1,348 11.5% American276 2.3% Polish195 1.7% European189 1.6% French Canadian181 1.5% Russian114 1.0% Scottish106 0.9% Scotch-Irish105 0.9% Brazilian103 0.9% Swedish97 0.8% Eastern European95 0.8% French89 0.8% Armenian64 0.5% British63 0.5% Ukrainian62 0.5% Northern European56 0.5% Dutch47 0.4% Belgian44 0.4% Welsh39 0.3% Slovak32 0.3% Scandinavian28 0.2% Portuguese27 0.2% Canadian26 0.2% Norwegian25 0.2% Lithuanian22 0.2% Jamaican20 0.2% Hungarian20 0.2% Iranian19 0.2% Haitian16 0.1% Croatian16 0.1% Finnish11 0.09% Swiss10 0.09% Czechoslovakian10 0.09% Czech8 0.07% Estonian
Children Nativity (place of birth) in Palm City
Children under 6 years - Living with two parents Both parents native 1,071 100.0% NativeBoth parents foreign-born 195 100.0% NativeOne native, one foreign-born parent 102 100.0% NativeChildren under 6 years - Living with one parent Native parent 62 100.0% NativeChildren 6 to 17 years - Living with two parents Both parents native 1,901 100.0% NativeBoth parents foreign-born 145 40.9% Native210 59.1% Foreign-bornOne native, one foreign-born parent 488 100.0% NativeChildren 6 to 17 years - Living with one parent Native parent 482 100.0% NativeForeign-born parent 9 49.6% Native9 50.4% Foreign-born
Grandparents responsible for own grandchildren in Palm City
Grandparents (30 to 59 years) White / Caucasian 109 100.0% Responsible for grandchildrenWhite alone, not Hispanic / Latino 128 100.0% Responsible for grandchildrenGrandparents (60 years and over) White / Caucasian 97 34.7% Responsible for grandchildren182 65.3% Not responsible for grandchildrenWhite alone, not Hispanic / Latino 118 37.8% Responsible for grandchildren193 62.2% Not responsible for grandchildren