Races in Pauls Valley, Oklahoma (OK) Detailed Stats
Data:
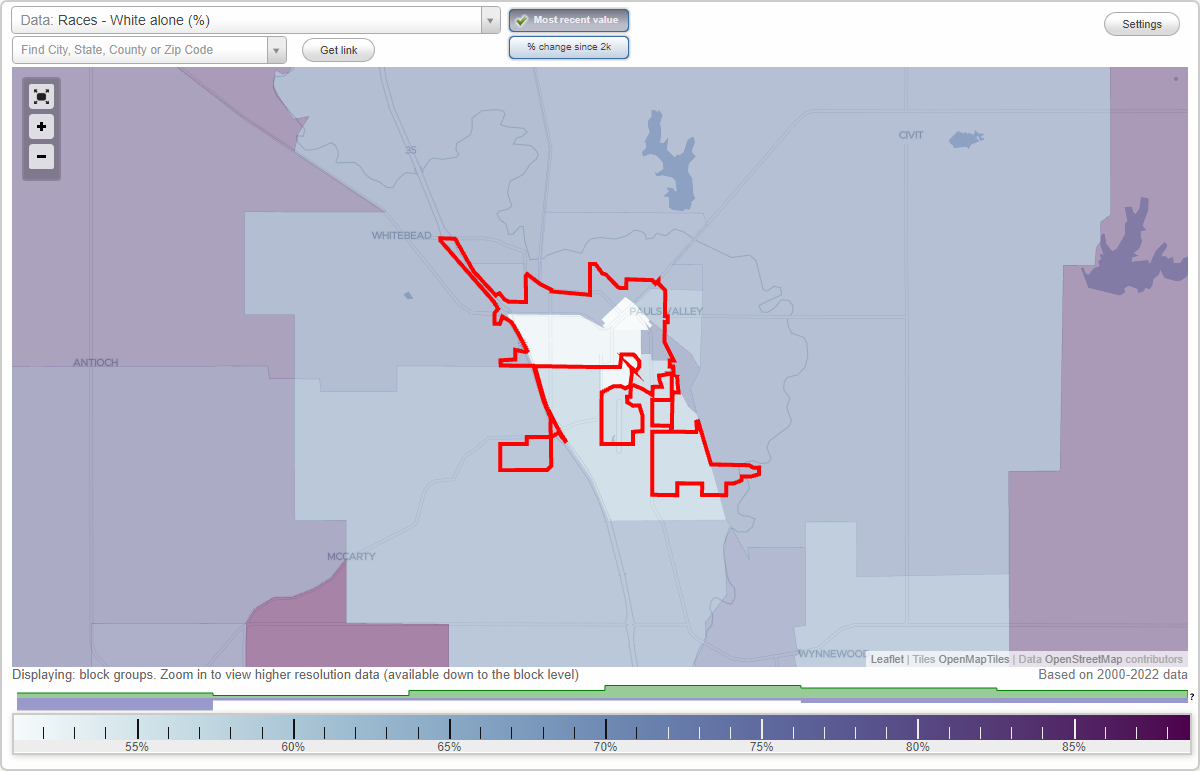
Races - White alone (%)
Races - White alone (% change since 2000)
Races - Black alone (%)
Races - Black alone (% change since 2000)
Races - American Indian alone (%)
Races - American Indian alone (% change since 2000)
Races - Asian alone (%)
Races - Asian alone (% change since 2000)
Races - Hispanic (%)
Races - Hispanic (% change since 2000)
Races - Native Hawaiian and Other Pacific Islander alone (%)
Races - Native Hawaiian and Other Pacific Islander alone (% change since 2000)
Races - Two or more races(%)
Races - Two or more races(% change since 2000)
Races - Other race alone (%)
Races - Other race alone (% change since 2000)
Racial diversity
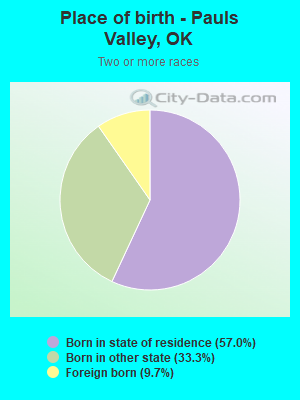
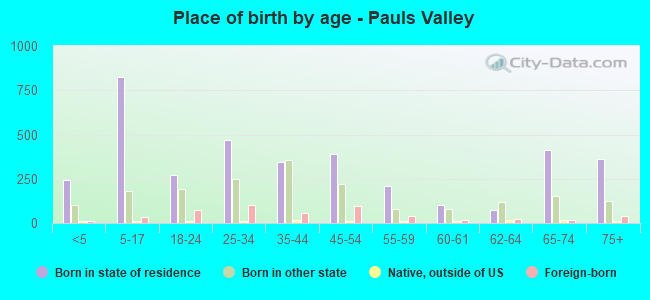
Place of birth - Born in state of residence (%)
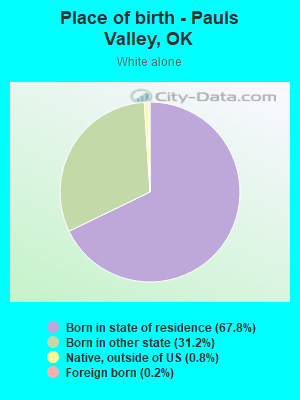
Place of birth - Born in state of residence (%) - White
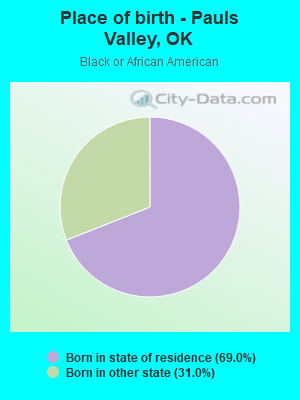
Place of birth - Born in state of residence (%) - Black or African American
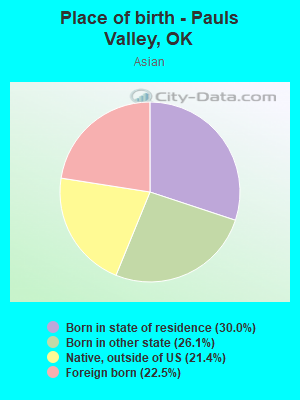
Place of birth - Born in state of residence (%) - Asian
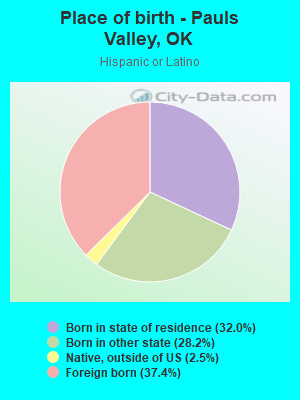
Place of birth - Born in state of residence (%) - Hispanic or Latino
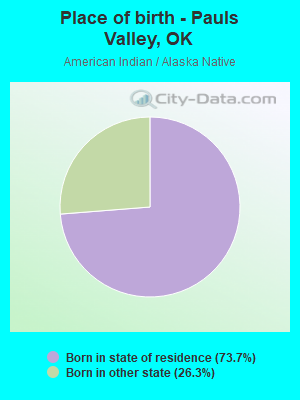
Place of birth - Born in state of residence (%) - American Indian and Alaska Native
Place of birth - Born in state of residence (%) - Multirace
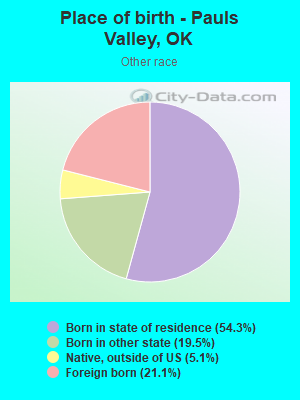
Place of birth - Born in state of residence (%) - Other Race
Place of birth - Born in other state (%)
Place of birth - Born in other state (%) - White
Place of birth - Born in other state (%) - Black or African American
Place of birth - Born in other state (%) - Asian
Place of birth - Born in other state (%) - Hispanic or Latino
Place of birth - Born in other state (%) - American Indian and Alaska Native
Place of birth - Born in other state (%) - Multirace
Place of birth - Born in other state (%) - Other Race
Place of birth - Native, outside of US (%)
Place of birth - Native, outside of US (%) - White
Place of birth - Native, outside of US (%) - Black or African American
Place of birth - Native, outside of US (%) - Asian
Place of birth - Native, outside of US (%) - Hispanic or Latino
Place of birth - Native, outside of US (%) - American Indian and Alaska Native
Place of birth - Native, outside of US (%) - Multirace
Place of birth - Native, outside of US (%) - Other Race
Place of birth - Foreign born (%)
Place of birth - Foreign born (%) - White
Place of birth - Foreign born (%) - Black or African American
Place of birth - Foreign born (%) - Asian
Place of birth - Foreign born (%) - Hispanic or Latino
Place of birth - Foreign born (%) - American Indian and Alaska Native
Place of birth - Foreign born (%) - Multirace
Place of birth - Foreign born (%) - Other Race
Residents speaking English at home (%)
Residents speaking English at home - Born in the United States (%)
Residents speaking English at home - Native, born elsewhere (%)
Residents speaking English at home - Foreign born (%)
Residents speaking Spanish at home (%)
Residents speaking Spanish at home - Born in the United States (%)
Residents speaking Spanish at home - Native, born elsewhere (%)
Residents speaking Spanish at home - Foreign born (%)
Residents speaking other language at home (%)
Residents speaking other language at home - Born in the United States (%)
Residents speaking other language at home - Native, born elsewhere (%)
Residents speaking other language at home - Foreign born (%)
Marital status - Never married (%)
Marital status - Now married (%)
Marital status - Separated (%)
Marital status - Widowed (%)
Marital status - Divorced (%)
Ancestries Reported - Arab (%)
Ancestries Reported - Czech (%)
Ancestries Reported - Danish (%)
Ancestries Reported - Dutch (%)
Ancestries Reported - English (%)
Ancestries Reported - French (%)
Ancestries Reported - French Canadian (%)
Ancestries Reported - German (%)
Ancestries Reported - Greek (%)
Ancestries Reported - Hungarian (%)
Ancestries Reported - Irish (%)
Ancestries Reported - Italian (%)
Ancestries Reported - Lithuanian (%)
Ancestries Reported - Norwegian (%)
Ancestries Reported - Polish (%)
Ancestries Reported - Portuguese (%)
Ancestries Reported - Russian (%)
Ancestries Reported - Scotch-Irish (%)
Ancestries Reported - Scottish (%)
Ancestries Reported - Slovak (%)
Ancestries Reported - Subsaharan African (%)
Ancestries Reported - Swedish (%)
Ancestries Reported - Swiss (%)
Ancestries Reported - Ukrainian (%)
Ancestries Reported - United States (%)
Ancestries Reported - Welsh (%)
Ancestries Reported - West Indian (%)
Ancestries Reported - Other (%)
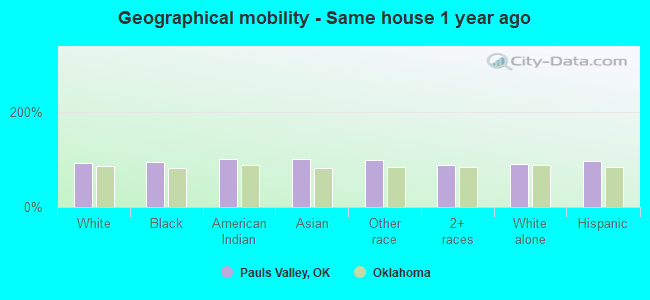
Geographical mobility - Same house 1 year ago (%)
Geographical mobility - Same house 1 year ago (%) - White
Geographical mobility - Same house 1 year ago (%) - Black or African American
Geographical mobility - Same house 1 year ago (%) - Asian
Geographical mobility - Same house 1 year ago (%) - Hispanic or Latino
Geographical mobility - Same house 1 year ago (%) - American Indian and Alaska Native
Geographical mobility - Same house 1 year ago (%) - Multirace
Geographical mobility - Same house 1 year ago (%) - Other Race
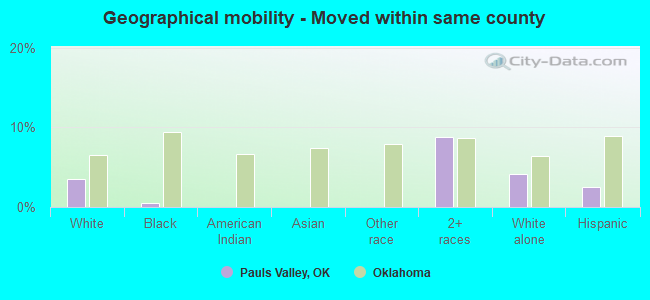
Geographical mobility - Moved within same county (%)
Geographical mobility - Moved within same county (%) - White
Geographical mobility - Moved within same county (%) - Black or African American
Geographical mobility - Moved within same county (%) - Asian
Geographical mobility - Moved within same county (%) - Hispanic or Latino
Geographical mobility - Moved within same county (%) - American Indian and Alaska Native
Geographical mobility - Moved within same county (%) - Multirace
Geographical mobility - Moved within same county (%) - Other Race
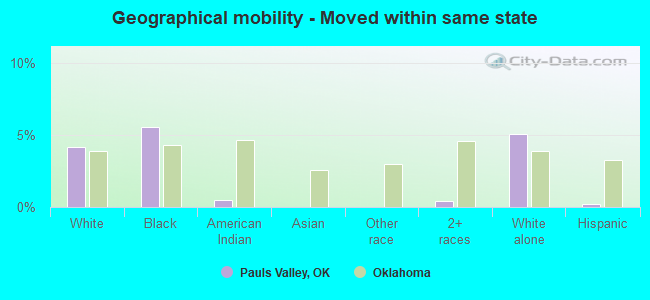
Geographical mobility - Moved from different county within same state (%)
Geographical mobility - Moved from different county within same state (%) - White
Geographical mobility - Moved from different county within same state (%) - Black or African American
Geographical mobility - Moved from different county within same state (%) - Asian
Geographical mobility - Moved from different county within same state (%) - Hispanic or Latino
Geographical mobility - Moved from different county within same state (%) - American Indian and Alaska Native
Geographical mobility - Moved from different county within same state (%) - Multirace
Geographical mobility - Moved from different county within same state (%) - Other Race
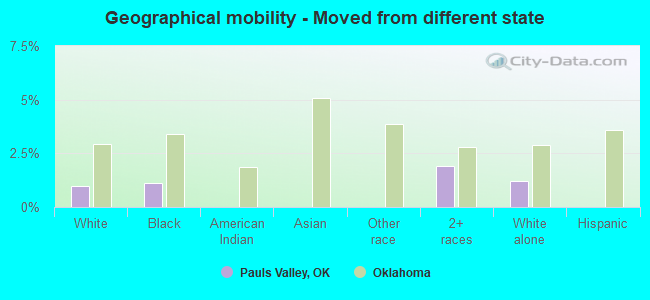
Geographical mobility - Moved from different state (%)
Geographical mobility - Moved from different state (%) - White
Geographical mobility - Moved from different state (%) - Black or African American
Geographical mobility - Moved from different state (%) - Asian
Geographical mobility - Moved from different state (%) - Hispanic or Latino
Geographical mobility - Moved from different state (%) - American Indian and Alaska Native
Geographical mobility - Moved from different state (%) - Multirace
Geographical mobility - Moved from different state (%) - Other Race
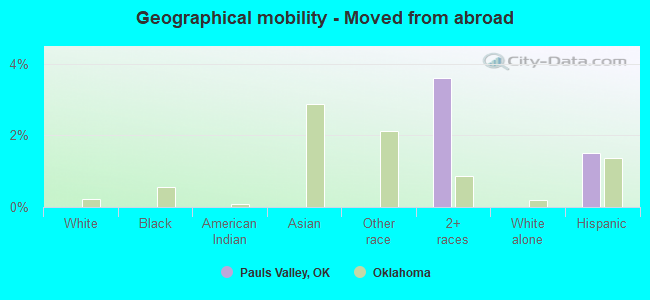
Geographical mobility - Moved from abroad (%)
Geographical mobility - Moved from abroad (%) - White
Geographical mobility - Moved from abroad (%) - Black or African American
Geographical mobility - Moved from abroad (%) - Asian
Geographical mobility - Moved from abroad (%) - Hispanic or Latino
Geographical mobility - Moved from abroad (%) - American Indian and Alaska Native
Geographical mobility - Moved from abroad (%) - Multirace
Geographical mobility - Moved from abroad (%) - Other Race
Place of birth for the foreign-born population - Ireland (%)
Place of birth for the foreign-born population - Denmark (%)
Place of birth for the foreign-born population - Norway (%)
Place of birth for the foreign-born population - Sweden (%)
Place of birth for the foreign-born population - United Kingdom (%)
Place of birth for the foreign-born population - England (%)
Place of birth for the foreign-born population - Scotland (%)
Place of birth for the foreign-born population - Other Northern Europe (%)
Place of birth for the foreign-born population - Austria (%)
Place of birth for the foreign-born population - Belgium (%)
Place of birth for the foreign-born population - France (%)
Place of birth for the foreign-born population - Germany (%)
Place of birth for the foreign-born population - Netherlands (%)
Place of birth for the foreign-born population - Switzerland (%)
Place of birth for the foreign-born population - Other Western Europe (%)
Place of birth for the foreign-born population - Greece (%)
Place of birth for the foreign-born population - Italy (%)
Place of birth for the foreign-born population - Portugal (%)
Place of birth for the foreign-born population - Spain (%)
Place of birth for the foreign-born population - Other Southern Europe (%)
Place of birth for the foreign-born population - Albania (%)
Place of birth for the foreign-born population - Belarus (%)
Place of birth for the foreign-born population - Bosnia and Herzegovina (%)
Place of birth for the foreign-born population - Bulgaria (%)
Place of birth for the foreign-born population - Croatia (%)
Place of birth for the foreign-born population - Czechoslovakia (%)
Place of birth for the foreign-born population - Hungary (%)
Place of birth for the foreign-born population - Latvia (%)
Place of birth for the foreign-born population - Lithuania (%)
Place of birth for the foreign-born population - North Macedonia (Macedonia) (%)
Place of birth for the foreign-born population - Moldova (%)
Place of birth for the foreign-born population - Poland (%)
Place of birth for the foreign-born population - Romania (%)
Place of birth for the foreign-born population - Russia (%)
Place of birth for the foreign-born population - Serbia (%)
Place of birth for the foreign-born population - Ukraine (%)
Place of birth for the foreign-born population - Other Eastern Europe (%)
Place of birth for the foreign-born population - China (%)
Place of birth for the foreign-born population - Hong Kong (%)
Place of birth for the foreign-born population - Taiwan (%)
Place of birth for the foreign-born population - Japan (%)
Place of birth for the foreign-born population - Korea (%)
Place of birth for the foreign-born population - Other Eastern Asia (%)
Place of birth for the foreign-born population - Afghanistan (%)
Place of birth for the foreign-born population - Bangladesh (%)
Place of birth for the foreign-born population - India (%)
Place of birth for the foreign-born population - Iran (%)
Place of birth for the foreign-born population - Kazakhstan (%)
Place of birth for the foreign-born population - Nepal (%)
Place of birth for the foreign-born population - Pakistan (%)
Place of birth for the foreign-born population - Sri Lanka (%)
Place of birth for the foreign-born population - Uzbekistan (%)
Place of birth for the foreign-born population - Other South Central Asia (%)
Place of birth for the foreign-born population - Burma (%)
Place of birth for the foreign-born population - Cambodia (%)
Place of birth for the foreign-born population - Indonesia (%)
Place of birth for the foreign-born population - Laos (%)
Place of birth for the foreign-born population - Malaysia (%)
Place of birth for the foreign-born population - Philippines (%)
Place of birth for the foreign-born population - Singapore (%)
Place of birth for the foreign-born population - Thailand (%)
Place of birth for the foreign-born population - Vietnam (%)
Place of birth for the foreign-born population - Other South Eastern Asia (%)
Place of birth for the foreign-born population - Armenia (%)
Place of birth for the foreign-born population - Iraq (%)
Place of birth for the foreign-born population - Israel (%)
Place of birth for the foreign-born population - Jordan (%)
Place of birth for the foreign-born population - Kuwait (%)
Place of birth for the foreign-born population - Lebanon (%)
Place of birth for the foreign-born population - Saudi Arabia (%)
Place of birth for the foreign-born population - Syria (%)
Place of birth for the foreign-born population - Turkey (%)
Place of birth for the foreign-born population - Yemen (%)
Place of birth for the foreign-born population - Other Western Asia (%)
Place of birth for the foreign-born population - Eritrea (%)
Place of birth for the foreign-born population - Ethiopia (%)
Place of birth for the foreign-born population - Kenya (%)
Place of birth for the foreign-born population - Somalia (%)
Place of birth for the foreign-born population - Uganda (%)
Place of birth for the foreign-born population - Zimbabwe (%)
Place of birth for the foreign-born population - Other Eastern Africa (%)
Place of birth for the foreign-born population - Cameroon (%)
Place of birth for the foreign-born population - Congo (%)
Place of birth for the foreign-born population - Democratic Republic of Congo (Zaire) (%)
Place of birth for the foreign-born population - Other Middle Africa (%)
Place of birth for the foreign-born population - Egypt (%)
Place of birth for the foreign-born population - Morocco (%)
Place of birth for the foreign-born population - Sudan (%)
Place of birth for the foreign-born population - Other Northern Africa (%)
Place of birth for the foreign-born population - South Africa (%)
Place of birth for the foreign-born population - Other Southern Africa (%)
Place of birth for the foreign-born population - Cabo Verde (%)
Place of birth for the foreign-born population - Ghana (%)
Place of birth for the foreign-born population - Liberia (%)
Place of birth for the foreign-born population - Nigeria (%)
Place of birth for the foreign-born population - Senegal (%)
Place of birth for the foreign-born population - Sierra Leone (%)
Place of birth for the foreign-born population - Other Western Africa (%)
Place of birth for the foreign-born population - Australia (%)
Place of birth for the foreign-born population - New Zealand (%)
Place of birth for the foreign-born population - Fiji (%)
Place of birth for the foreign-born population - Micronesia (%)
Place of birth for the foreign-born population - Bahamas (%)
Place of birth for the foreign-born population - Barbados (%)
Place of birth for the foreign-born population - Cuba (%)
Place of birth for the foreign-born population - Dominica (%)
Place of birth for the foreign-born population - Dominican Republic (%)
Place of birth for the foreign-born population - Grenada (%)
Place of birth for the foreign-born population - Haiti (%)
Place of birth for the foreign-born population - Jamaica (%)
Place of birth for the foreign-born population - St. Vincent and the Grenadines (%)
Place of birth for the foreign-born population - Trinidad and Tobago (%)
Place of birth for the foreign-born population - West Indies (%)
Place of birth for the foreign-born population - Other Caribbean (%)
Place of birth for the foreign-born population - Belize (%)
Place of birth for the foreign-born population - Costa Rica (%)
Place of birth for the foreign-born population - El Salvador (%)
Place of birth for the foreign-born population - Guatemala (%)
Place of birth for the foreign-born population - Honduras (%)
Place of birth for the foreign-born population - Mexico (%)
Place of birth for the foreign-born population - Nicaragua (%)
Place of birth for the foreign-born population - Panama (%)
Place of birth for the foreign-born population - Other Central America (%)
Place of birth for the foreign-born population - Argentina (%)
Place of birth for the foreign-born population - Bolivia (%)
Place of birth for the foreign-born population - Brazil (%)
Place of birth for the foreign-born population - Chile (%)
Place of birth for the foreign-born population - Colombia (%)
Place of birth for the foreign-born population - Ecuador (%)
Place of birth for the foreign-born population - Guyana (%)
Place of birth for the foreign-born population - Peru (%)
Place of birth for the foreign-born population - Uruguay (%)
Place of birth for the foreign-born population - Venezuela (%)
Place of birth for the foreign-born population - Other South America (%)
Place of birth for the foreign-born population - Canada (%)
Place of birth for the foreign-born population - Other Northern America (%)
Place of birth for the foreign-born population - Other (%)
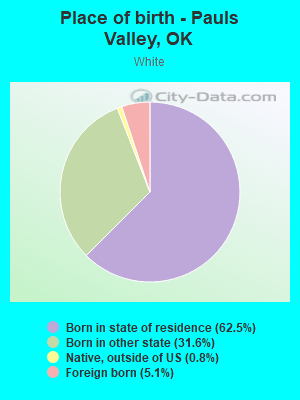
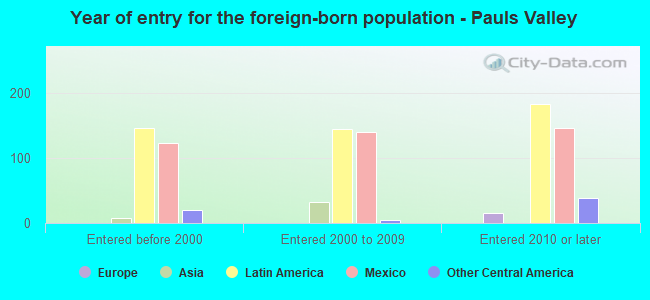
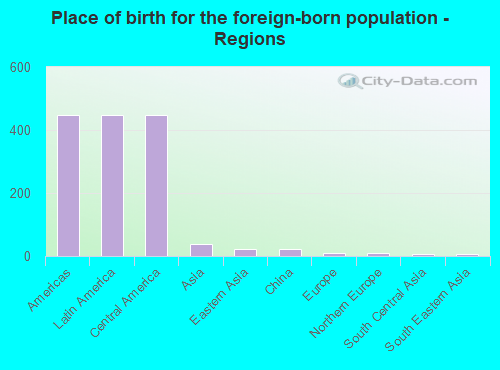
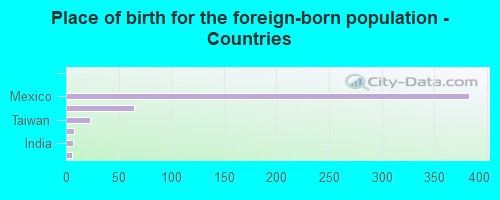
According to 2022 data, the most numerous races in Pauls Valley, OK are White alone (3,803 residents), Hispanic (1,255 residents), and Two or more races (511 residents). 87.5% of Pauls Valley residents speak English at home. 8.1% of Pauls Valley, OK residents are foreign-born (7.5% born in Latin America), which is 26.3% greater than the foreign-born rate of 6.0% across the entire state of Oklahoma.
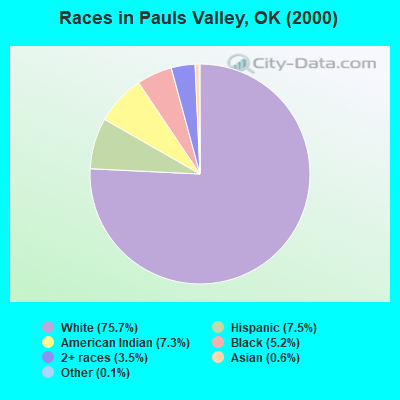
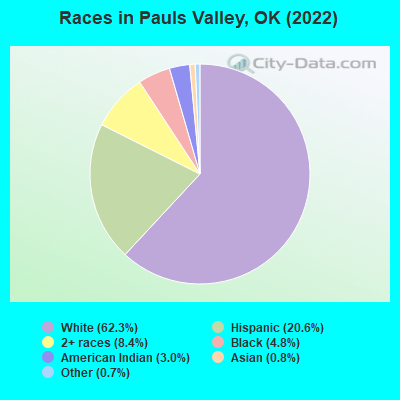
Race distribution in Pauls Valley
2000 2022
2,556,368 74.1% White alone 266,158 7.7% American Indian alone 257,981 7.5% Black alone 179,304 5.2% Hispanic 140,249 4.1% Two or more races 46,172 1.3% Asian alone 2,322 0.07% Other race alone 2,100 0.06% Native Hawaiian and Other
2,517,403 62.6% White alone 486,692 12.1% Hispanic 364,453 9.1% Two or more races 273,650 6.8% American Indian alone 268,543 6.7% Black alone 92,672 2.3% Asian alone 10,786 0.3% Other race alone 5,601 0.1% Native Hawaiian and Other
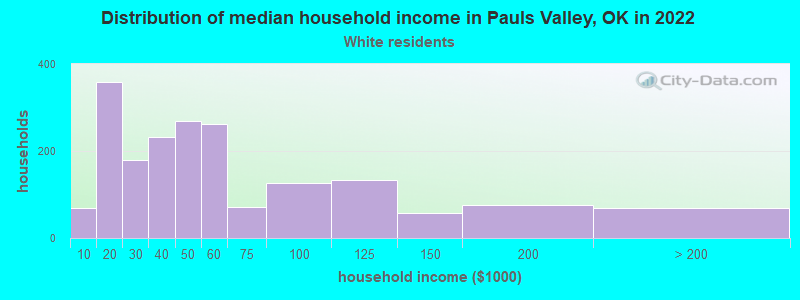
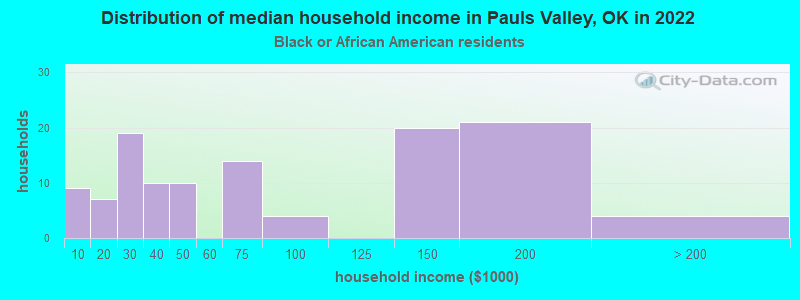
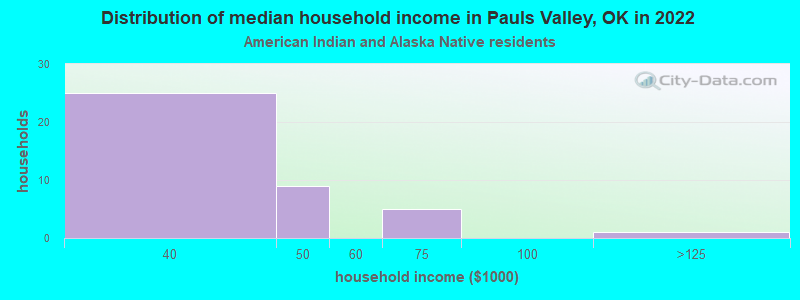
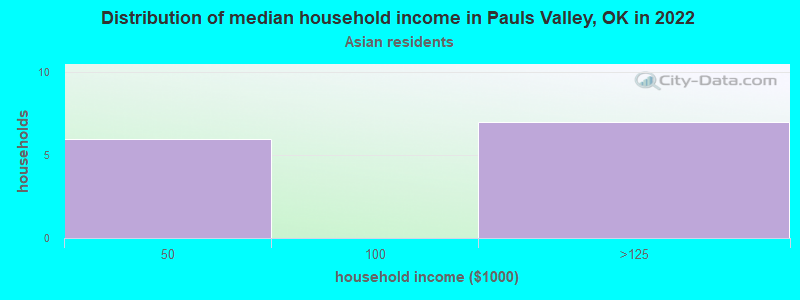
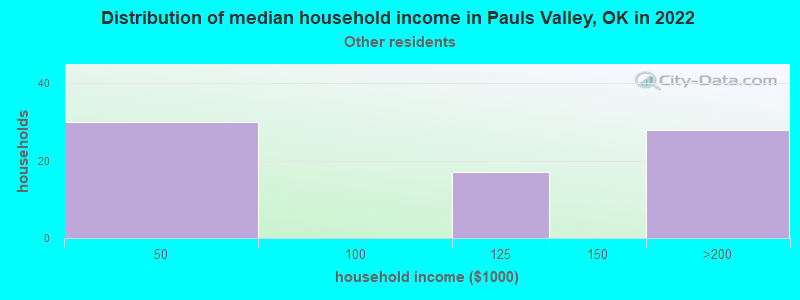
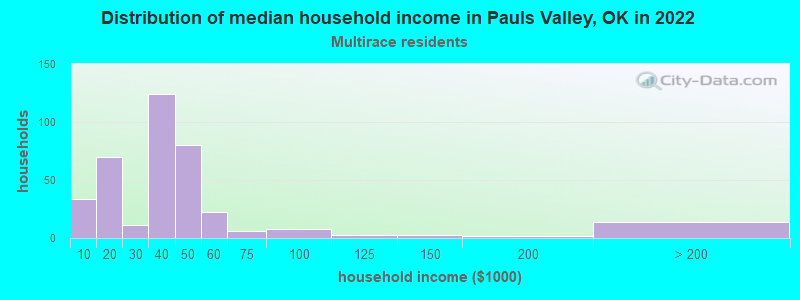
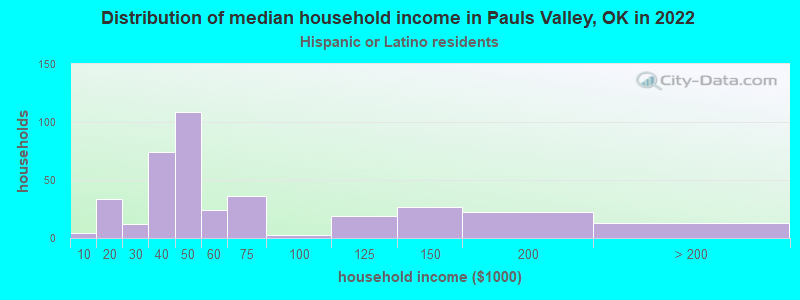
Income and house value in Pauls Valley Median household income in 2022 $45,226 White non-Hispanic householders$68,810 Black householders$33,435 American Indian and Alaska Native householders$114,306 Some other race householders$35,432 Two or more races householders$43,696 Hispanic or Latino race householdersMedian 2022 house value $102,507 White Non-Hispanic householders$53,684 Black or African American householders$71,861 American Indian or Alaska Native householders $158,517 Asian householders$343,454 Native Hawaiian and other Pacific Islander householders$92,785 Some other race householders$71,438 Two or more races householders$87,501 Hispanic or Latino householders
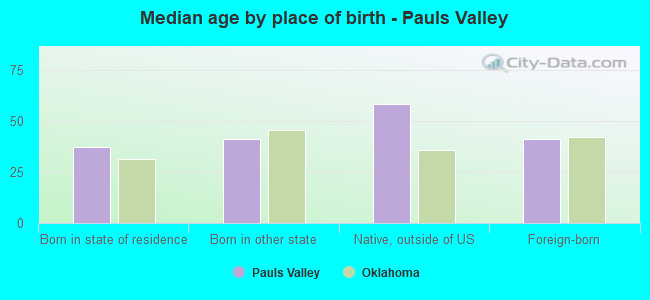
Median age by race in Pauls Valley
41.8 Median age for White residents41.7 41.7 44.4 Median age for Black or African American residents47.2 21.8 30.8 Median age for American Indian / Alaska Native residents26.8 31.4 36.1 Median age for Asian residents31.1 46.2 -725,225,224.5 Median age for Native Hawaiian / Pacific Islander residents-675,324,674.6 -767,251,461.2 37.5 Median age for Other race residents30.8 44.7 28.1 Median age for Two or more races residents26.9 29.5 46.0 Median age for White alone residents44.5 47.1 25.8 Median age for Hispanic or Latino residents26.7 23.8
Owner/renter occupied households by race in Pauls Valley
House owners and renters - White residents 1,039 54.9% Owner occupied852 45.1% Renter occupiedHouse owners and renters - Black or African American residents 56 50.1% Owner occupied56 49.9% Renter occupiedHouse owners and renters - American Indian / Alaska Native residents 14 35.5% Owner occupied26 64.5% Renter occupiedHouse owners and renters - Asian residents 16 100.0% Owner occupiedHouse owners and renters - Other race residents 75 94.0% Owner occupied5 6.0% Renter occupiedHouse owners and renters - Two or more races residents 106 27.7% Owner occupied276 72.3% Renter occupiedHouse owners and renters - White alone residents 897 53.2% Owner occupied788 46.8% Renter occupiedHouse owners and renters - Hispanic or Latino residents 224 62.7% Owner occupied133 37.3% Renter occupied
Language usage in Pauls Valley
English speakers - Total 87.5% of residents of Pauls Valley speak English at home.
12.6% of residents speak Spanish at home 593 81.8% Speak English very well132 18.2% Speak English less than very well0.1% of residents speak other language at home 6 100.0% Speak English very well
English speakers - Born in the United States 90.4% of residents of Pauls Valley speak English at home.
9.8% of residents speak Spanish at home 138 80.7% Speak English very well33 19.3% Speak English less than very well
English speakers - Native, born elsewhere 68.9% of residents of Pauls Valley speak English at home.
27.9% of residents speak Spanish at home 17 100.0% Speak English very well
English speakers - Foreign-born 23.3% of residents of Pauls Valley speak English at home.
76.3% of residents speak Spanish at home 316 83.8% Speak English very well61 16.2% Speak English less than very well
White (Caucasian) - Speak only English Native:
95.4% (3,774)Foreign-born:
33.4% (74)
White (Caucasian) - Speak another language Native:
3.9% (154)Foreign-born:
66.7% (148)
Asian - Speak only English Native:
99.7% (50)Foreign-born:
95.0% (14)
Other race - Speak another language Native:
45.8% (70)Foreign-born:
100.0% (38)
Two or more races - Speak only English Native:
88.8% (582)Foreign-born:
39.2% (31)
Two or more races - Speak another language Native:
9.7% (64)Foreign-born:
46.7% (37)
White alone - Speak only English Native:
99.9% (3,646)Foreign-born:
100.0% (9)
Hispanic or Latino - Speak only English Native:
50.1% (340)Foreign-born:
17.8% (83)
Hispanic or Latino - Speak another language Native:
49.8% (338)Foreign-born:
83.3% (389)
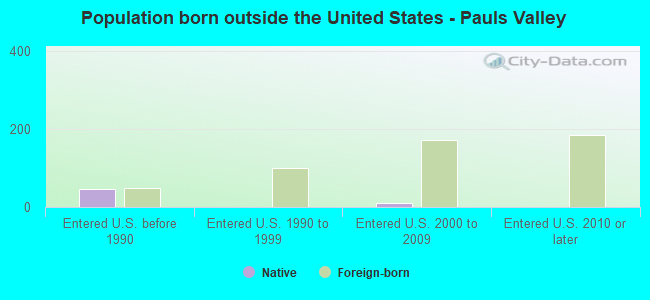
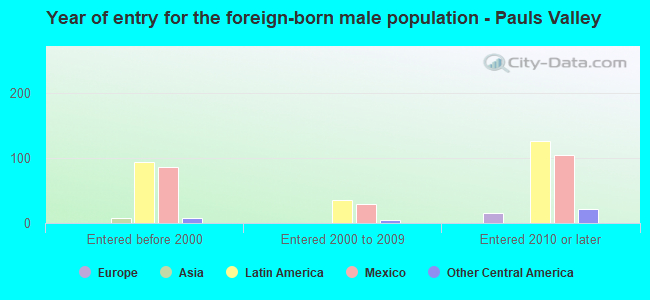
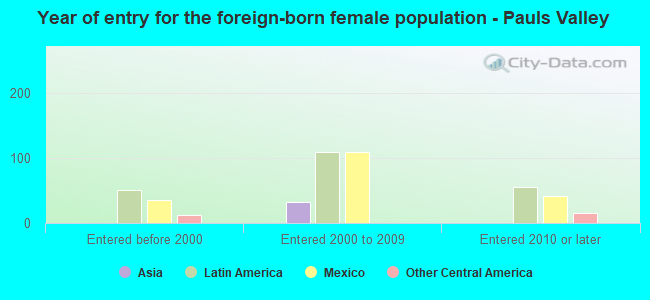
Foreign-born residents in Pauls Valley 497 residents are foreign born (7.5% Latin America ).
This city:
8.1%Oklahoma:
6.1%
Marital status for residents in Pauls Valley Marital status - White (Caucasian) population 15 years and over
Males 31.5% Never married39.1% Now married3.3% Separated6.8% Widowed19.2% DivorcedFemales 21.2% Never married43.0% Now married2.7% Separated13.7% Widowed19.4% DivorcedWomen who gave birth in the past 12 months Now married:
51.1% (22)Unmarried:
48.9% (21)
Women who did not give birth in the past 12 months Now married:
47.1% (428)Unmarried:
52.9% (480)
Marital status - Black or African American population 15 years and over
Males 24.2% Never married27.3% Now married10.9% Separated9.4% Widowed28.1% DivorcedFemales 76.0% Never married17.6% Now married0.0% Separated0.8% Widowed5.6% DivorcedWomen who gave birth in the past 12 months Now married:
0.0% (0)Unmarried:
100.0% (2)
Women who did not give birth in the past 12 months Now married:
24.1% (19)Unmarried:
75.9% (59)
Marital status - American Indian / Alaska Native population 15 years and over
Males 53.8% Never married30.8% Now married0.0% Separated0.0% Widowed15.4% DivorcedFemales 49.0% Never married11.0% Now married0.0% Separated14.0% Widowed26.0% DivorcedWomen who did not give birth in the past 12 months Now married:
13.3% (8)Unmarried:
86.7% (53)
Marital status - Asian population 15 years and over
Males 76.5% Never married23.5% Now married0.0% Separated0.0% Widowed0.0% DivorcedFemales 44.0% Never married56.0% Now married0.0% Separated0.0% Widowed0.0% DivorcedWomen who did not give birth in the past 12 months Now married:
38.9% (7)Unmarried:
61.1% (11)
Marital status - Other race population 15 years and over
Males 51.7% Never married26.7% Now married0.0% Separated21.6% Widowed0.0% DivorcedFemales 55.6% Never married44.4% Now married0.0% Separated0.0% Widowed0.0% DivorcedWomen who did not give birth in the past 12 months Now married:
41.9% (21)Unmarried:
58.1% (29)
Marital status - Two or more races population 15 years and over
Males 55.5% Never married19.1% Now married0.0% Separated3.6% Widowed21.8% DivorcedFemales 54.4% Never married22.4% Now married10.0% Separated1.7% Widowed11.6% DivorcedWomen who gave birth in the past 12 months Now married:
100.0% (28)Unmarried:
0.0% (0)
Women who did not give birth in the past 12 months Now married:
9.5% (19)Unmarried:
90.5% (179)
Marital status - White alone, not Hispanic / Latino population 15 years and over
Males 30.0% Never married40.1% Now married2.1% Separated6.9% Widowed20.9% DivorcedFemales 19.7% Never married39.6% Now married3.1% Separated15.6% Widowed22.0% DivorcedWomen who gave birth in the past 12 months Now married:
67.6% (23)Unmarried:
32.4% (11)
Women who did not give birth in the past 12 months Now married:
44.6% (343)Unmarried:
55.4% (426)
Marital status - Hispanic or Latino population 15 years and over
Males 41.1% Never married33.7% Now married6.5% Separated9.6% Widowed9.2% DivorcedFemales 37.3% Never married54.2% Now married4.2% Separated0.8% Widowed3.4% DivorcedWomen who gave birth in the past 12 months Now married:
65.6% (23)Unmarried:
34.4% (12)
Women who did not give birth in the past 12 months Now married:
47.8% (134)Unmarried:
52.2% (146)
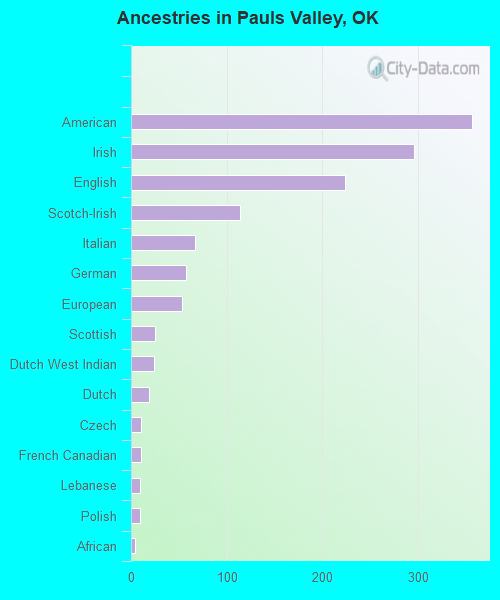
Ancestries in Pauls Valley
357 11.4% American296 9.4% Irish224 7.1% English114 3.6% Scotch-Irish67 2.1% Italian58 1.8% German53 1.7% European25 0.8% Scottish24 0.8% Dutch West Indian19 0.6% Dutch10 0.3% Czech10 0.3% French Canadian9 0.3% Lebanese9 0.3% Polish4 0.1% African
Children Nativity (place of birth) in Pauls Valley
Children under 6 years - Living with two parents Both parents native 149 100.0% NativeBoth parents foreign-born 10 81.7% Native2 18.3% Foreign-bornOne native, one foreign-born parent 13 100.0% NativeChildren under 6 years - Living with one parent Native parent 188 100.0% NativeForeign-born parent 6 100.0% NativeChildren 6 to 17 years - Living with two parents Both parents native 458 99.9% Native0 0.1% Foreign-bornBoth parents foreign-born 62 83.3% Native13 16.7% Foreign-bornOne native, one foreign-born parent 4 100.0% NativeChildren 6 to 17 years - Living with one parent Native parent 261 100.0% NativeForeign-born parent 54 62.5% Native32 37.5% Foreign-born
Grandparents responsible for own grandchildren in Pauls Valley
Grandparents (30 to 59 years) White / Caucasian 7 100.0% Not responsible for grandchildrenBlack or African American 14 100.0% Responsible for grandchildrenOther race 5 100.0% Not responsible for grandchildrenTwo or more races 9 100.0% Responsible for grandchildrenHispanic or Latino 12 100.0% Not responsible for grandchildrenGrandparents (60 years and over) White / Caucasian 18 17.3% Responsible for grandchildren84 82.7% Not responsible for grandchildrenBlack or African American 1 71.8% Not responsible for grandchildrenTwo or more races 1 100.0% Not responsible for grandchildrenHispanic or Latino 38 100.0% Not responsible for grandchildren