Races in Pelican Rapids, Minnesota (MN) Detailed Stats
Data:
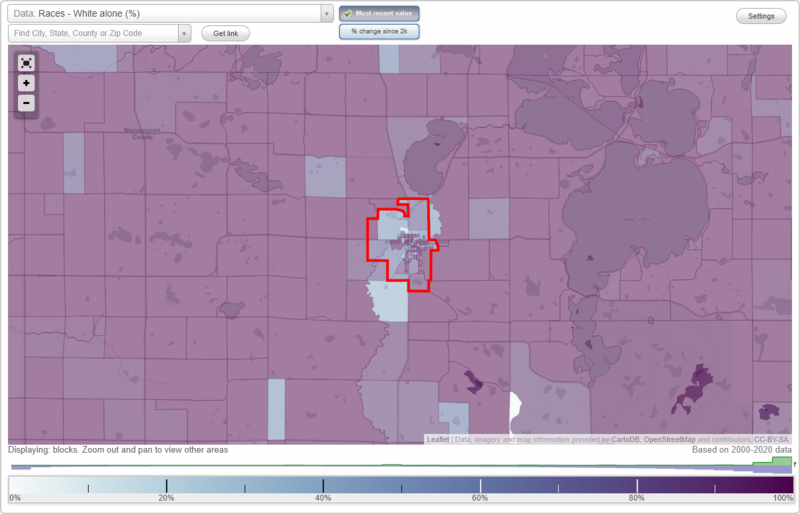
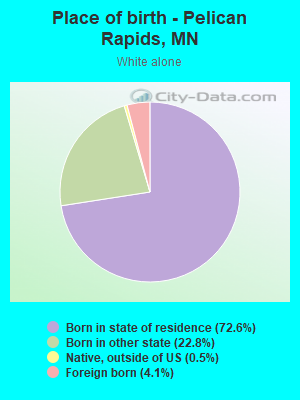
Races - White alone (%)
Races - White alone (% change since 2000)
Races - Black alone (%)
Races - Black alone (% change since 2000)
Races - American Indian alone (%)
Races - American Indian alone (% change since 2000)
Races - Asian alone (%)
Races - Asian alone (% change since 2000)
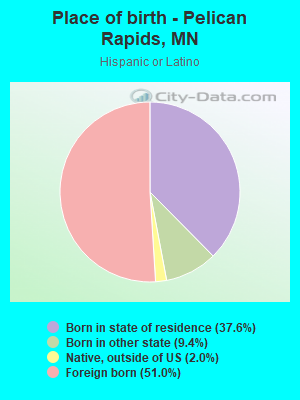
Races - Hispanic (%)
Races - Hispanic (% change since 2000)
Races - Native Hawaiian and Other Pacific Islander alone (%)
Races - Native Hawaiian and Other Pacific Islander alone (% change since 2000)
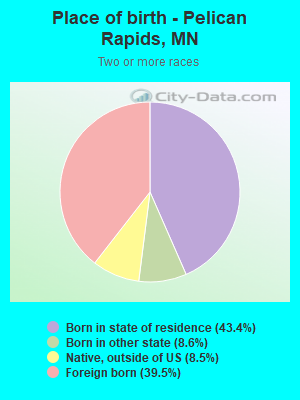
Races - Two or more races(%)
Races - Two or more races(% change since 2000)
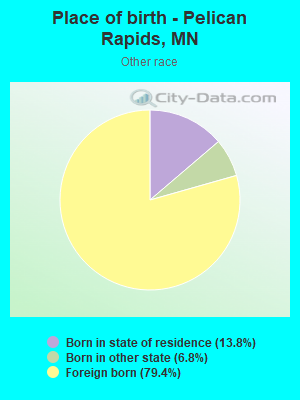
Races - Other race alone (%)
Races - Other race alone (% change since 2000)
Racial diversity
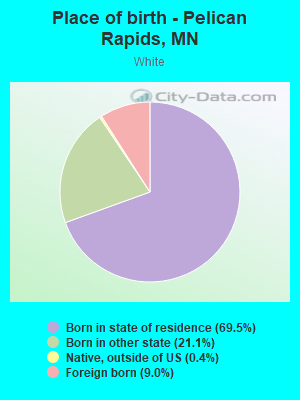
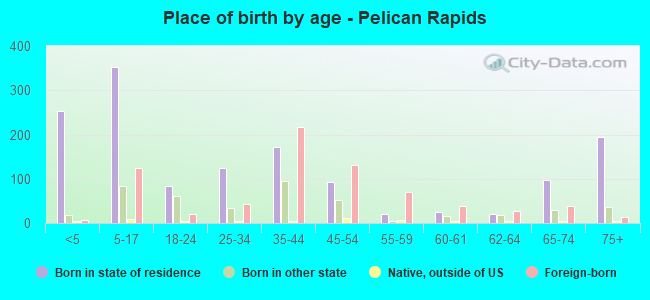
Place of birth - Born in state of residence (%)
Place of birth - Born in state of residence (%) - White
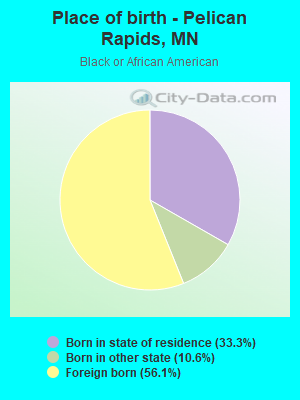
Place of birth - Born in state of residence (%) - Black or African American
Place of birth - Born in state of residence (%) - Asian
Place of birth - Born in state of residence (%) - Hispanic or Latino
Place of birth - Born in state of residence (%) - American Indian and Alaska Native
Place of birth - Born in state of residence (%) - Multirace
Place of birth - Born in state of residence (%) - Other Race
Place of birth - Born in other state (%)
Place of birth - Born in other state (%) - White
Place of birth - Born in other state (%) - Black or African American
Place of birth - Born in other state (%) - Asian
Place of birth - Born in other state (%) - Hispanic or Latino
Place of birth - Born in other state (%) - American Indian and Alaska Native
Place of birth - Born in other state (%) - Multirace
Place of birth - Born in other state (%) - Other Race
Place of birth - Native, outside of US (%)
Place of birth - Native, outside of US (%) - White
Place of birth - Native, outside of US (%) - Black or African American
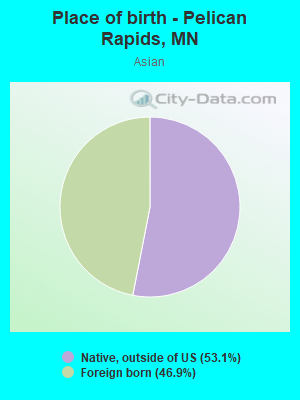
Place of birth - Native, outside of US (%) - Asian
Place of birth - Native, outside of US (%) - Hispanic or Latino
Place of birth - Native, outside of US (%) - American Indian and Alaska Native
Place of birth - Native, outside of US (%) - Multirace
Place of birth - Native, outside of US (%) - Other Race
Place of birth - Foreign born (%)
Place of birth - Foreign born (%) - White
Place of birth - Foreign born (%) - Black or African American
Place of birth - Foreign born (%) - Asian
Place of birth - Foreign born (%) - Hispanic or Latino
Place of birth - Foreign born (%) - American Indian and Alaska Native
Place of birth - Foreign born (%) - Multirace
Place of birth - Foreign born (%) - Other Race
Residents speaking English at home (%)
Residents speaking English at home - Born in the United States (%)
Residents speaking English at home - Native, born elsewhere (%)
Residents speaking English at home - Foreign born (%)
Residents speaking Spanish at home (%)
Residents speaking Spanish at home - Born in the United States (%)
Residents speaking Spanish at home - Native, born elsewhere (%)
Residents speaking Spanish at home - Foreign born (%)
Residents speaking other language at home (%)
Residents speaking other language at home - Born in the United States (%)
Residents speaking other language at home - Native, born elsewhere (%)
Residents speaking other language at home - Foreign born (%)
Marital status - Never married (%)
Marital status - Now married (%)
Marital status - Separated (%)
Marital status - Widowed (%)
Marital status - Divorced (%)
Ancestries Reported - Arab (%)
Ancestries Reported - Czech (%)
Ancestries Reported - Danish (%)
Ancestries Reported - Dutch (%)
Ancestries Reported - English (%)
Ancestries Reported - French (%)
Ancestries Reported - French Canadian (%)
Ancestries Reported - German (%)
Ancestries Reported - Greek (%)
Ancestries Reported - Hungarian (%)
Ancestries Reported - Irish (%)
Ancestries Reported - Italian (%)
Ancestries Reported - Lithuanian (%)
Ancestries Reported - Norwegian (%)
Ancestries Reported - Polish (%)
Ancestries Reported - Portuguese (%)
Ancestries Reported - Russian (%)
Ancestries Reported - Scotch-Irish (%)
Ancestries Reported - Scottish (%)
Ancestries Reported - Slovak (%)
Ancestries Reported - Subsaharan African (%)
Ancestries Reported - Swedish (%)
Ancestries Reported - Swiss (%)
Ancestries Reported - Ukrainian (%)
Ancestries Reported - United States (%)
Ancestries Reported - Welsh (%)
Ancestries Reported - West Indian (%)
Ancestries Reported - Other (%)
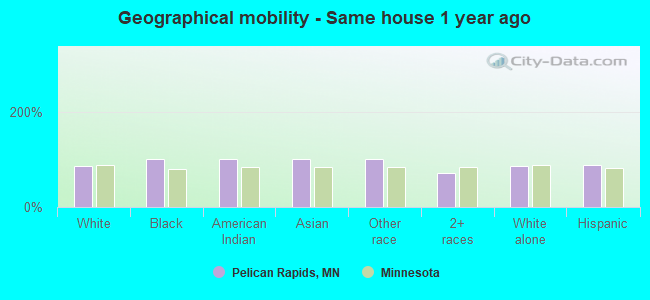
Geographical mobility - Same house 1 year ago (%)
Geographical mobility - Same house 1 year ago (%) - White
Geographical mobility - Same house 1 year ago (%) - Black or African American
Geographical mobility - Same house 1 year ago (%) - Asian
Geographical mobility - Same house 1 year ago (%) - Hispanic or Latino
Geographical mobility - Same house 1 year ago (%) - American Indian and Alaska Native
Geographical mobility - Same house 1 year ago (%) - Multirace
Geographical mobility - Same house 1 year ago (%) - Other Race
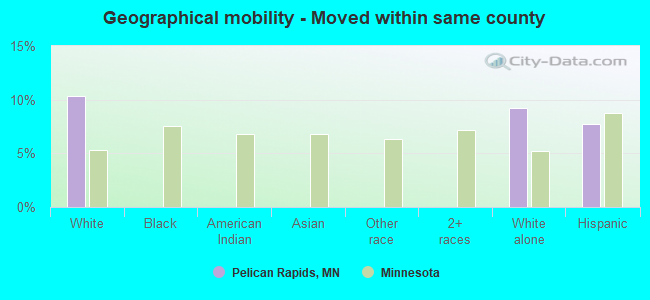
Geographical mobility - Moved within same county (%)
Geographical mobility - Moved within same county (%) - White
Geographical mobility - Moved within same county (%) - Black or African American
Geographical mobility - Moved within same county (%) - Asian
Geographical mobility - Moved within same county (%) - Hispanic or Latino
Geographical mobility - Moved within same county (%) - American Indian and Alaska Native
Geographical mobility - Moved within same county (%) - Multirace
Geographical mobility - Moved within same county (%) - Other Race
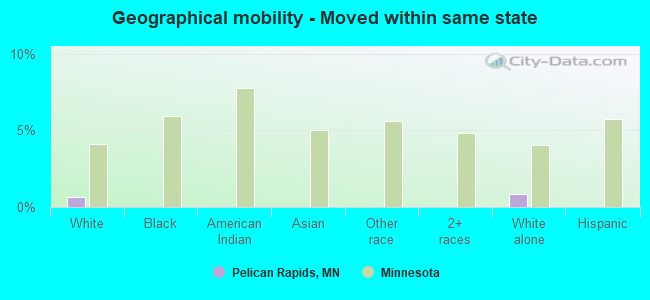
Geographical mobility - Moved from different county within same state (%)
Geographical mobility - Moved from different county within same state (%) - White
Geographical mobility - Moved from different county within same state (%) - Black or African American
Geographical mobility - Moved from different county within same state (%) - Asian
Geographical mobility - Moved from different county within same state (%) - Hispanic or Latino
Geographical mobility - Moved from different county within same state (%) - American Indian and Alaska Native
Geographical mobility - Moved from different county within same state (%) - Multirace
Geographical mobility - Moved from different county within same state (%) - Other Race
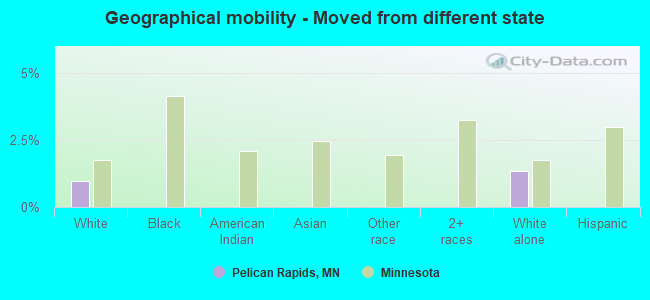
Geographical mobility - Moved from different state (%)
Geographical mobility - Moved from different state (%) - White
Geographical mobility - Moved from different state (%) - Black or African American
Geographical mobility - Moved from different state (%) - Asian
Geographical mobility - Moved from different state (%) - Hispanic or Latino
Geographical mobility - Moved from different state (%) - American Indian and Alaska Native
Geographical mobility - Moved from different state (%) - Multirace
Geographical mobility - Moved from different state (%) - Other Race
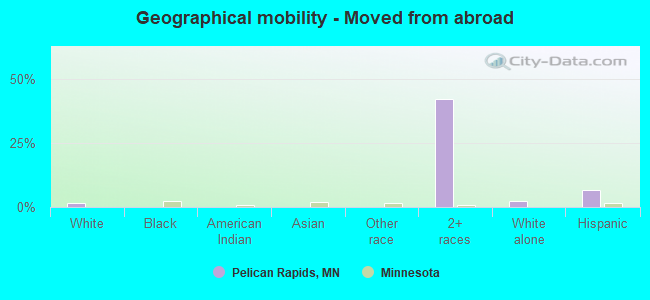
Geographical mobility - Moved from abroad (%)
Geographical mobility - Moved from abroad (%) - White
Geographical mobility - Moved from abroad (%) - Black or African American
Geographical mobility - Moved from abroad (%) - Asian
Geographical mobility - Moved from abroad (%) - Hispanic or Latino
Geographical mobility - Moved from abroad (%) - American Indian and Alaska Native
Geographical mobility - Moved from abroad (%) - Multirace
Geographical mobility - Moved from abroad (%) - Other Race
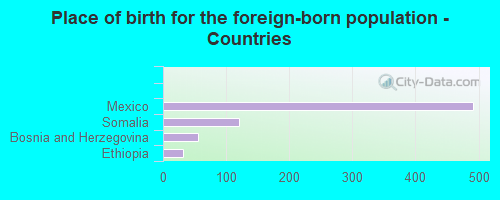
Place of birth for the foreign-born population - Ireland (%)
Place of birth for the foreign-born population - Denmark (%)
Place of birth for the foreign-born population - Norway (%)
Place of birth for the foreign-born population - Sweden (%)
Place of birth for the foreign-born population - United Kingdom (%)
Place of birth for the foreign-born population - England (%)
Place of birth for the foreign-born population - Scotland (%)
Place of birth for the foreign-born population - Other Northern Europe (%)
Place of birth for the foreign-born population - Austria (%)
Place of birth for the foreign-born population - Belgium (%)
Place of birth for the foreign-born population - France (%)
Place of birth for the foreign-born population - Germany (%)
Place of birth for the foreign-born population - Netherlands (%)
Place of birth for the foreign-born population - Switzerland (%)
Place of birth for the foreign-born population - Other Western Europe (%)
Place of birth for the foreign-born population - Greece (%)
Place of birth for the foreign-born population - Italy (%)
Place of birth for the foreign-born population - Portugal (%)
Place of birth for the foreign-born population - Spain (%)
Place of birth for the foreign-born population - Other Southern Europe (%)
Place of birth for the foreign-born population - Albania (%)
Place of birth for the foreign-born population - Belarus (%)
Place of birth for the foreign-born population - Bosnia and Herzegovina (%)
Place of birth for the foreign-born population - Bulgaria (%)
Place of birth for the foreign-born population - Croatia (%)
Place of birth for the foreign-born population - Czechoslovakia (%)
Place of birth for the foreign-born population - Hungary (%)
Place of birth for the foreign-born population - Latvia (%)
Place of birth for the foreign-born population - Lithuania (%)
Place of birth for the foreign-born population - North Macedonia (Macedonia) (%)
Place of birth for the foreign-born population - Moldova (%)
Place of birth for the foreign-born population - Poland (%)
Place of birth for the foreign-born population - Romania (%)
Place of birth for the foreign-born population - Russia (%)
Place of birth for the foreign-born population - Serbia (%)
Place of birth for the foreign-born population - Ukraine (%)
Place of birth for the foreign-born population - Other Eastern Europe (%)
Place of birth for the foreign-born population - China (%)
Place of birth for the foreign-born population - Hong Kong (%)
Place of birth for the foreign-born population - Taiwan (%)
Place of birth for the foreign-born population - Japan (%)
Place of birth for the foreign-born population - Korea (%)
Place of birth for the foreign-born population - Other Eastern Asia (%)
Place of birth for the foreign-born population - Afghanistan (%)
Place of birth for the foreign-born population - Bangladesh (%)
Place of birth for the foreign-born population - India (%)
Place of birth for the foreign-born population - Iran (%)
Place of birth for the foreign-born population - Kazakhstan (%)
Place of birth for the foreign-born population - Nepal (%)
Place of birth for the foreign-born population - Pakistan (%)
Place of birth for the foreign-born population - Sri Lanka (%)
Place of birth for the foreign-born population - Uzbekistan (%)
Place of birth for the foreign-born population - Other South Central Asia (%)
Place of birth for the foreign-born population - Burma (%)
Place of birth for the foreign-born population - Cambodia (%)
Place of birth for the foreign-born population - Indonesia (%)
Place of birth for the foreign-born population - Laos (%)
Place of birth for the foreign-born population - Malaysia (%)
Place of birth for the foreign-born population - Philippines (%)
Place of birth for the foreign-born population - Singapore (%)
Place of birth for the foreign-born population - Thailand (%)
Place of birth for the foreign-born population - Vietnam (%)
Place of birth for the foreign-born population - Other South Eastern Asia (%)
Place of birth for the foreign-born population - Armenia (%)
Place of birth for the foreign-born population - Iraq (%)
Place of birth for the foreign-born population - Israel (%)
Place of birth for the foreign-born population - Jordan (%)
Place of birth for the foreign-born population - Kuwait (%)
Place of birth for the foreign-born population - Lebanon (%)
Place of birth for the foreign-born population - Saudi Arabia (%)
Place of birth for the foreign-born population - Syria (%)
Place of birth for the foreign-born population - Turkey (%)
Place of birth for the foreign-born population - Yemen (%)
Place of birth for the foreign-born population - Other Western Asia (%)
Place of birth for the foreign-born population - Eritrea (%)
Place of birth for the foreign-born population - Ethiopia (%)
Place of birth for the foreign-born population - Kenya (%)
Place of birth for the foreign-born population - Somalia (%)
Place of birth for the foreign-born population - Uganda (%)
Place of birth for the foreign-born population - Zimbabwe (%)
Place of birth for the foreign-born population - Other Eastern Africa (%)
Place of birth for the foreign-born population - Cameroon (%)
Place of birth for the foreign-born population - Congo (%)
Place of birth for the foreign-born population - Democratic Republic of Congo (Zaire) (%)
Place of birth for the foreign-born population - Other Middle Africa (%)
Place of birth for the foreign-born population - Egypt (%)
Place of birth for the foreign-born population - Morocco (%)
Place of birth for the foreign-born population - Sudan (%)
Place of birth for the foreign-born population - Other Northern Africa (%)
Place of birth for the foreign-born population - South Africa (%)
Place of birth for the foreign-born population - Other Southern Africa (%)
Place of birth for the foreign-born population - Cabo Verde (%)
Place of birth for the foreign-born population - Ghana (%)
Place of birth for the foreign-born population - Liberia (%)
Place of birth for the foreign-born population - Nigeria (%)
Place of birth for the foreign-born population - Senegal (%)
Place of birth for the foreign-born population - Sierra Leone (%)
Place of birth for the foreign-born population - Other Western Africa (%)
Place of birth for the foreign-born population - Australia (%)
Place of birth for the foreign-born population - New Zealand (%)
Place of birth for the foreign-born population - Fiji (%)
Place of birth for the foreign-born population - Micronesia (%)
Place of birth for the foreign-born population - Bahamas (%)
Place of birth for the foreign-born population - Barbados (%)
Place of birth for the foreign-born population - Cuba (%)
Place of birth for the foreign-born population - Dominica (%)
Place of birth for the foreign-born population - Dominican Republic (%)
Place of birth for the foreign-born population - Grenada (%)
Place of birth for the foreign-born population - Haiti (%)
Place of birth for the foreign-born population - Jamaica (%)
Place of birth for the foreign-born population - St. Vincent and the Grenadines (%)
Place of birth for the foreign-born population - Trinidad and Tobago (%)
Place of birth for the foreign-born population - West Indies (%)
Place of birth for the foreign-born population - Other Caribbean (%)
Place of birth for the foreign-born population - Belize (%)
Place of birth for the foreign-born population - Costa Rica (%)
Place of birth for the foreign-born population - El Salvador (%)
Place of birth for the foreign-born population - Guatemala (%)
Place of birth for the foreign-born population - Honduras (%)
Place of birth for the foreign-born population - Mexico (%)
Place of birth for the foreign-born population - Nicaragua (%)
Place of birth for the foreign-born population - Panama (%)
Place of birth for the foreign-born population - Other Central America (%)
Place of birth for the foreign-born population - Argentina (%)
Place of birth for the foreign-born population - Bolivia (%)
Place of birth for the foreign-born population - Brazil (%)
Place of birth for the foreign-born population - Chile (%)
Place of birth for the foreign-born population - Colombia (%)
Place of birth for the foreign-born population - Ecuador (%)
Place of birth for the foreign-born population - Guyana (%)
Place of birth for the foreign-born population - Peru (%)
Place of birth for the foreign-born population - Uruguay (%)
Place of birth for the foreign-born population - Venezuela (%)
Place of birth for the foreign-born population - Other South America (%)
Place of birth for the foreign-born population - Canada (%)
Place of birth for the foreign-born population - Other Northern America (%)
Place of birth for the foreign-born population - Other (%)
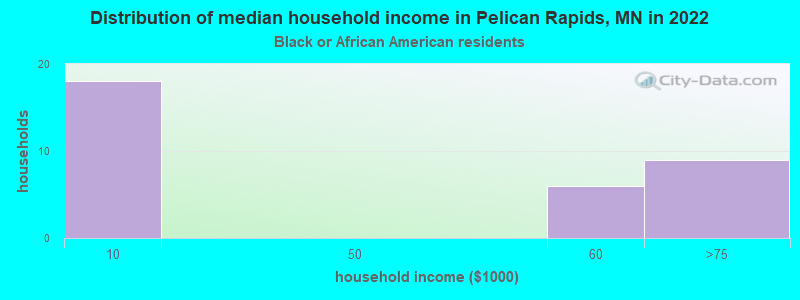
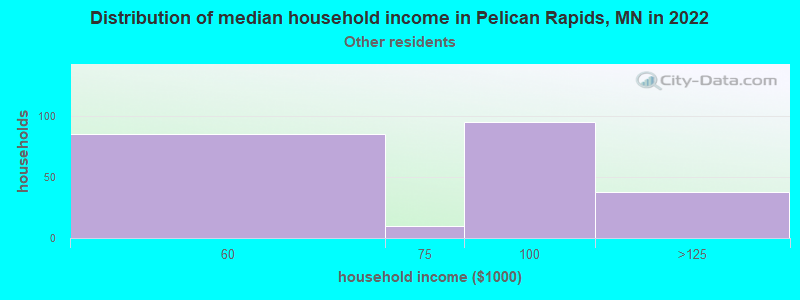
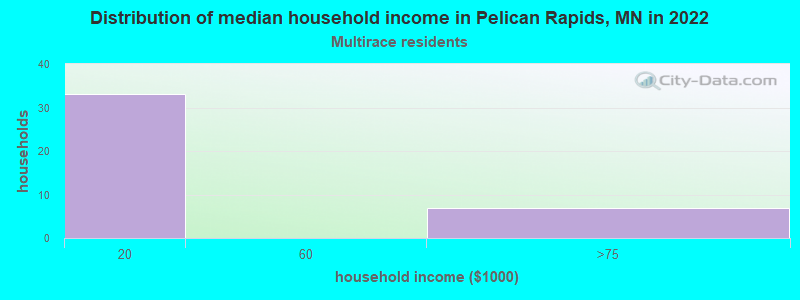
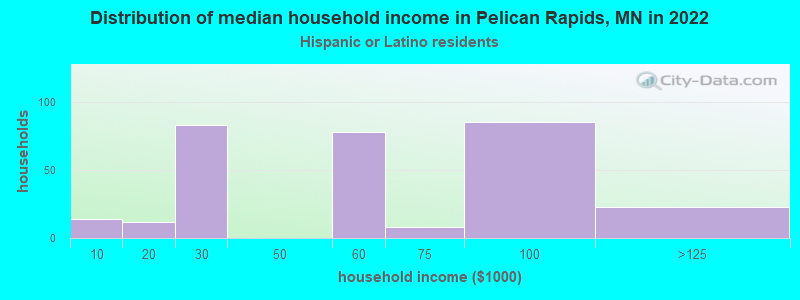
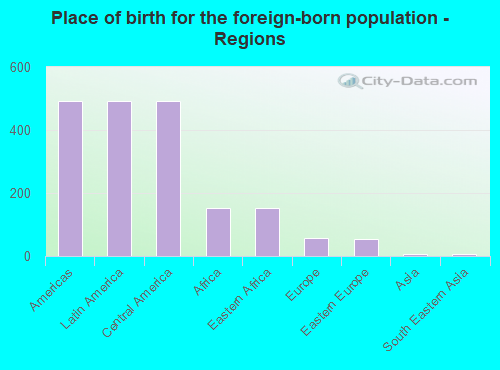
According to 2022 data, the most numerous races in Pelican Rapids, MN are White alone (1,337 residents), Black alone (193 residents), and Hispanic (956 residents). 63.7% of Pelican Rapids residents speak English at home. 27.3% of Pelican Rapids, MN residents are foreign-born (18.4% born in Latin America, 5.6% born in Africa), which is 70.7% greater than the foreign-born rate of 8.0% across the entire state of Minnesota.
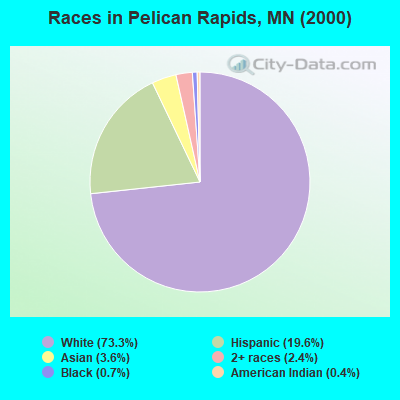
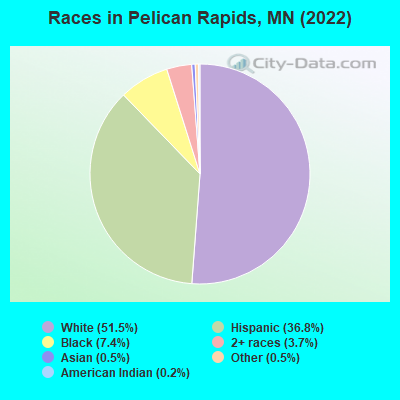
Race distribution in Pelican Rapids
2000 2022
4,337,143 88.2% White alone 168,813 3.4% Black alone 143,382 2.9% Hispanic 141,083 2.9% Asian alone 70,304 1.4% Two or more races 52,009 1.1% American Indian alone 5,031 0.1% Other race alone 1,714 0.03% Native Hawaiian and Other
4,356,347 76.2% White alone 395,179 6.9% Black alone 333,830 5.8% Hispanic 294,800 5.2% Asian alone 259,649 4.5% Two or more races 42,125 0.7% American Indian alone 32,976 0.6% Other race alone 2,278 0.04% Native Hawaiian and Other
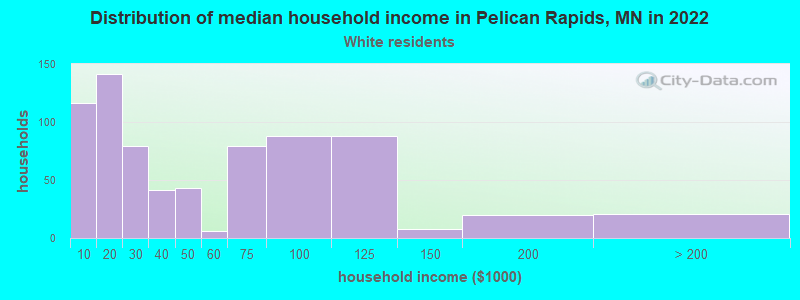
Income and house value in Pelican Rapids Median household income in 2022 $46,817 White non-Hispanic householders$88,362 Some other race householders$54,820 Hispanic or Latino race householdersMedian 2022 house value $202,120 White Non-Hispanic householders$217,489 Some other race householders$442,228 Two or more races householders$211,399 Hispanic or Latino householders
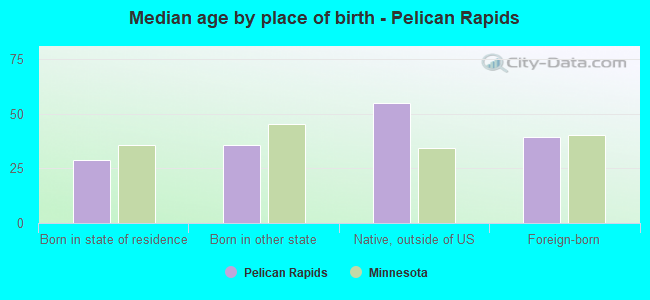
Median age by race in Pelican Rapids
36.2 Median age for White residents35.7 36.7 15.5 Median age for Black or African American residents11.6 16.1 -673,400,672.7 Median age for American Indian / Alaska Native residents-666,666,666.0 -677,852,348.3 7.2 Median age for Asian residents7.1 -687,499,999.3 -744,336,568.8 Median age for Native Hawaiian / Pacific Islander residents-856,799,036.4 -534,959,349.1 45.2 Median age for Other race residents38.6 54.0 21.6 Median age for Two or more races residents17.6 60.2 38.2 Median age for White alone residents38.1 38.1 21.0 Median age for Hispanic or Latino residents31.3 16.5
Owner/renter occupied households by race in Pelican Rapids
House owners and renters - White residents 450 63.3% Owner occupied260 36.7% Renter occupiedHouse owners and renters - Black or African American residents 28 100.0% Renter occupiedHouse owners and renters - Asian residents 3 100.0% Owner occupiedHouse owners and renters - Other race residents 218 95.4% Owner occupied10 4.6% Renter occupiedHouse owners and renters - Two or more races residents 9 23.3% Owner occupied29 76.7% Renter occupiedHouse owners and renters - White alone residents 379 60.2% Owner occupied250 39.8% Renter occupiedHouse owners and renters - Hispanic or Latino residents 235 90.6% Owner occupied24 9.4% Renter occupied
Language usage in Pelican Rapids
English speakers - Total 63.7% of residents of Pelican Rapids speak English at home.
25.7% of residents speak Spanish at home 264 44.4% Speak English very well331 55.6% Speak English less than very well10.8% of residents speak other language at home 37 14.7% Speak English very well214 85.3% Speak English less than very well
English speakers - Born in the United States 93.1% of residents of Pelican Rapids speak English at home.
4.3% of residents speak Spanish at home 18 100.0% Speak English very well2.6% of residents speak other language at home 2 18.2% Speak English very well9 81.8% Speak English less than very well
English speakers - Native, born elsewhere 23.3% of residents of Pelican Rapids speak English at home.
53.3% of residents speak Spanish at home 16 100.0% Speak English very well26.7% of residents speak other language at home 8 100.0% Speak English less than very well
English speakers - Foreign-born 13.1% of residents of Pelican Rapids speak English at home.
56.2% of residents speak Spanish at home 112 28.4% Speak English very well283 71.6% Speak English less than very well29.0% of residents speak other language at home 26 12.7% Speak English very well178 87.3% Speak English less than very well
White (Caucasian) - Speak only English Native:
90.1% (1,278)Foreign-born:
11.3% (17)
White (Caucasian) - Speak another language Native:
8.3% (118)Foreign-born:
79.4% (122)
Black or African American - Speak only English Native:
54.8% (31)Foreign-born:
7.4% (8)
Black or African American - Speak another language Native:
51.3% (29)Foreign-born:
93.9% (102)
Asian - Speak another language Native:
94.5% (8)Foreign-born:
100.0% (6)
Other race - Speak only English Native:
17.0% (12)Foreign-born:
23.3% (93)
Other race - Speak another language Native:
78.5% (58)Foreign-born:
78.2% (312)
Two or more races - Speak another language Native:
28.5% (17)Foreign-born:
100.0% (68)
White alone - Speak another language Native:
0.9% (11)Foreign-born:
95.9% (47)
Hispanic or Latino - Speak only English Native:
40.4% (135)Foreign-born:
21.8% (106)
Hispanic or Latino - Speak another language Native:
58.2% (195)Foreign-born:
80.2% (392)
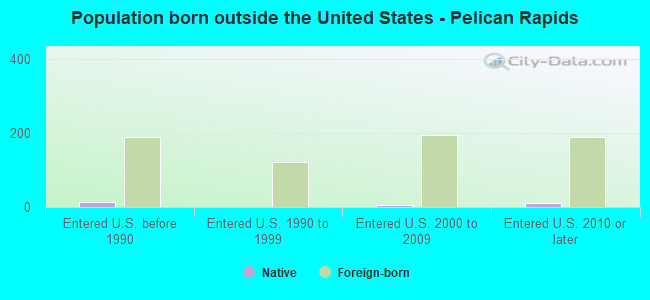
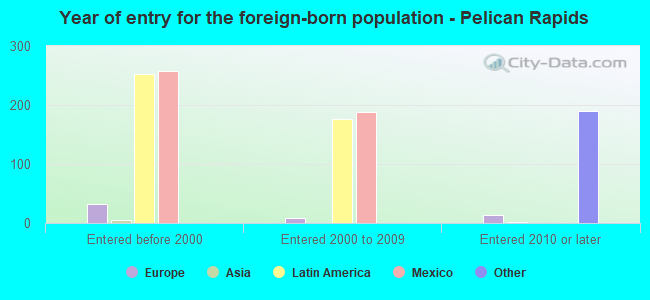
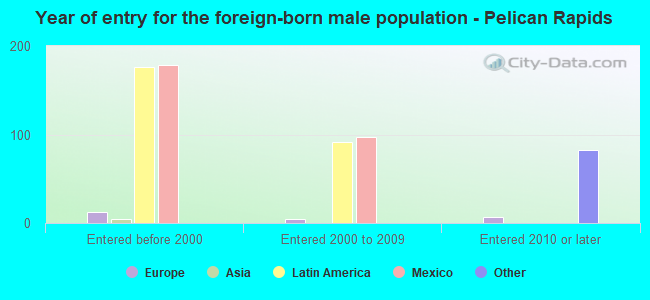
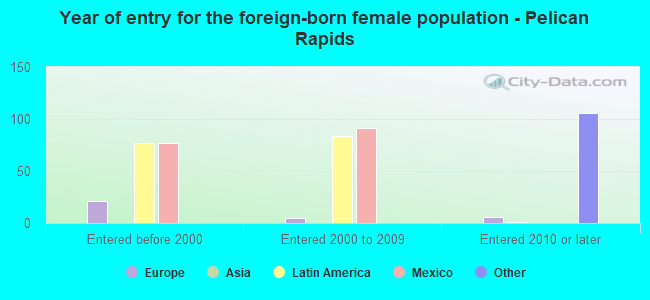
Foreign-born residents in Pelican Rapids 709 residents are foreign born (18.4% Latin America , 5.6% Africa ).
This city:
27.3%Minnesota:
8.5%
Marital status for residents in Pelican Rapids Marital status - White (Caucasian) population 15 years and over
Males 33.4% Never married51.0% Now married0.0% Separated6.8% Widowed8.8% DivorcedFemales 22.4% Never married38.6% Now married0.9% Separated18.8% Widowed19.3% DivorcedWomen who gave birth in the past 12 months Now married:
34.8% (15)Unmarried:
65.2% (29)
Women who did not give birth in the past 12 months Now married:
48.9% (177)Unmarried:
51.1% (184)
Marital status - Black or African American population 15 years and over
Males 66.7% Never married33.3% Now married0.0% Separated0.0% Widowed0.0% DivorcedFemales 21.1% Never married56.1% Now married0.0% Separated0.0% Widowed22.8% DivorcedWomen who gave birth in the past 12 months Now married:
48.0% (12)Unmarried:
52.0% (13)
Women who did not give birth in the past 12 months Now married:
62.5% (21)Unmarried:
37.5% (12)
Marital status - Asian population 15 years and over
Males 0.0% Never married40.0% Now married0.0% Separated0.0% Widowed60.0% DivorcedFemales 0.0% Never married100.0% Now married0.0% Separated0.0% Widowed0.0% DivorcedWomen who did not give birth in the past 12 months Now married:
100.0% (1)Unmarried:
0.0% (0)
Marital status - Other race population 15 years and over
Males 15.7% Never married84.3% Now married0.0% Separated0.0% Widowed0.0% DivorcedFemales 0.0% Never married89.6% Now married0.0% Separated10.4% Widowed0.0% DivorcedWomen who did not give birth in the past 12 months Now married:
100.0% (65)Unmarried:
0.0% (0)
Marital status - Two or more races population 15 years and over
Males 40.0% Never married60.0% Now married0.0% Separated0.0% Widowed0.0% DivorcedFemales 21.3% Never married78.7% Now married0.0% Separated0.0% Widowed0.0% DivorcedWomen who did not give birth in the past 12 months Now married:
42.9% (4)Unmarried:
57.1% (5)
Marital status - White alone, not Hispanic / Latino population 15 years and over
Males 31.0% Never married51.8% Now married0.0% Separated7.5% Widowed9.7% DivorcedFemales 17.3% Never married44.8% Now married1.1% Separated21.2% Widowed15.6% DivorcedWomen who gave birth in the past 12 months Now married:
34.8% (16)Unmarried:
65.2% (29)
Women who did not give birth in the past 12 months Now married:
70.7% (179)Unmarried:
29.3% (74)
Marital status - Hispanic or Latino population 15 years and over
Males 22.5% Never married77.5% Now married0.0% Separated0.0% Widowed0.0% DivorcedFemales 24.4% Never married46.9% Now married0.0% Separated9.2% Widowed19.5% DivorcedWomen who did not give birth in the past 12 months Now married:
30.3% (53)Unmarried:
69.7% (123)
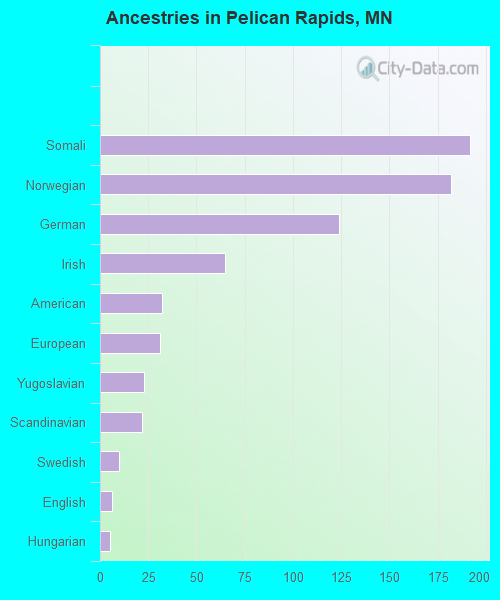
Ancestries in Pelican Rapids
192 13.0% Somali182 12.3% Norwegian124 8.4% German65 4.4% Irish32 2.2% American31 2.1% European23 1.6% Yugoslavian22 1.5% Scandinavian10 0.7% Swedish6 0.4% English5 0.3% Hungarian
Children Nativity (place of birth) in Pelican Rapids
Children under 6 years - Living with two parents Both parents native 144 99.8% Native0 0.2% Foreign-bornBoth parents foreign-born 26 80.4% Native6 19.6% Foreign-bornOne native, one foreign-born parent 67 100.0% NativeChildren under 6 years - Living with one parent Native parent 37 100.0% NativeForeign-born parent 92 100.0% NativeChildren 6 to 17 years - Living with two parents Both parents native 108 100.0% NativeBoth parents foreign-born 55 51.2% Native53 48.8% Foreign-bornChildren 6 to 17 years - Living with one parent Native parent 4 100.0% NativeForeign-born parent 139 63.5% Native80 36.5% Foreign-born
Grandparents responsible for own grandchildren in Pelican Rapids
Grandparents (30 to 59 years) Other race 30 100.0% Not responsible for grandchildrenHispanic or Latino 25 100.0% Not responsible for grandchildren
Grandparents (60 years and over)