Races in Pembroke, Kentucky (KY) Detailed Stats
Data:
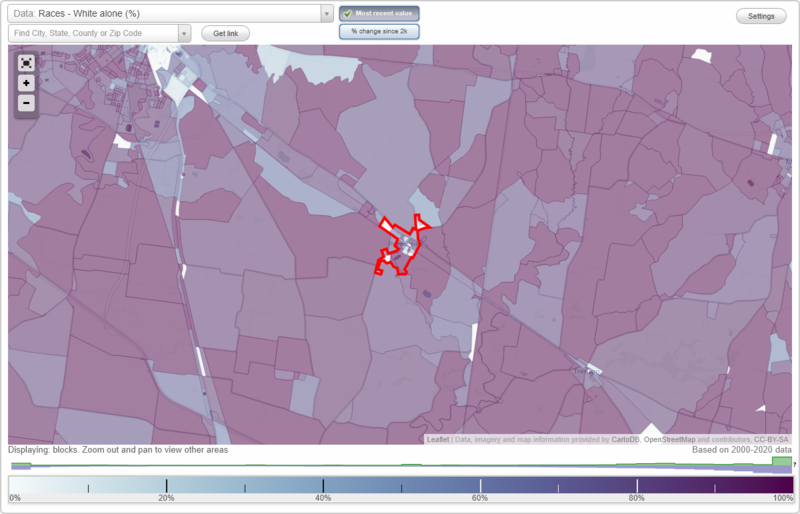
Races - White alone (%)
Races - White alone (% change since 2000)
Races - Black alone (%)
Races - Black alone (% change since 2000)
Races - American Indian alone (%)
Races - American Indian alone (% change since 2000)
Races - Asian alone (%)
Races - Asian alone (% change since 2000)
Races - Hispanic (%)
Races - Hispanic (% change since 2000)
Races - Native Hawaiian and Other Pacific Islander alone (%)
Races - Native Hawaiian and Other Pacific Islander alone (% change since 2000)
Races - Two or more races(%)
Races - Two or more races(% change since 2000)
Races - Other race alone (%)
Races - Other race alone (% change since 2000)
Racial diversity
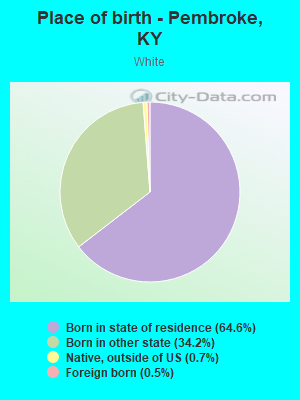
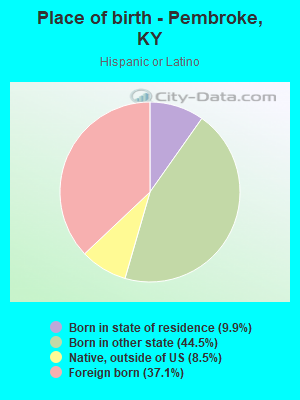
Place of birth - Born in state of residence (%)
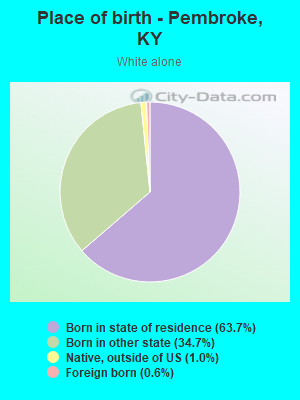
Place of birth - Born in state of residence (%) - White
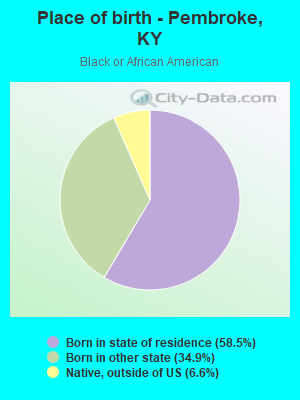
Place of birth - Born in state of residence (%) - Black or African American
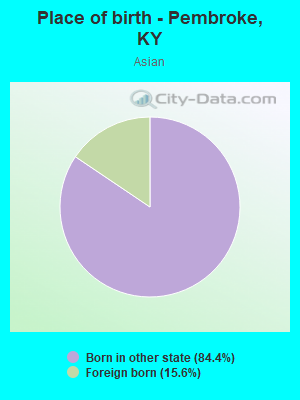
Place of birth - Born in state of residence (%) - Asian
Place of birth - Born in state of residence (%) - Hispanic or Latino
Place of birth - Born in state of residence (%) - American Indian and Alaska Native
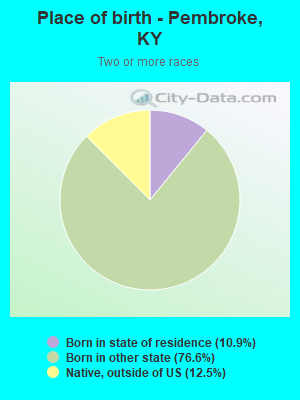
Place of birth - Born in state of residence (%) - Multirace
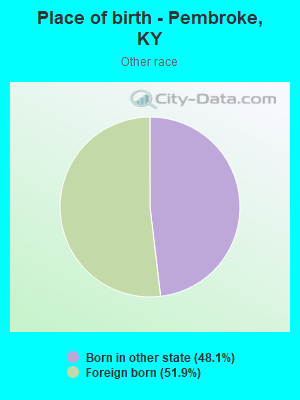
Place of birth - Born in state of residence (%) - Other Race
Place of birth - Born in other state (%)
Place of birth - Born in other state (%) - White
Place of birth - Born in other state (%) - Black or African American
Place of birth - Born in other state (%) - Asian
Place of birth - Born in other state (%) - Hispanic or Latino
Place of birth - Born in other state (%) - American Indian and Alaska Native
Place of birth - Born in other state (%) - Multirace
Place of birth - Born in other state (%) - Other Race
Place of birth - Native, outside of US (%)
Place of birth - Native, outside of US (%) - White
Place of birth - Native, outside of US (%) - Black or African American
Place of birth - Native, outside of US (%) - Asian
Place of birth - Native, outside of US (%) - Hispanic or Latino
Place of birth - Native, outside of US (%) - American Indian and Alaska Native
Place of birth - Native, outside of US (%) - Multirace
Place of birth - Native, outside of US (%) - Other Race
Place of birth - Foreign born (%)
Place of birth - Foreign born (%) - White
Place of birth - Foreign born (%) - Black or African American
Place of birth - Foreign born (%) - Asian
Place of birth - Foreign born (%) - Hispanic or Latino
Place of birth - Foreign born (%) - American Indian and Alaska Native
Place of birth - Foreign born (%) - Multirace
Place of birth - Foreign born (%) - Other Race
Residents speaking English at home (%)
Residents speaking English at home - Born in the United States (%)
Residents speaking English at home - Native, born elsewhere (%)
Residents speaking English at home - Foreign born (%)
Residents speaking Spanish at home (%)
Residents speaking Spanish at home - Born in the United States (%)
Residents speaking Spanish at home - Native, born elsewhere (%)
Residents speaking Spanish at home - Foreign born (%)
Residents speaking other language at home (%)
Residents speaking other language at home - Born in the United States (%)
Residents speaking other language at home - Native, born elsewhere (%)
Residents speaking other language at home - Foreign born (%)
Marital status - Never married (%)
Marital status - Now married (%)
Marital status - Separated (%)
Marital status - Widowed (%)
Marital status - Divorced (%)
Ancestries Reported - Arab (%)
Ancestries Reported - Czech (%)
Ancestries Reported - Danish (%)
Ancestries Reported - Dutch (%)
Ancestries Reported - English (%)
Ancestries Reported - French (%)
Ancestries Reported - French Canadian (%)
Ancestries Reported - German (%)
Ancestries Reported - Greek (%)
Ancestries Reported - Hungarian (%)
Ancestries Reported - Irish (%)
Ancestries Reported - Italian (%)
Ancestries Reported - Lithuanian (%)
Ancestries Reported - Norwegian (%)
Ancestries Reported - Polish (%)
Ancestries Reported - Portuguese (%)
Ancestries Reported - Russian (%)
Ancestries Reported - Scotch-Irish (%)
Ancestries Reported - Scottish (%)
Ancestries Reported - Slovak (%)
Ancestries Reported - Subsaharan African (%)
Ancestries Reported - Swedish (%)
Ancestries Reported - Swiss (%)
Ancestries Reported - Ukrainian (%)
Ancestries Reported - United States (%)
Ancestries Reported - Welsh (%)
Ancestries Reported - West Indian (%)
Ancestries Reported - Other (%)
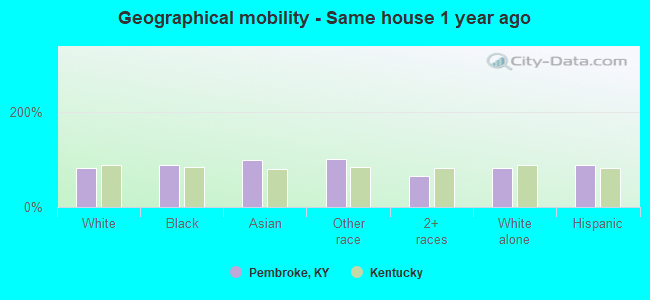
Geographical mobility - Same house 1 year ago (%)
Geographical mobility - Same house 1 year ago (%) - White
Geographical mobility - Same house 1 year ago (%) - Black or African American
Geographical mobility - Same house 1 year ago (%) - Asian
Geographical mobility - Same house 1 year ago (%) - Hispanic or Latino
Geographical mobility - Same house 1 year ago (%) - American Indian and Alaska Native
Geographical mobility - Same house 1 year ago (%) - Multirace
Geographical mobility - Same house 1 year ago (%) - Other Race
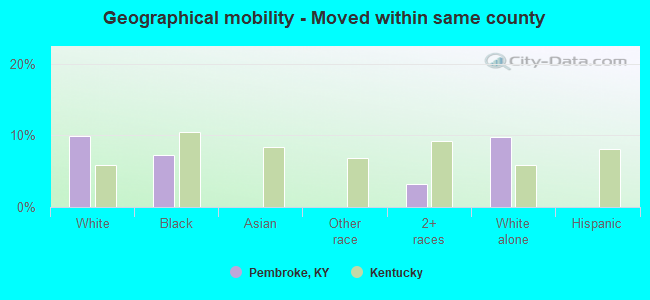
Geographical mobility - Moved within same county (%)
Geographical mobility - Moved within same county (%) - White
Geographical mobility - Moved within same county (%) - Black or African American
Geographical mobility - Moved within same county (%) - Asian
Geographical mobility - Moved within same county (%) - Hispanic or Latino
Geographical mobility - Moved within same county (%) - American Indian and Alaska Native
Geographical mobility - Moved within same county (%) - Multirace
Geographical mobility - Moved within same county (%) - Other Race
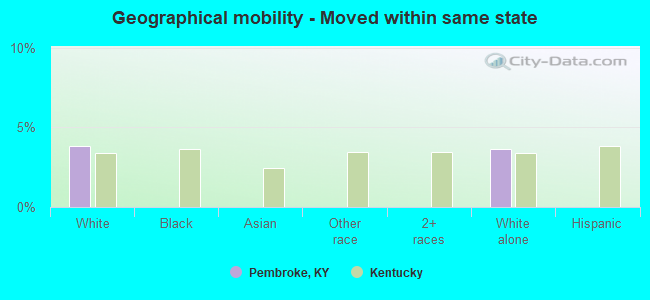
Geographical mobility - Moved from different county within same state (%)
Geographical mobility - Moved from different county within same state (%) - White
Geographical mobility - Moved from different county within same state (%) - Black or African American
Geographical mobility - Moved from different county within same state (%) - Asian
Geographical mobility - Moved from different county within same state (%) - Hispanic or Latino
Geographical mobility - Moved from different county within same state (%) - American Indian and Alaska Native
Geographical mobility - Moved from different county within same state (%) - Multirace
Geographical mobility - Moved from different county within same state (%) - Other Race
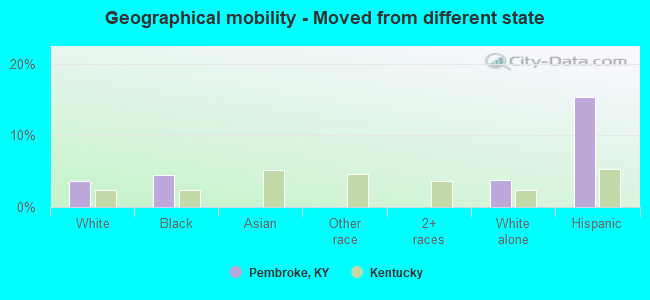
Geographical mobility - Moved from different state (%)
Geographical mobility - Moved from different state (%) - White
Geographical mobility - Moved from different state (%) - Black or African American
Geographical mobility - Moved from different state (%) - Asian
Geographical mobility - Moved from different state (%) - Hispanic or Latino
Geographical mobility - Moved from different state (%) - American Indian and Alaska Native
Geographical mobility - Moved from different state (%) - Multirace
Geographical mobility - Moved from different state (%) - Other Race
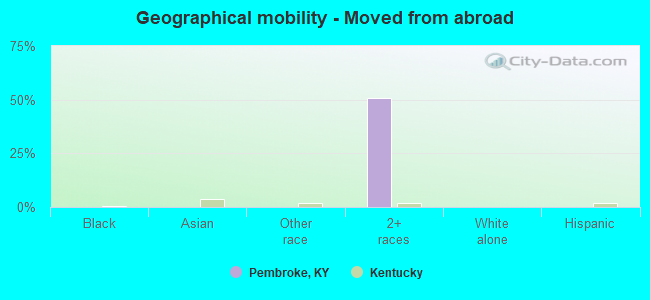
Geographical mobility - Moved from abroad (%)
Geographical mobility - Moved from abroad (%) - White
Geographical mobility - Moved from abroad (%) - Black or African American
Geographical mobility - Moved from abroad (%) - Asian
Geographical mobility - Moved from abroad (%) - Hispanic or Latino
Geographical mobility - Moved from abroad (%) - American Indian and Alaska Native
Geographical mobility - Moved from abroad (%) - Multirace
Geographical mobility - Moved from abroad (%) - Other Race
Place of birth for the foreign-born population - Ireland (%)
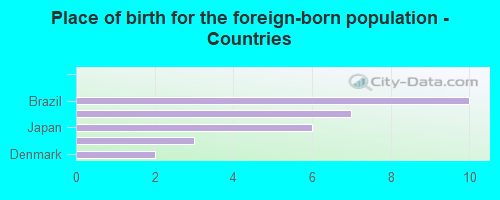
Place of birth for the foreign-born population - Denmark (%)
Place of birth for the foreign-born population - Norway (%)
Place of birth for the foreign-born population - Sweden (%)
Place of birth for the foreign-born population - United Kingdom (%)
Place of birth for the foreign-born population - England (%)
Place of birth for the foreign-born population - Scotland (%)
Place of birth for the foreign-born population - Other Northern Europe (%)
Place of birth for the foreign-born population - Austria (%)
Place of birth for the foreign-born population - Belgium (%)
Place of birth for the foreign-born population - France (%)
Place of birth for the foreign-born population - Germany (%)
Place of birth for the foreign-born population - Netherlands (%)
Place of birth for the foreign-born population - Switzerland (%)
Place of birth for the foreign-born population - Other Western Europe (%)
Place of birth for the foreign-born population - Greece (%)
Place of birth for the foreign-born population - Italy (%)
Place of birth for the foreign-born population - Portugal (%)
Place of birth for the foreign-born population - Spain (%)
Place of birth for the foreign-born population - Other Southern Europe (%)
Place of birth for the foreign-born population - Albania (%)
Place of birth for the foreign-born population - Belarus (%)
Place of birth for the foreign-born population - Bosnia and Herzegovina (%)
Place of birth for the foreign-born population - Bulgaria (%)
Place of birth for the foreign-born population - Croatia (%)
Place of birth for the foreign-born population - Czechoslovakia (%)
Place of birth for the foreign-born population - Hungary (%)
Place of birth for the foreign-born population - Latvia (%)
Place of birth for the foreign-born population - Lithuania (%)
Place of birth for the foreign-born population - North Macedonia (Macedonia) (%)
Place of birth for the foreign-born population - Moldova (%)
Place of birth for the foreign-born population - Poland (%)
Place of birth for the foreign-born population - Romania (%)
Place of birth for the foreign-born population - Russia (%)
Place of birth for the foreign-born population - Serbia (%)
Place of birth for the foreign-born population - Ukraine (%)
Place of birth for the foreign-born population - Other Eastern Europe (%)
Place of birth for the foreign-born population - China (%)
Place of birth for the foreign-born population - Hong Kong (%)
Place of birth for the foreign-born population - Taiwan (%)
Place of birth for the foreign-born population - Japan (%)
Place of birth for the foreign-born population - Korea (%)
Place of birth for the foreign-born population - Other Eastern Asia (%)
Place of birth for the foreign-born population - Afghanistan (%)
Place of birth for the foreign-born population - Bangladesh (%)
Place of birth for the foreign-born population - India (%)
Place of birth for the foreign-born population - Iran (%)
Place of birth for the foreign-born population - Kazakhstan (%)
Place of birth for the foreign-born population - Nepal (%)
Place of birth for the foreign-born population - Pakistan (%)
Place of birth for the foreign-born population - Sri Lanka (%)
Place of birth for the foreign-born population - Uzbekistan (%)
Place of birth for the foreign-born population - Other South Central Asia (%)
Place of birth for the foreign-born population - Burma (%)
Place of birth for the foreign-born population - Cambodia (%)
Place of birth for the foreign-born population - Indonesia (%)
Place of birth for the foreign-born population - Laos (%)
Place of birth for the foreign-born population - Malaysia (%)
Place of birth for the foreign-born population - Philippines (%)
Place of birth for the foreign-born population - Singapore (%)
Place of birth for the foreign-born population - Thailand (%)
Place of birth for the foreign-born population - Vietnam (%)
Place of birth for the foreign-born population - Other South Eastern Asia (%)
Place of birth for the foreign-born population - Armenia (%)
Place of birth for the foreign-born population - Iraq (%)
Place of birth for the foreign-born population - Israel (%)
Place of birth for the foreign-born population - Jordan (%)
Place of birth for the foreign-born population - Kuwait (%)
Place of birth for the foreign-born population - Lebanon (%)
Place of birth for the foreign-born population - Saudi Arabia (%)
Place of birth for the foreign-born population - Syria (%)
Place of birth for the foreign-born population - Turkey (%)
Place of birth for the foreign-born population - Yemen (%)
Place of birth for the foreign-born population - Other Western Asia (%)
Place of birth for the foreign-born population - Eritrea (%)
Place of birth for the foreign-born population - Ethiopia (%)
Place of birth for the foreign-born population - Kenya (%)
Place of birth for the foreign-born population - Somalia (%)
Place of birth for the foreign-born population - Uganda (%)
Place of birth for the foreign-born population - Zimbabwe (%)
Place of birth for the foreign-born population - Other Eastern Africa (%)
Place of birth for the foreign-born population - Cameroon (%)
Place of birth for the foreign-born population - Congo (%)
Place of birth for the foreign-born population - Democratic Republic of Congo (Zaire) (%)
Place of birth for the foreign-born population - Other Middle Africa (%)
Place of birth for the foreign-born population - Egypt (%)
Place of birth for the foreign-born population - Morocco (%)
Place of birth for the foreign-born population - Sudan (%)
Place of birth for the foreign-born population - Other Northern Africa (%)
Place of birth for the foreign-born population - South Africa (%)
Place of birth for the foreign-born population - Other Southern Africa (%)
Place of birth for the foreign-born population - Cabo Verde (%)
Place of birth for the foreign-born population - Ghana (%)
Place of birth for the foreign-born population - Liberia (%)
Place of birth for the foreign-born population - Nigeria (%)
Place of birth for the foreign-born population - Senegal (%)
Place of birth for the foreign-born population - Sierra Leone (%)
Place of birth for the foreign-born population - Other Western Africa (%)
Place of birth for the foreign-born population - Australia (%)
Place of birth for the foreign-born population - New Zealand (%)
Place of birth for the foreign-born population - Fiji (%)
Place of birth for the foreign-born population - Micronesia (%)
Place of birth for the foreign-born population - Bahamas (%)
Place of birth for the foreign-born population - Barbados (%)
Place of birth for the foreign-born population - Cuba (%)
Place of birth for the foreign-born population - Dominica (%)
Place of birth for the foreign-born population - Dominican Republic (%)
Place of birth for the foreign-born population - Grenada (%)
Place of birth for the foreign-born population - Haiti (%)
Place of birth for the foreign-born population - Jamaica (%)
Place of birth for the foreign-born population - St. Vincent and the Grenadines (%)
Place of birth for the foreign-born population - Trinidad and Tobago (%)
Place of birth for the foreign-born population - West Indies (%)
Place of birth for the foreign-born population - Other Caribbean (%)
Place of birth for the foreign-born population - Belize (%)
Place of birth for the foreign-born population - Costa Rica (%)
Place of birth for the foreign-born population - El Salvador (%)
Place of birth for the foreign-born population - Guatemala (%)
Place of birth for the foreign-born population - Honduras (%)
Place of birth for the foreign-born population - Mexico (%)
Place of birth for the foreign-born population - Nicaragua (%)
Place of birth for the foreign-born population - Panama (%)
Place of birth for the foreign-born population - Other Central America (%)
Place of birth for the foreign-born population - Argentina (%)
Place of birth for the foreign-born population - Bolivia (%)
Place of birth for the foreign-born population - Brazil (%)
Place of birth for the foreign-born population - Chile (%)
Place of birth for the foreign-born population - Colombia (%)
Place of birth for the foreign-born population - Ecuador (%)
Place of birth for the foreign-born population - Guyana (%)
Place of birth for the foreign-born population - Peru (%)
Place of birth for the foreign-born population - Uruguay (%)
Place of birth for the foreign-born population - Venezuela (%)
Place of birth for the foreign-born population - Other South America (%)
Place of birth for the foreign-born population - Canada (%)
Place of birth for the foreign-born population - Other Northern America (%)
Place of birth for the foreign-born population - Other (%)
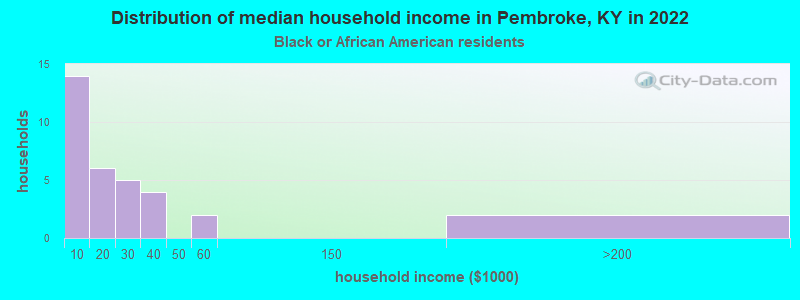
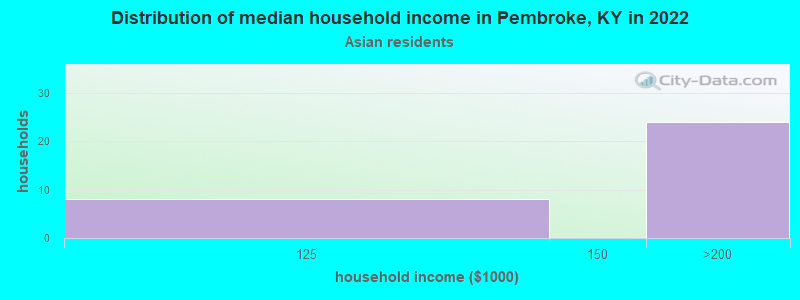
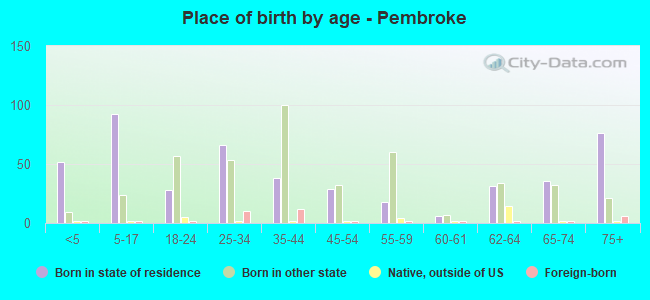
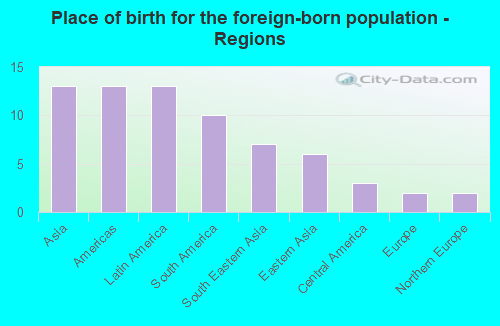
According to 2022 data, the most numerous races in Pembroke, KY are White alone (640 residents), Black alone (70 residents), and Hispanic (38 residents). 89.7% of Pembroke residents speak English at home. 3.1% of Pembroke, KY residents are foreign-born (1.4% born in Asia, 1.4% born in Latin America), which is 29.0% less than the foreign-born rate of 4.0% across the entire state of Kentucky.
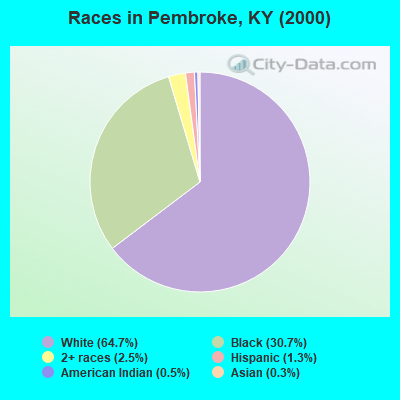
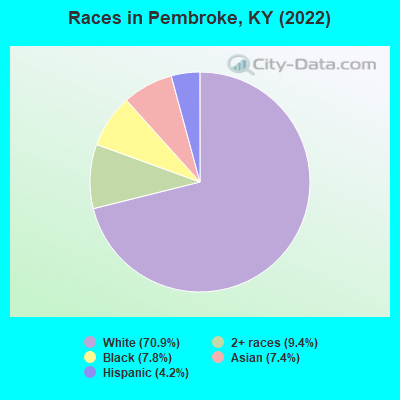
Race distribution in Pembroke
2000 2022
3,608,013 89.3% White alone 293,639 7.3% Black alone 59,939 1.5% Hispanic 37,750 0.9% Two or more races 29,368 0.7% Asian alone 7,939 0.2% American Indian alone 3,846 0.10% Other race alone 1,275 0.03% Native Hawaiian and Other
3,710,998 82.2% White alone 343,194 7.6% Black alone 187,483 4.2% Hispanic 187,394 4.2% Two or more races 62,240 1.4% Asian alone 13,529 0.3% Other race alone 4,302 0.10% American Indian alone 3,170 0.07% Native Hawaiian and Other
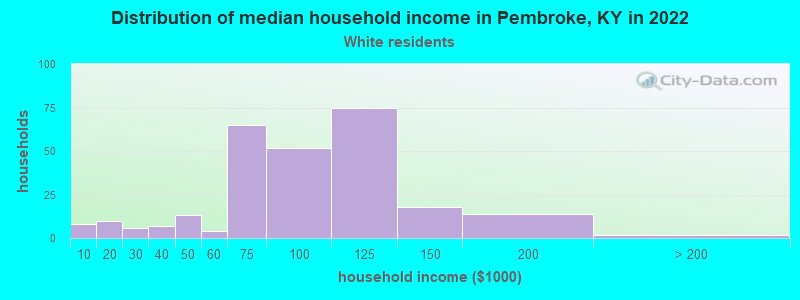
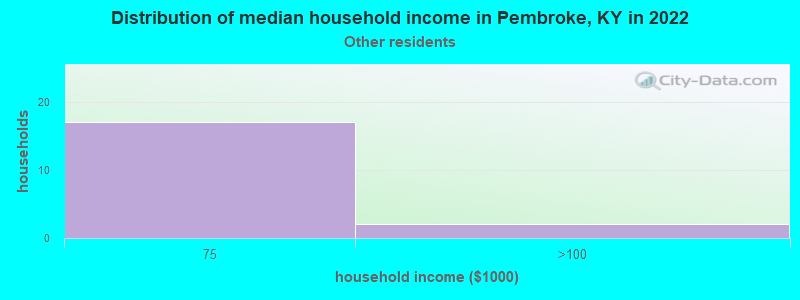
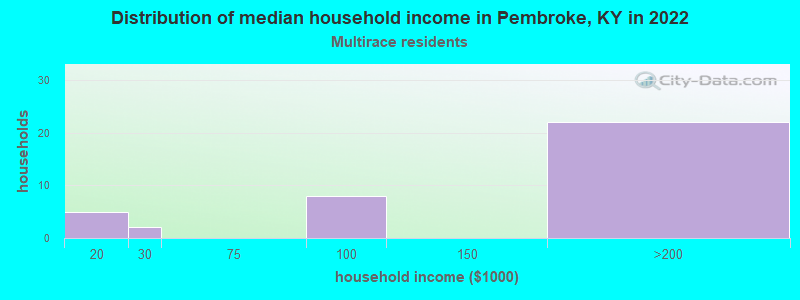
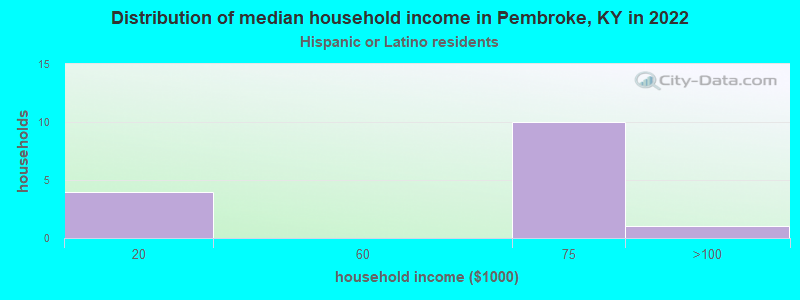
Income and house value in Pembroke Median household income in 2022 $97,190 White non-Hispanic householders$16,611 Black householdersover $200,000 Two or more races householdersMedian 2022 house value $221,661 White Non-Hispanic householders$138,154 Black or African American householders
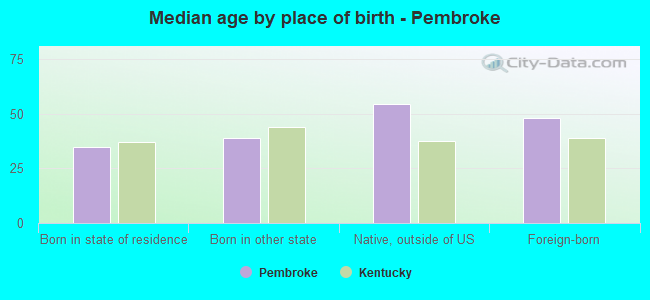
Median age by race in Pembroke
37.7 Median age for White residents37.1 37.4 48.4 Median age for Black or African American residents42.4 69.4 -677,206,850.4 Median age for American Indian / Alaska Native residents-1,464,985,992.9 -630,065,358.8 63.1 Median age for Asian residents-688,492,062.8 -1,061,797,751.7 -696,969,696.3 Median age for Native Hawaiian / Pacific Islander residents-724,043,715.1 -853,801,168.7 29.8 Median age for Other race residents-679,186,227.8 31.0 24.7 Median age for Two or more races residents19.7 59.3 37.2 Median age for White alone residents36.4 37.2 23.4 Median age for Hispanic or Latino residents20.4 21.7
Owner/renter occupied households by race in Pembroke
House owners and renters - White residents 190 81.4% Owner occupied43 18.6% Renter occupiedHouse owners and renters - Black or African American residents 36 79.0% Owner occupied9 21.0% Renter occupiedHouse owners and renters - Asian residents 8 20.6% Owner occupied30 79.4% Renter occupiedHouse owners and renters - Other race residents 1 12.7% Owner occupied10 87.3% Renter occupiedHouse owners and renters - Two or more races residents 29 86.7% Owner occupied4 13.3% Renter occupiedHouse owners and renters - White alone residents 194 81.5% Owner occupied44 18.5% Renter occupiedHouse owners and renters - Hispanic or Latino residents 1 7.6% Owner occupied14 92.4% Renter occupied
Language usage in Pembroke
English speakers - Total 89.7% of residents of Pembroke speak English at home.
0.8% of residents speak Spanish at home 7 100.0% Speak English very well9.5% of residents speak other language at home 58 72.5% Speak English very well22 27.5% Speak English less than very well
English speakers - Born in the United States 88.0% of residents of Pembroke speak English at home.
11.3% of residents speak other language at home 44 100.0% Speak English very well
All residents speak only English at home
English speakers - Foreign-born 28.6% of residents of Pembroke speak English at home.
7.1% of residents speak Spanish at home 2 100.0% Speak English very well75.0% of residents speak other language at home 1 4.8% Speak English very well20 95.2% Speak English less than very well
White (Caucasian) - Speak another language Native:
0.7% (4)Foreign-born:
89.7% (3)
Asian - Speak only English Native:
40.1% (23)Foreign-born:
44.3% (5)
Asian - Speak another language Native:
60.2% (35)Foreign-born:
54.3% (6)
White alone - Speak another language Native:
0.9% (5)Foreign-born:
99.2% (4)
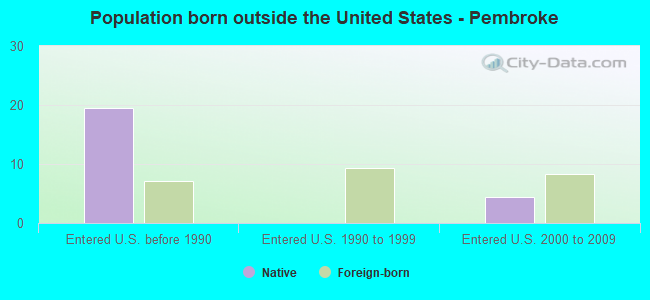
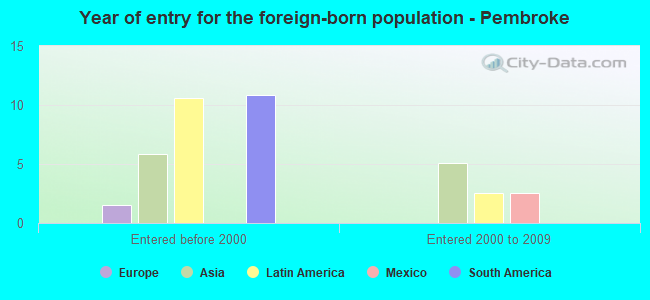
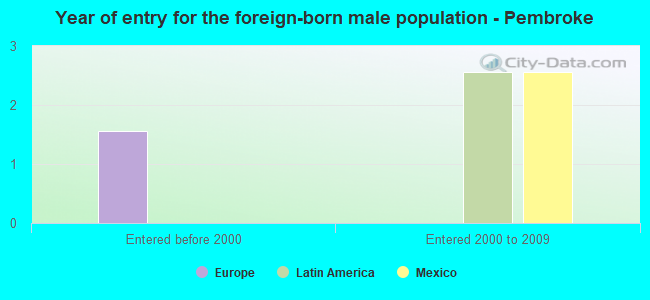
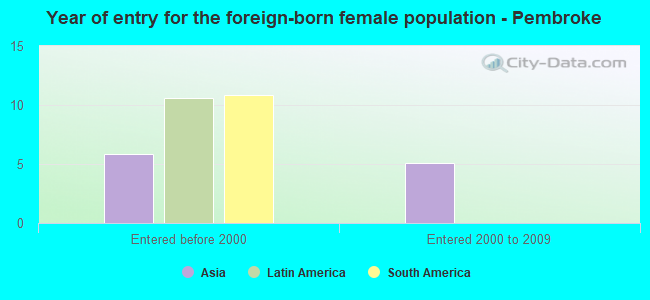
Foreign-born residents in Pembroke 28 residents are foreign born (1.4% Asia , 1.4% Latin America ).
This city:
3.1%Kentucky:
4.1%
Marital status for residents in Pembroke Marital status - White (Caucasian) population 15 years and over
Males 23.3% Never married62.5% Now married0.8% Separated2.8% Widowed10.7% DivorcedFemales 7.0% Never married61.1% Now married0.0% Separated18.3% Widowed13.6% DivorcedWomen who gave birth in the past 12 months Now married:
100.0% (17)Unmarried:
0.0% (0)
Women who did not give birth in the past 12 months Now married:
74.0% (77)Unmarried:
26.0% (27)
Marital status - Black or African American population 15 years and over
Males 55.6% Never married33.3% Now married11.1% Separated0.0% Widowed0.0% DivorcedFemales 23.8% Never married7.1% Now married0.0% Separated61.9% Widowed7.1% DivorcedWomen who did not give birth in the past 12 months Now married:
0.0% (0)Unmarried:
100.0% (8)
Marital status - Asian population 15 years and over
Males 0.0% Never married59.0% Now married0.0% Separated41.0% Widowed0.0% DivorcedFemales 0.0% Never married53.8% Now married0.0% Separated46.2% Widowed0.0% DivorcedWomen who did not give birth in the past 12 months Now married:
100.0% (6)Unmarried:
0.0% (0)
Marital status - Other race population 15 years and over
Males 0.0% Never married100.0% Now married0.0% Separated0.0% Widowed0.0% DivorcedFemales 42.1% Never married57.9% Now married0.0% Separated0.0% Widowed0.0% DivorcedWomen who did not give birth in the past 12 months Now married:
57.9% (14)Unmarried:
42.1% (11)
Marital status - Two or more races population 15 years and over
Males 84.2% Never married7.9% Now married0.0% Separated0.0% Widowed7.9% DivorcedFemales 35.3% Never married64.7% Now married0.0% Separated0.0% Widowed0.0% DivorcedWomen who gave birth in the past 12 months Now married:
100.0% (4)Unmarried:
0.0% (0)
Women who did not give birth in the past 12 months Now married:
14.3% (3)Unmarried:
85.7% (17)
Marital status - White alone, not Hispanic / Latino population 15 years and over
Males 23.3% Never married62.5% Now married0.8% Separated2.8% Widowed10.7% DivorcedFemales 7.0% Never married61.1% Now married0.0% Separated18.3% Widowed13.6% DivorcedWomen who gave birth in the past 12 months Now married:
100.0% (18)Unmarried:
0.0% (0)
Women who did not give birth in the past 12 months Now married:
74.0% (80)Unmarried:
26.0% (28)
Marital status - Hispanic or Latino population 15 years and over
Males 66.7% Never married33.3% Now married0.0% Separated0.0% Widowed0.0% DivorcedFemales 47.6% Never married52.4% Now married0.0% Separated0.0% Widowed0.0% DivorcedWomen who did not give birth in the past 12 months Now married:
52.4% (14)Unmarried:
47.6% (12)
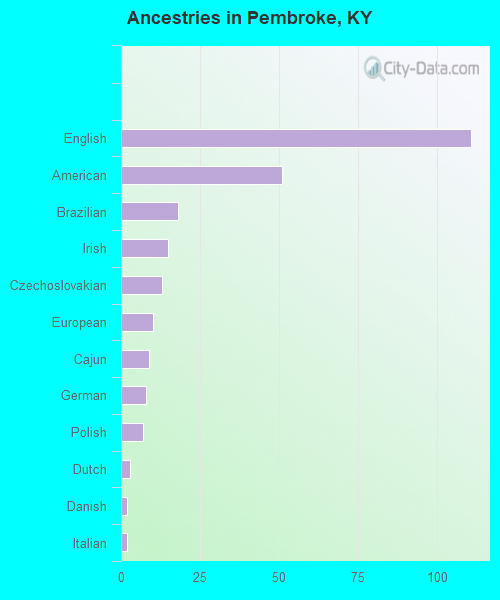
Ancestries in Pembroke
111 30.0% English51 13.8% American18 4.9% Brazilian15 4.1% Irish13 3.5% Czechoslovakian10 2.7% European9 2.4% Cajun8 2.2% German7 1.9% Polish3 0.8% Dutch2 0.5% Danish2 0.5% Italian1 0.3% Scotch-Irish
Children Nativity (place of birth) in Pembroke
Children under 6 years - Living with two parents Both parents native 65 100.0% NativeChildren under 6 years - Living with one parent Native parent 5 100.0% Native
Children 6 to 17 years - Living with two parents Both parents native 83 100.0% NativeOne native, one foreign-born parent 2 100.0% NativeChildren 6 to 17 years - Living with one parent Native parent 3 100.0% Native