Races in Perth Amboy, New Jersey (NJ) Detailed Stats
Data:
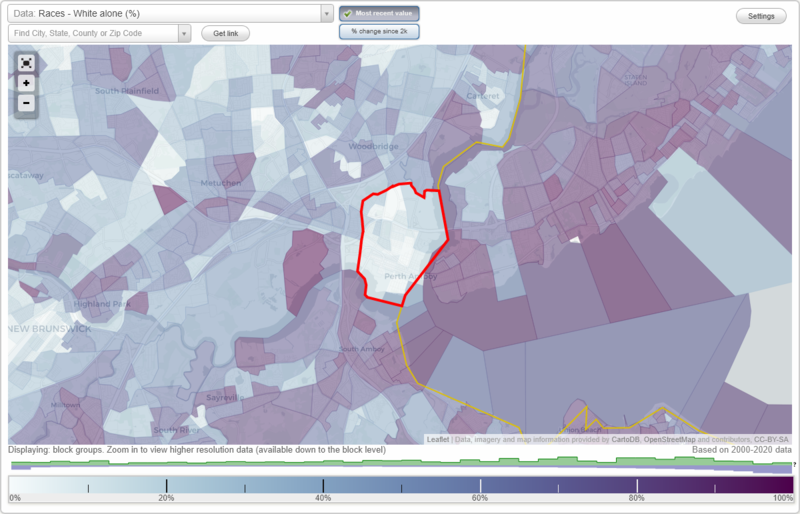
Races - White alone (%)
Races - White alone (% change since 2000)
Races - Black alone (%)
Races - Black alone (% change since 2000)
Races - American Indian alone (%)
Races - American Indian alone (% change since 2000)
Races - Asian alone (%)
Races - Asian alone (% change since 2000)
Races - Hispanic (%)
Races - Hispanic (% change since 2000)
Races - Native Hawaiian and Other Pacific Islander alone (%)
Races - Native Hawaiian and Other Pacific Islander alone (% change since 2000)
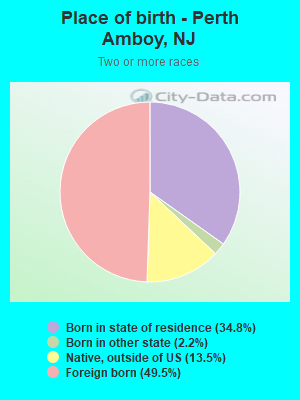
Races - Two or more races(%)
Races - Two or more races(% change since 2000)
Races - Other race alone (%)
Races - Other race alone (% change since 2000)
Racial diversity
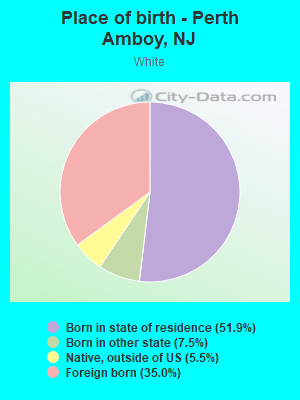
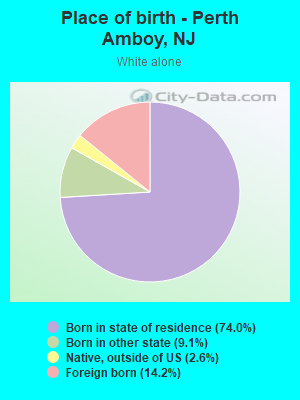
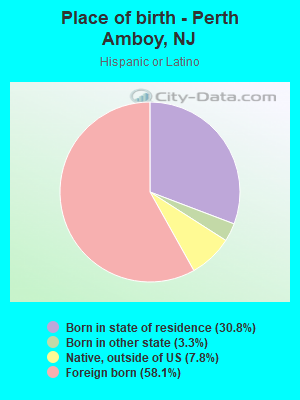
Place of birth - Born in state of residence (%)
Place of birth - Born in state of residence (%) - White
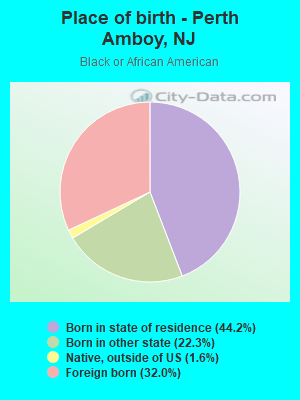
Place of birth - Born in state of residence (%) - Black or African American
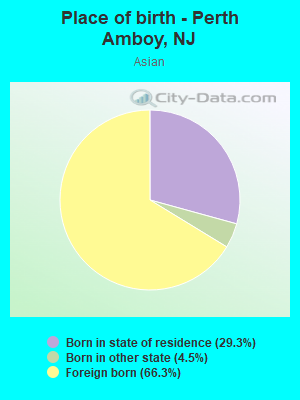
Place of birth - Born in state of residence (%) - Asian
Place of birth - Born in state of residence (%) - Hispanic or Latino
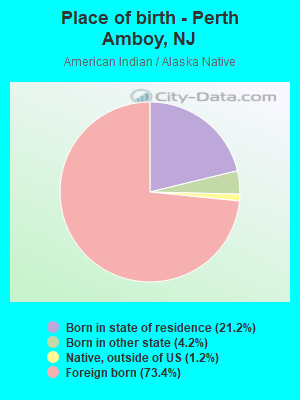
Place of birth - Born in state of residence (%) - American Indian and Alaska Native
Place of birth - Born in state of residence (%) - Multirace
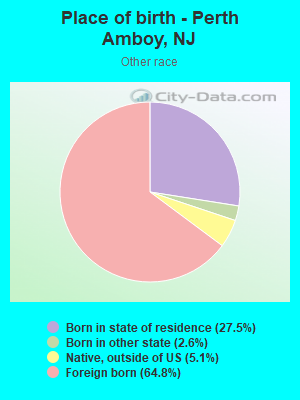
Place of birth - Born in state of residence (%) - Other Race
Place of birth - Born in other state (%)
Place of birth - Born in other state (%) - White
Place of birth - Born in other state (%) - Black or African American
Place of birth - Born in other state (%) - Asian
Place of birth - Born in other state (%) - Hispanic or Latino
Place of birth - Born in other state (%) - American Indian and Alaska Native
Place of birth - Born in other state (%) - Multirace
Place of birth - Born in other state (%) - Other Race
Place of birth - Native, outside of US (%)
Place of birth - Native, outside of US (%) - White
Place of birth - Native, outside of US (%) - Black or African American
Place of birth - Native, outside of US (%) - Asian
Place of birth - Native, outside of US (%) - Hispanic or Latino
Place of birth - Native, outside of US (%) - American Indian and Alaska Native
Place of birth - Native, outside of US (%) - Multirace
Place of birth - Native, outside of US (%) - Other Race
Place of birth - Foreign born (%)
Place of birth - Foreign born (%) - White
Place of birth - Foreign born (%) - Black or African American
Place of birth - Foreign born (%) - Asian
Place of birth - Foreign born (%) - Hispanic or Latino
Place of birth - Foreign born (%) - American Indian and Alaska Native
Place of birth - Foreign born (%) - Multirace
Place of birth - Foreign born (%) - Other Race
Residents speaking English at home (%)
Residents speaking English at home - Born in the United States (%)
Residents speaking English at home - Native, born elsewhere (%)
Residents speaking English at home - Foreign born (%)
Residents speaking Spanish at home (%)
Residents speaking Spanish at home - Born in the United States (%)
Residents speaking Spanish at home - Native, born elsewhere (%)
Residents speaking Spanish at home - Foreign born (%)
Residents speaking other language at home (%)
Residents speaking other language at home - Born in the United States (%)
Residents speaking other language at home - Native, born elsewhere (%)
Residents speaking other language at home - Foreign born (%)
Marital status - Never married (%)
Marital status - Now married (%)
Marital status - Separated (%)
Marital status - Widowed (%)
Marital status - Divorced (%)
Ancestries Reported - Arab (%)
Ancestries Reported - Czech (%)
Ancestries Reported - Danish (%)
Ancestries Reported - Dutch (%)
Ancestries Reported - English (%)
Ancestries Reported - French (%)
Ancestries Reported - French Canadian (%)
Ancestries Reported - German (%)
Ancestries Reported - Greek (%)
Ancestries Reported - Hungarian (%)
Ancestries Reported - Irish (%)
Ancestries Reported - Italian (%)
Ancestries Reported - Lithuanian (%)
Ancestries Reported - Norwegian (%)
Ancestries Reported - Polish (%)
Ancestries Reported - Portuguese (%)
Ancestries Reported - Russian (%)
Ancestries Reported - Scotch-Irish (%)
Ancestries Reported - Scottish (%)
Ancestries Reported - Slovak (%)
Ancestries Reported - Subsaharan African (%)
Ancestries Reported - Swedish (%)
Ancestries Reported - Swiss (%)
Ancestries Reported - Ukrainian (%)
Ancestries Reported - United States (%)
Ancestries Reported - Welsh (%)
Ancestries Reported - West Indian (%)
Ancestries Reported - Other (%)
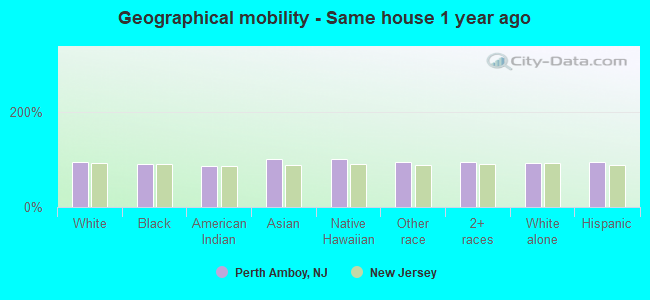
Geographical mobility - Same house 1 year ago (%)
Geographical mobility - Same house 1 year ago (%) - White
Geographical mobility - Same house 1 year ago (%) - Black or African American
Geographical mobility - Same house 1 year ago (%) - Asian
Geographical mobility - Same house 1 year ago (%) - Hispanic or Latino
Geographical mobility - Same house 1 year ago (%) - American Indian and Alaska Native
Geographical mobility - Same house 1 year ago (%) - Multirace
Geographical mobility - Same house 1 year ago (%) - Other Race
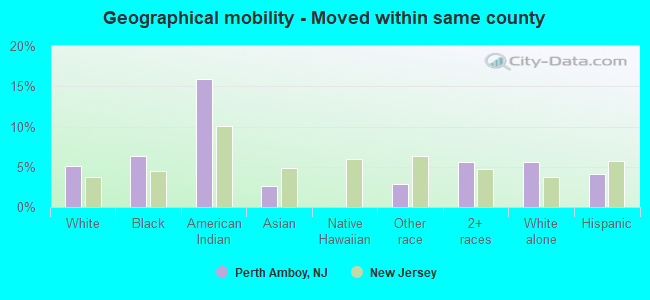
Geographical mobility - Moved within same county (%)
Geographical mobility - Moved within same county (%) - White
Geographical mobility - Moved within same county (%) - Black or African American
Geographical mobility - Moved within same county (%) - Asian
Geographical mobility - Moved within same county (%) - Hispanic or Latino
Geographical mobility - Moved within same county (%) - American Indian and Alaska Native
Geographical mobility - Moved within same county (%) - Multirace
Geographical mobility - Moved within same county (%) - Other Race
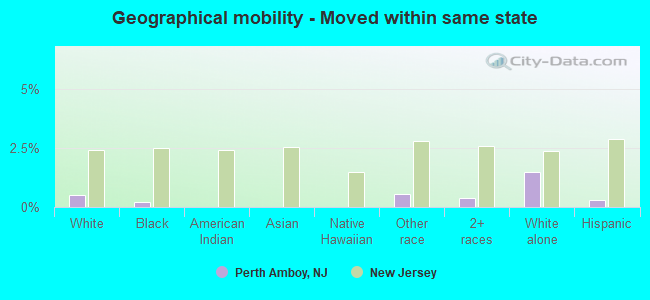
Geographical mobility - Moved from different county within same state (%)
Geographical mobility - Moved from different county within same state (%) - White
Geographical mobility - Moved from different county within same state (%) - Black or African American
Geographical mobility - Moved from different county within same state (%) - Asian
Geographical mobility - Moved from different county within same state (%) - Hispanic or Latino
Geographical mobility - Moved from different county within same state (%) - American Indian and Alaska Native
Geographical mobility - Moved from different county within same state (%) - Multirace
Geographical mobility - Moved from different county within same state (%) - Other Race
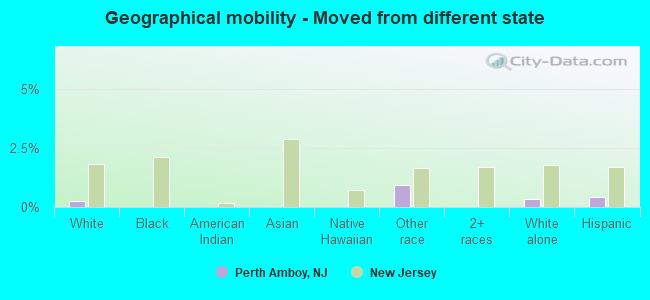
Geographical mobility - Moved from different state (%)
Geographical mobility - Moved from different state (%) - White
Geographical mobility - Moved from different state (%) - Black or African American
Geographical mobility - Moved from different state (%) - Asian
Geographical mobility - Moved from different state (%) - Hispanic or Latino
Geographical mobility - Moved from different state (%) - American Indian and Alaska Native
Geographical mobility - Moved from different state (%) - Multirace
Geographical mobility - Moved from different state (%) - Other Race
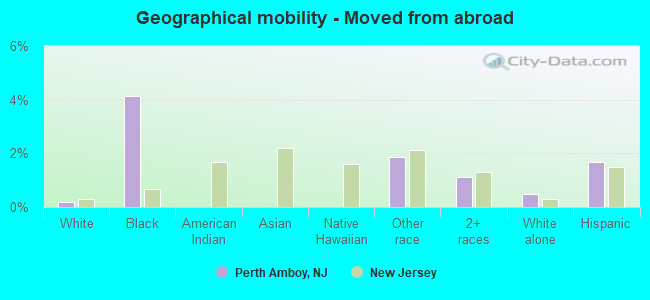
Geographical mobility - Moved from abroad (%)
Geographical mobility - Moved from abroad (%) - White
Geographical mobility - Moved from abroad (%) - Black or African American
Geographical mobility - Moved from abroad (%) - Asian
Geographical mobility - Moved from abroad (%) - Hispanic or Latino
Geographical mobility - Moved from abroad (%) - American Indian and Alaska Native
Geographical mobility - Moved from abroad (%) - Multirace
Geographical mobility - Moved from abroad (%) - Other Race
Place of birth for the foreign-born population - Ireland (%)
Place of birth for the foreign-born population - Denmark (%)
Place of birth for the foreign-born population - Norway (%)
Place of birth for the foreign-born population - Sweden (%)
Place of birth for the foreign-born population - United Kingdom (%)
Place of birth for the foreign-born population - England (%)
Place of birth for the foreign-born population - Scotland (%)
Place of birth for the foreign-born population - Other Northern Europe (%)
Place of birth for the foreign-born population - Austria (%)
Place of birth for the foreign-born population - Belgium (%)
Place of birth for the foreign-born population - France (%)
Place of birth for the foreign-born population - Germany (%)
Place of birth for the foreign-born population - Netherlands (%)
Place of birth for the foreign-born population - Switzerland (%)
Place of birth for the foreign-born population - Other Western Europe (%)
Place of birth for the foreign-born population - Greece (%)
Place of birth for the foreign-born population - Italy (%)
Place of birth for the foreign-born population - Portugal (%)
Place of birth for the foreign-born population - Spain (%)
Place of birth for the foreign-born population - Other Southern Europe (%)
Place of birth for the foreign-born population - Albania (%)
Place of birth for the foreign-born population - Belarus (%)
Place of birth for the foreign-born population - Bosnia and Herzegovina (%)
Place of birth for the foreign-born population - Bulgaria (%)
Place of birth for the foreign-born population - Croatia (%)
Place of birth for the foreign-born population - Czechoslovakia (%)
Place of birth for the foreign-born population - Hungary (%)
Place of birth for the foreign-born population - Latvia (%)
Place of birth for the foreign-born population - Lithuania (%)
Place of birth for the foreign-born population - North Macedonia (Macedonia) (%)
Place of birth for the foreign-born population - Moldova (%)
Place of birth for the foreign-born population - Poland (%)
Place of birth for the foreign-born population - Romania (%)
Place of birth for the foreign-born population - Russia (%)
Place of birth for the foreign-born population - Serbia (%)
Place of birth for the foreign-born population - Ukraine (%)
Place of birth for the foreign-born population - Other Eastern Europe (%)
Place of birth for the foreign-born population - China (%)
Place of birth for the foreign-born population - Hong Kong (%)
Place of birth for the foreign-born population - Taiwan (%)
Place of birth for the foreign-born population - Japan (%)
Place of birth for the foreign-born population - Korea (%)
Place of birth for the foreign-born population - Other Eastern Asia (%)
Place of birth for the foreign-born population - Afghanistan (%)
Place of birth for the foreign-born population - Bangladesh (%)
Place of birth for the foreign-born population - India (%)
Place of birth for the foreign-born population - Iran (%)
Place of birth for the foreign-born population - Kazakhstan (%)
Place of birth for the foreign-born population - Nepal (%)
Place of birth for the foreign-born population - Pakistan (%)
Place of birth for the foreign-born population - Sri Lanka (%)
Place of birth for the foreign-born population - Uzbekistan (%)
Place of birth for the foreign-born population - Other South Central Asia (%)
Place of birth for the foreign-born population - Burma (%)
Place of birth for the foreign-born population - Cambodia (%)
Place of birth for the foreign-born population - Indonesia (%)
Place of birth for the foreign-born population - Laos (%)
Place of birth for the foreign-born population - Malaysia (%)
Place of birth for the foreign-born population - Philippines (%)
Place of birth for the foreign-born population - Singapore (%)
Place of birth for the foreign-born population - Thailand (%)
Place of birth for the foreign-born population - Vietnam (%)
Place of birth for the foreign-born population - Other South Eastern Asia (%)
Place of birth for the foreign-born population - Armenia (%)
Place of birth for the foreign-born population - Iraq (%)
Place of birth for the foreign-born population - Israel (%)
Place of birth for the foreign-born population - Jordan (%)
Place of birth for the foreign-born population - Kuwait (%)
Place of birth for the foreign-born population - Lebanon (%)
Place of birth for the foreign-born population - Saudi Arabia (%)
Place of birth for the foreign-born population - Syria (%)
Place of birth for the foreign-born population - Turkey (%)
Place of birth for the foreign-born population - Yemen (%)
Place of birth for the foreign-born population - Other Western Asia (%)
Place of birth for the foreign-born population - Eritrea (%)
Place of birth for the foreign-born population - Ethiopia (%)
Place of birth for the foreign-born population - Kenya (%)
Place of birth for the foreign-born population - Somalia (%)
Place of birth for the foreign-born population - Uganda (%)
Place of birth for the foreign-born population - Zimbabwe (%)
Place of birth for the foreign-born population - Other Eastern Africa (%)
Place of birth for the foreign-born population - Cameroon (%)
Place of birth for the foreign-born population - Congo (%)
Place of birth for the foreign-born population - Democratic Republic of Congo (Zaire) (%)
Place of birth for the foreign-born population - Other Middle Africa (%)
Place of birth for the foreign-born population - Egypt (%)
Place of birth for the foreign-born population - Morocco (%)
Place of birth for the foreign-born population - Sudan (%)
Place of birth for the foreign-born population - Other Northern Africa (%)
Place of birth for the foreign-born population - South Africa (%)
Place of birth for the foreign-born population - Other Southern Africa (%)
Place of birth for the foreign-born population - Cabo Verde (%)
Place of birth for the foreign-born population - Ghana (%)
Place of birth for the foreign-born population - Liberia (%)
Place of birth for the foreign-born population - Nigeria (%)
Place of birth for the foreign-born population - Senegal (%)
Place of birth for the foreign-born population - Sierra Leone (%)
Place of birth for the foreign-born population - Other Western Africa (%)
Place of birth for the foreign-born population - Australia (%)
Place of birth for the foreign-born population - New Zealand (%)
Place of birth for the foreign-born population - Fiji (%)
Place of birth for the foreign-born population - Micronesia (%)
Place of birth for the foreign-born population - Bahamas (%)
Place of birth for the foreign-born population - Barbados (%)
Place of birth for the foreign-born population - Cuba (%)
Place of birth for the foreign-born population - Dominica (%)
Place of birth for the foreign-born population - Dominican Republic (%)
Place of birth for the foreign-born population - Grenada (%)
Place of birth for the foreign-born population - Haiti (%)
Place of birth for the foreign-born population - Jamaica (%)
Place of birth for the foreign-born population - St. Vincent and the Grenadines (%)
Place of birth for the foreign-born population - Trinidad and Tobago (%)
Place of birth for the foreign-born population - West Indies (%)
Place of birth for the foreign-born population - Other Caribbean (%)
Place of birth for the foreign-born population - Belize (%)
Place of birth for the foreign-born population - Costa Rica (%)
Place of birth for the foreign-born population - El Salvador (%)
Place of birth for the foreign-born population - Guatemala (%)
Place of birth for the foreign-born population - Honduras (%)
Place of birth for the foreign-born population - Mexico (%)
Place of birth for the foreign-born population - Nicaragua (%)
Place of birth for the foreign-born population - Panama (%)
Place of birth for the foreign-born population - Other Central America (%)
Place of birth for the foreign-born population - Argentina (%)
Place of birth for the foreign-born population - Bolivia (%)
Place of birth for the foreign-born population - Brazil (%)
Place of birth for the foreign-born population - Chile (%)
Place of birth for the foreign-born population - Colombia (%)
Place of birth for the foreign-born population - Ecuador (%)
Place of birth for the foreign-born population - Guyana (%)
Place of birth for the foreign-born population - Peru (%)
Place of birth for the foreign-born population - Uruguay (%)
Place of birth for the foreign-born population - Venezuela (%)
Place of birth for the foreign-born population - Other South America (%)
Place of birth for the foreign-born population - Canada (%)
Place of birth for the foreign-born population - Other Northern America (%)
Place of birth for the foreign-born population - Other (%)
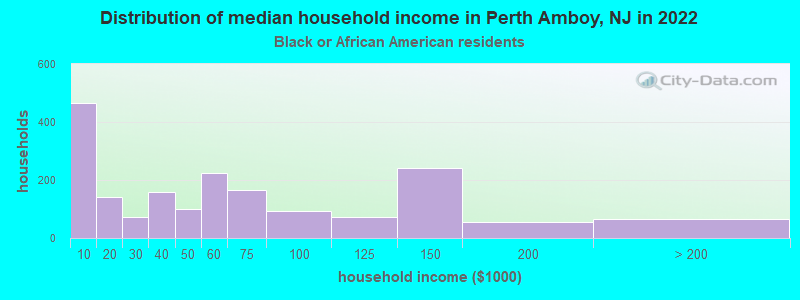
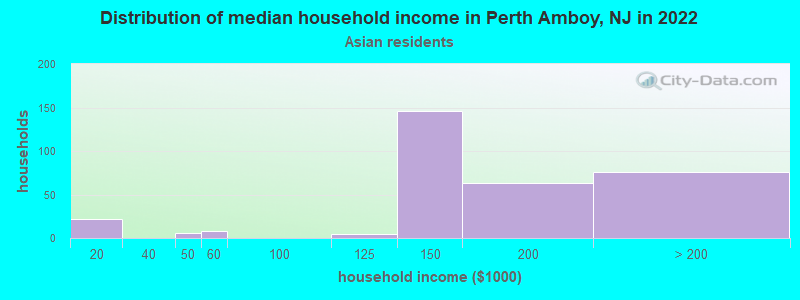
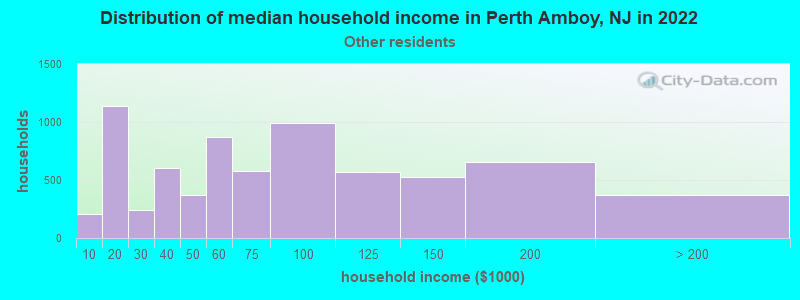
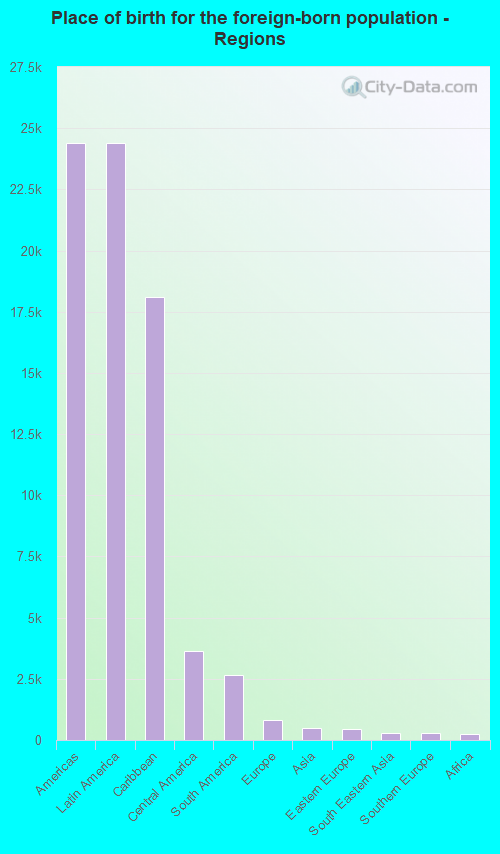
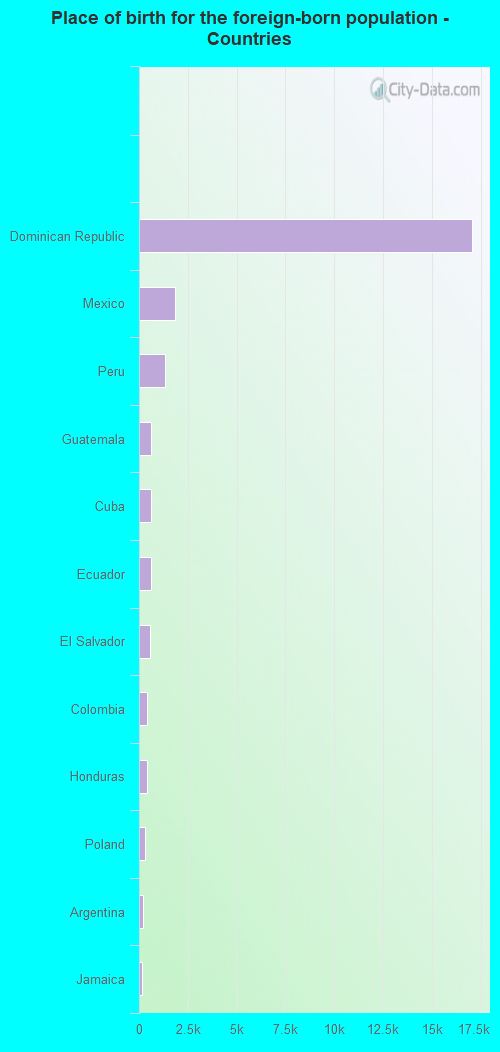
According to 2022 data, the most numerous races in Perth Amboy, NJ are White alone (7,366 residents), Hispanic (45,368 residents), and Black alone (3,100 residents). 19.4% of Perth Amboy residents speak English at home. 47.1% of Perth Amboy, NJ residents are foreign-born (43.4% born in Latin America), which is 51.1% greater than the foreign-born rate of 23.0% across the entire state of New Jersey.
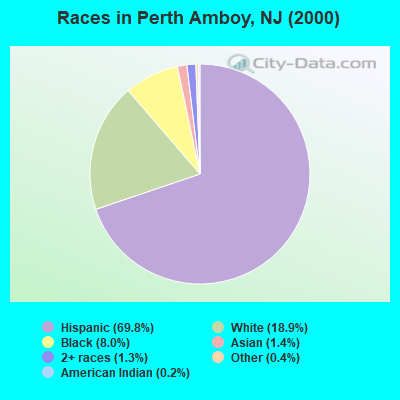
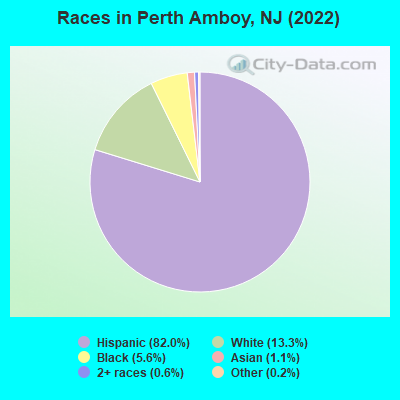
Race distribution in Perth Amboy
2000 2022
5,557,209 66.0% White alone 1,117,191 13.3% Hispanic 1,096,171 13.0% Black alone 477,012 5.7% Asian alone 133,689 1.6% Two or more races 19,565 0.2% Other race alone 11,338 0.1% American Indian alone 2,175 0.03% Native Hawaiian and Other
4,766,476 51.5% White alone 2,028,470 21.9% Hispanic 1,111,632 12.0% Black alone 923,546 10.0% Asian alone 332,237 3.6% Two or more races 89,847 1.0% Other race alone 8,557 0.09% American Indian alone 934 0.01% Native Hawaiian and Other
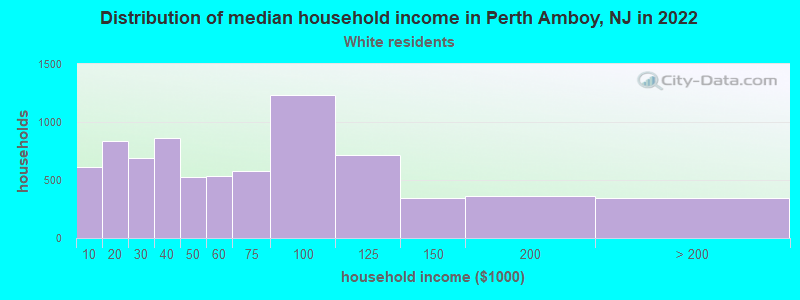
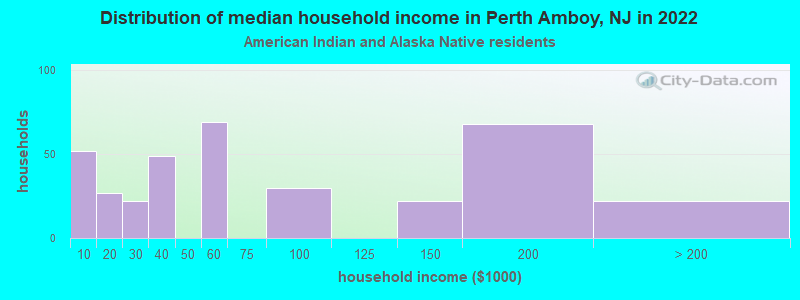
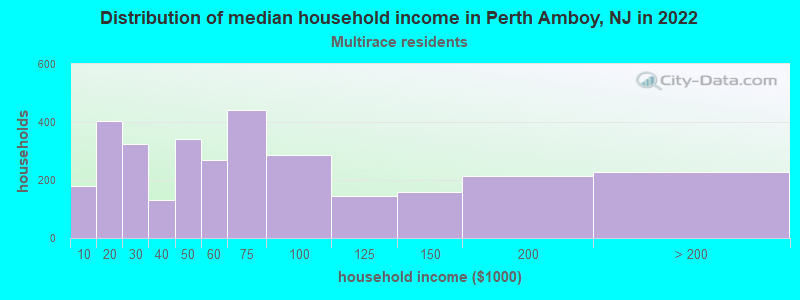
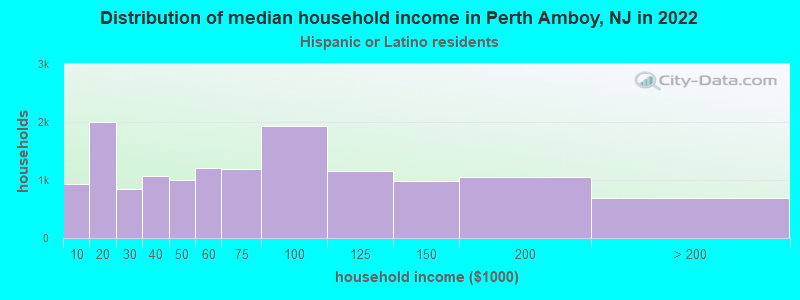
Income and house value in Perth Amboy Median household income in 2022 $63,502 White non-Hispanic householders$47,125 Black householders$144,088 Asian householders$65,582 Some other race householders$41,967 Two or more races householders$54,059 Hispanic or Latino race householdersMedian 2022 house value $337,071 White Non-Hispanic householders$362,775 Black or African American householders$198,744 American Indian or Alaska Native householders $356,150 Asian householders$331,506 Some other race householders$335,481 Two or more races householders$326,471 Hispanic or Latino householders
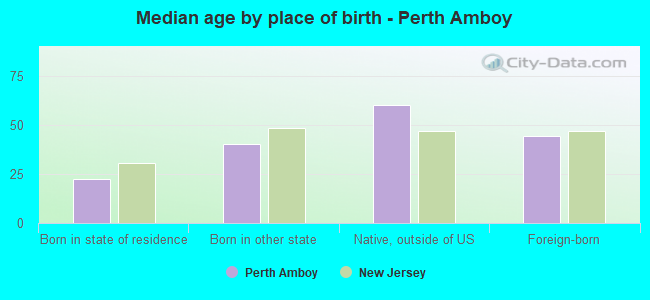
Median age by race in Perth Amboy
38.1 Median age for White residents37.0 38.9 38.0 Median age for Black or African American residents41.2 34.2 28.3 Median age for American Indian / Alaska Native residents33.8 26.2 43.7 Median age for Asian residents43.6 47.6 -939,393,938.5 Median age for Native Hawaiian / Pacific Islander residents-860,335,194.7 -713,070,378.3 37.3 Median age for Other race residents35.4 38.5 38.4 Median age for Two or more races residents34.9 40.3 36.5 Median age for White alone residents32.3 40.7 35.5 Median age for Hispanic or Latino residents35.5 35.9
Owner/renter occupied households by race in Perth Amboy
House owners and renters - White residents 2,928 40.8% Owner occupied4,249 59.2% Renter occupiedHouse owners and renters - Black or African American residents 437 23.5% Owner occupied1,423 76.5% Renter occupiedHouse owners and renters - American Indian / Alaska Native residents 532 100.0% Renter occupiedHouse owners and renters - Asian residents 143 45.1% Owner occupied175 54.9% Renter occupiedHouse owners and renters - Other race residents 2,840 40.3% Owner occupied4,204 59.7% Renter occupiedHouse owners and renters - Two or more races residents 1,387 43.4% Owner occupied1,810 56.6% Renter occupiedHouse owners and renters - White alone residents 1,408 59.8% Owner occupied948 40.2% Renter occupiedHouse owners and renters - Hispanic or Latino residents 5,432 38.4% Owner occupied8,702 61.6% Renter occupied
Language usage in Perth Amboy
English speakers - Total 19.4% of residents of Perth Amboy speak English at home.
77.6% of residents speak Spanish at home 17,869 44.7% Speak English very well22,143 55.3% Speak English less than very well3.7% of residents speak other language at home 1,319 68.3% Speak English very well612 31.7% Speak English less than very well
English speakers - Born in the United States 56.8% of residents of Perth Amboy speak English at home.
36.7% of residents speak Spanish at home 1,067 86.7% Speak English very well163 13.3% Speak English less than very well2.7% of residents speak other language at home 83 91.2% Speak English very well8 8.8% Speak English less than very well
English speakers - Native, born elsewhere 7.9% of residents of Perth Amboy speak English at home.
88.5% of residents speak Spanish at home 1,880 55.9% Speak English very well1,484 44.1% Speak English less than very well1.4% of residents speak other language at home 38 70.4% Speak English very well16 29.6% Speak English less than very well
English speakers - Foreign-born 4.0% of residents of Perth Amboy speak English at home.
97.9% of residents speak Spanish at home 6,695 25.6% Speak English very well19,446 74.4% Speak English less than very well5.1% of residents speak other language at home 805 59.0% Speak English very well560 41.0% Speak English less than very well
White (Caucasian) - Speak only English Native:
37.0% (4,541)Foreign-born:
2.5% (165)
White (Caucasian) - Speak another language Native:
39.1% (4,797)Foreign-born:
91.3% (6,150)
Black or African American - Speak only English Native:
84.1% (2,427)Foreign-born:
24.0% (357)
Black or African American - Speak another language Native:
14.9% (430)Foreign-born:
83.0% (1,236)
American Indian / Alaska Native - Speak only English Native:
16.4% (65)Foreign-born:
3.6% (55)
American Indian / Alaska Native - Speak another language Native:
93.2% (370)Foreign-born:
93.6% (1,415)
Asian - Speak only English Native:
45.4% (125)Foreign-born:
13.6% (76)
Asian - Speak another language Native:
54.5% (150)Foreign-born:
86.9% (485)
Other race - Speak only English Native:
23.0% (1,640)Foreign-born:
3.4% (530)
Other race - Speak another language Native:
74.9% (5,352)Foreign-born:
95.2% (15,002)
Two or more races - Speak only English Native:
18.3% (685)Foreign-born:
3.1% (133)
Two or more races - Speak another language Native:
83.4% (3,115)Foreign-born:
97.4% (4,179)
White alone - Speak only English Native:
60.2% (3,357)Foreign-born:
13.4% (138)
White alone - Speak another language Native:
30.5% (1,700)Foreign-born:
85.7% (882)
Hispanic or Latino - Speak only English Native:
18.5% (3,076)Foreign-born:
2.8% (744)
Hispanic or Latino - Speak another language Native:
79.2% (13,177)Foreign-born:
95.6% (25,671)
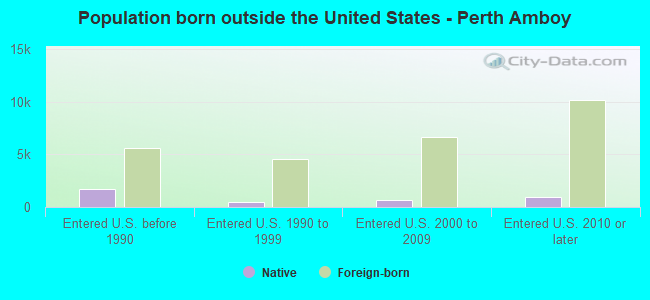
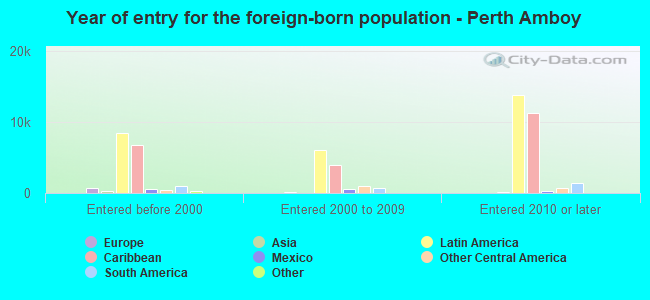
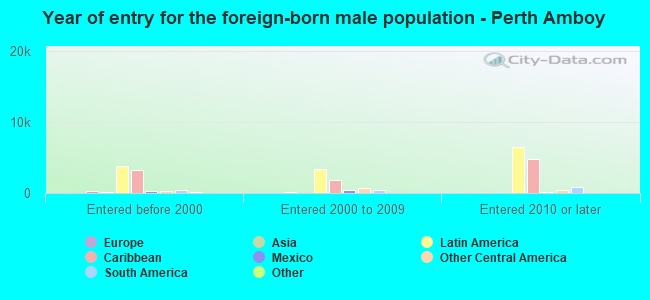
Foreign-born residents in Perth Amboy 26,027 residents are foreign born (43.4% Latin America ).
This city:
47.1%New Jersey:
23.2%
Marital status for residents in Perth Amboy Marital status - White (Caucasian) population 15 years and over
Males 46.4% Never married39.0% Now married3.0% Separated1.9% Widowed9.7% DivorcedFemales 41.3% Never married33.1% Now married5.7% Separated7.0% Widowed12.9% DivorcedWomen who gave birth in the past 12 months Now married:
36.6% (77)Unmarried:
63.4% (133)
Women who did not give birth in the past 12 months Now married:
29.6% (1,528)Unmarried:
70.4% (3,636)
Marital status - Black or African American population 15 years and over
Males 43.6% Never married43.4% Now married2.0% Separated0.4% Widowed10.7% DivorcedFemales 50.8% Never married18.6% Now married13.9% Separated9.6% Widowed7.2% DivorcedWomen who gave birth in the past 12 months Now married:
0.0% (0)Unmarried:
100.0% (51)
Women who did not give birth in the past 12 months Now married:
23.1% (276)Unmarried:
76.9% (915)
Marital status - American Indian / Alaska Native population 15 years and over
Males 34.0% Never married55.7% Now married0.0% Separated10.3% Widowed0.0% DivorcedFemales 44.4% Never married41.3% Now married9.4% Separated0.0% Widowed5.0% DivorcedWomen who did not give birth in the past 12 months Now married:
45.2% (205)Unmarried:
54.8% (249)
Marital status - Asian population 15 years and over
Males 38.2% Never married47.1% Now married0.0% Separated1.6% Widowed13.1% DivorcedFemales 25.1% Never married67.6% Now married0.0% Separated3.8% Widowed3.5% DivorcedWomen who gave birth in the past 12 months Now married:
100.0% (6)Unmarried:
0.0% (0)
Women who did not give birth in the past 12 months Now married:
54.4% (83)Unmarried:
45.6% (69)
Marital status - Other race population 15 years and over
Males 50.4% Never married31.7% Now married5.2% Separated1.6% Widowed11.1% DivorcedFemales 35.6% Never married35.1% Now married6.5% Separated6.7% Widowed16.1% DivorcedWomen who gave birth in the past 12 months Now married:
55.6% (222)Unmarried:
44.4% (177)
Women who did not give birth in the past 12 months Now married:
41.2% (2,024)Unmarried:
58.8% (2,884)
Marital status - Two or more races population 15 years and over
Males 46.0% Never married37.4% Now married4.7% Separated0.9% Widowed11.0% DivorcedFemales 39.4% Never married35.4% Now married2.7% Separated10.7% Widowed11.8% DivorcedWomen who gave birth in the past 12 months Now married:
100.0% (20)Unmarried:
0.0% (0)
Women who did not give birth in the past 12 months Now married:
38.3% (879)Unmarried:
61.7% (1,415)
Marital status - White alone, not Hispanic / Latino population 15 years and over
Males 51.9% Never married34.5% Now married4.7% Separated1.2% Widowed7.7% DivorcedFemales 42.2% Never married30.7% Now married0.0% Separated12.8% Widowed14.3% DivorcedWomen who gave birth in the past 12 months Now married:
50.0% (25)Unmarried:
50.0% (25)
Women who did not give birth in the past 12 months Now married:
18.1% (253)Unmarried:
81.9% (1,144)
Marital status - Hispanic or Latino population 15 years and over
Males 47.0% Never married36.9% Now married3.7% Separated1.8% Widowed10.6% DivorcedFemales 39.6% Never married34.2% Now married6.8% Separated6.1% Widowed13.2% DivorcedWomen who gave birth in the past 12 months Now married:
45.4% (252)Unmarried:
54.6% (304)
Women who did not give birth in the past 12 months Now married:
36.3% (4,068)Unmarried:
63.7% (7,152)
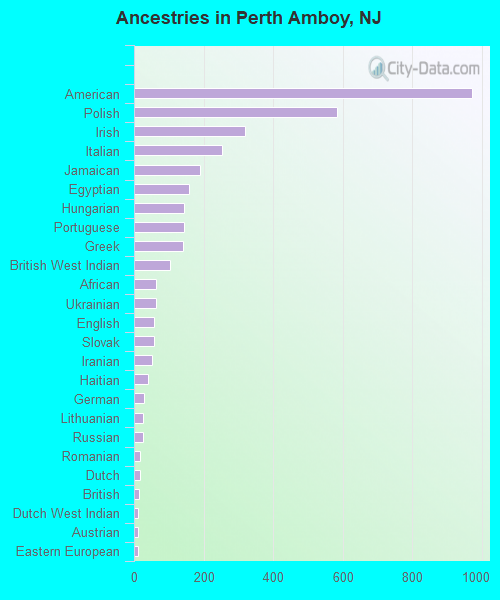
Ancestries in Perth Amboy
972 2.6% American583 1.5% Polish320 0.8% Irish254 0.7% Italian190 0.5% Jamaican158 0.4% Egyptian143 0.4% Hungarian143 0.4% Portuguese140 0.4% Greek104 0.3% British West Indian64 0.2% African62 0.2% Ukrainian57 0.2% English57 0.2% Slovak53 0.1% Iranian39 0.1% Haitian28 0.07% German26 0.07% Lithuanian26 0.07% Russian18 0.05% Romanian16 0.04% Dutch15 0.04% British12 0.03% Dutch West Indian11 0.03% Austrian11 0.03% Eastern European10 0.03% Carpatho Rusyn9 0.02% French9 0.02% West Indian8 0.02% Czech8 0.02% Swedish
Geographical mobility in Perth Amboy Same house 1 year ago 19,799 93.9% White (Caucasian)4,149 90.2% Black or African American1,382 86.0% American Indian / Alaska Native829 100.0% Asian23 100.0% Native Hawaiian / Pacific Islander22,032 94.2% Other race8,032 93.9% Two or more races6,589 91.7% White alone, not Hispanic / Latino42,150 93.9% Hispanic or LatinoMoved within same county 1,065 5.0% White / Caucasian294 6.4% Black or African American255 15.9% American Indian / Alaska Native22 2.6% Asian657 2.8% Other race476 5.6% Two or more races400 5.6% White alone, not Hispanic / Latino1,856 4.1% Hispanic or LatinoMoved within same state 111 0.5% White / Caucasian10 0.2% Black or African American124 0.5% Other race33 0.4% Two or more races106 1.5% White alone, not Hispanic / Latino139 0.3% Hispanic or LatinoMoved from different state 57 0.3% White / Caucasian216 0.9% Other race25 0.3% White alone, not Hispanic / Latino186 0.4% Hispanic or LatinoMoved from abroad 42 0.2% White191 4.1% Black or African American435 1.9% Other race94 1.1% Two or more races35 0.5% White alone, not Hispanic / Latino745 1.7% Hispanic or Latino
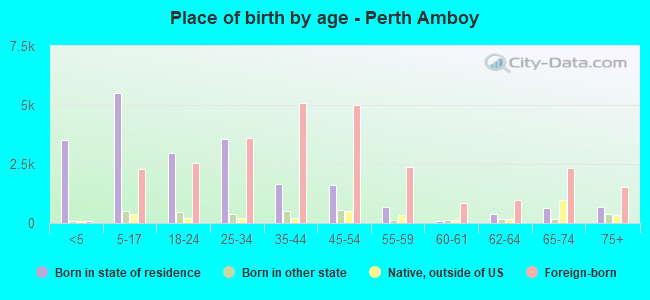
Children Nativity (place of birth) in Perth Amboy
Children under 6 years - Living with two parents Both parents native 105 100.0% NativeBoth parents foreign-born 815 91.9% Native72 8.1% Foreign-bornOne native, one foreign-born parent 323 100.0% NativeChildren under 6 years - Living with one parent Native parent 1,156 100.0% NativeForeign-born parent 1,476 96.6% Native51 3.4% Foreign-bornChildren 6 to 17 years - Living with two parents Both parents native 325 100.0% NativeBoth parents foreign-born 1,541 65.5% Native814 34.5% Foreign-bornOne native, one foreign-born parent 390 68.8% Native177 31.2% Foreign-bornChildren 6 to 17 years - Living with one parent Native parent 75 100.0% NativeForeign-born parent 3,143 63.7% Native1,789 36.3% Foreign-born
Grandparents responsible for own grandchildren in Perth Amboy
Grandparents (30 to 59 years) White / Caucasian 4 1.6% Responsible for grandchildren271 98.4% Not responsible for grandchildrenBlack or African American 126 100.0% Not responsible for grandchildrenOther race 71 11.8% Responsible for grandchildren534 88.2% Not responsible for grandchildrenTwo or more races 167 100.0% Not responsible for grandchildrenWhite alone, not Hispanic / Latino 22 100.0% Not responsible for grandchildrenHispanic or Latino 74 6.2% Responsible for grandchildren1,126 93.8% Not responsible for grandchildrenGrandparents (60 years and over) White / Caucasian 14 5.4% Responsible for grandchildren249 94.6% Not responsible for grandchildrenBlack or African American 64 93.0% Responsible for grandchildren5 7.0% Not responsible for grandchildrenOther race 70 14.3% Responsible for grandchildren418 85.7% Not responsible for grandchildrenTwo or more races 363 100.0% Not responsible for grandchildrenWhite alone, not Hispanic / Latino 71 100.0% Not responsible for grandchildrenHispanic or Latino 49 5.0% Responsible for grandchildren928 95.0% Not responsible for grandchildren