Races in Pine Ridge, South Carolina (SC) Detailed Stats
Data:
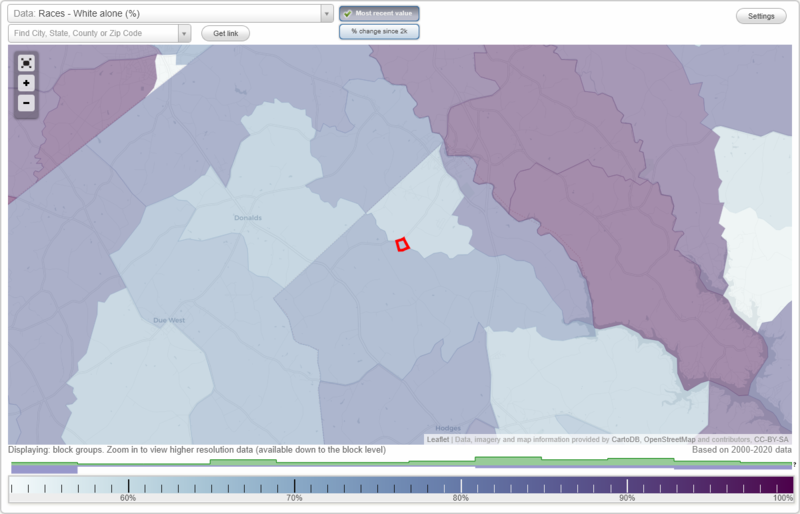
Races - White alone (%)
Races - White alone (% change since 2000)
Races - Black alone (%)
Races - Black alone (% change since 2000)
Races - American Indian alone (%)
Races - American Indian alone (% change since 2000)
Races - Asian alone (%)
Races - Asian alone (% change since 2000)
Races - Hispanic (%)
Races - Hispanic (% change since 2000)
Races - Native Hawaiian and Other Pacific Islander alone (%)
Races - Native Hawaiian and Other Pacific Islander alone (% change since 2000)
Races - Two or more races(%)
Races - Two or more races(% change since 2000)
Races - Other race alone (%)
Races - Other race alone (% change since 2000)
Racial diversity
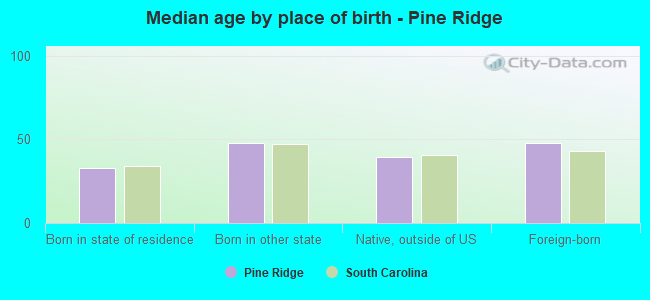
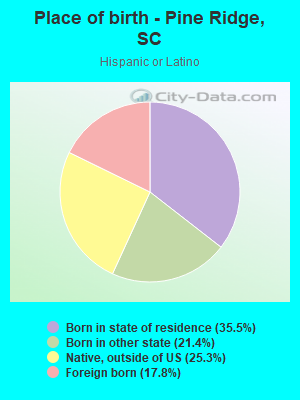
Place of birth - Born in state of residence (%)
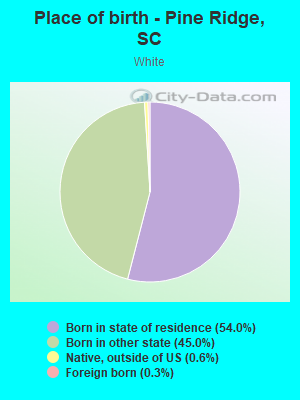
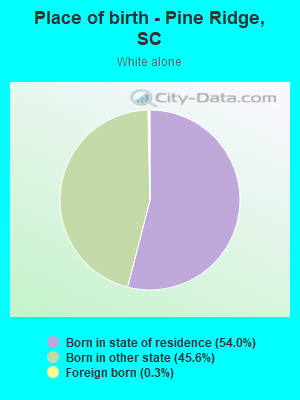
Place of birth - Born in state of residence (%) - White
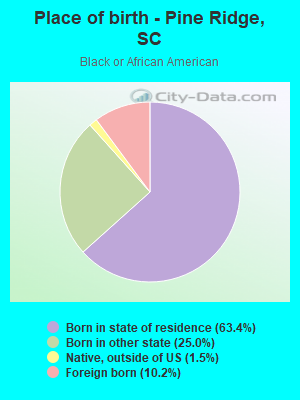
Place of birth - Born in state of residence (%) - Black or African American
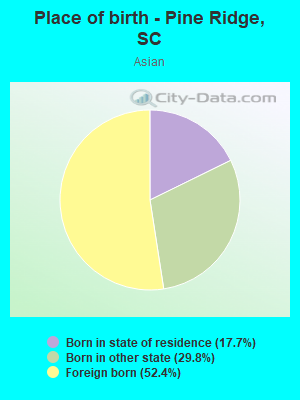
Place of birth - Born in state of residence (%) - Asian
Place of birth - Born in state of residence (%) - Hispanic or Latino
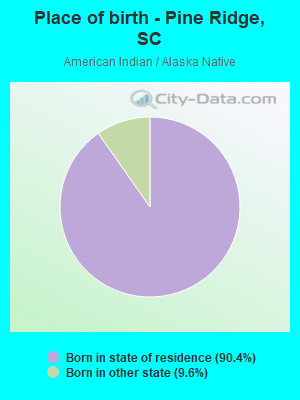
Place of birth - Born in state of residence (%) - American Indian and Alaska Native
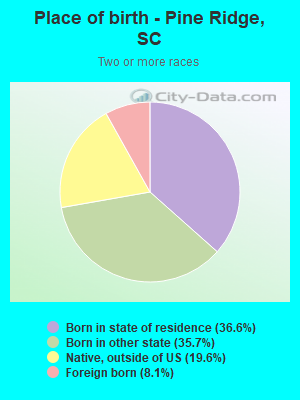
Place of birth - Born in state of residence (%) - Multirace
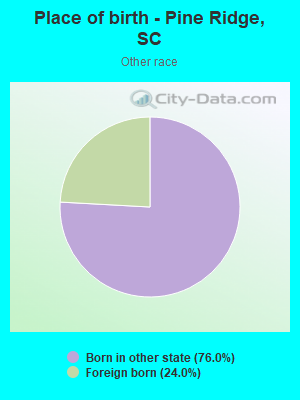
Place of birth - Born in state of residence (%) - Other Race
Place of birth - Born in other state (%)
Place of birth - Born in other state (%) - White
Place of birth - Born in other state (%) - Black or African American
Place of birth - Born in other state (%) - Asian
Place of birth - Born in other state (%) - Hispanic or Latino
Place of birth - Born in other state (%) - American Indian and Alaska Native
Place of birth - Born in other state (%) - Multirace
Place of birth - Born in other state (%) - Other Race
Place of birth - Native, outside of US (%)
Place of birth - Native, outside of US (%) - White
Place of birth - Native, outside of US (%) - Black or African American
Place of birth - Native, outside of US (%) - Asian
Place of birth - Native, outside of US (%) - Hispanic or Latino
Place of birth - Native, outside of US (%) - American Indian and Alaska Native
Place of birth - Native, outside of US (%) - Multirace
Place of birth - Native, outside of US (%) - Other Race
Place of birth - Foreign born (%)
Place of birth - Foreign born (%) - White
Place of birth - Foreign born (%) - Black or African American
Place of birth - Foreign born (%) - Asian
Place of birth - Foreign born (%) - Hispanic or Latino
Place of birth - Foreign born (%) - American Indian and Alaska Native
Place of birth - Foreign born (%) - Multirace
Place of birth - Foreign born (%) - Other Race
Residents speaking English at home (%)
Residents speaking English at home - Born in the United States (%)
Residents speaking English at home - Native, born elsewhere (%)
Residents speaking English at home - Foreign born (%)
Residents speaking Spanish at home (%)
Residents speaking Spanish at home - Born in the United States (%)
Residents speaking Spanish at home - Native, born elsewhere (%)
Residents speaking Spanish at home - Foreign born (%)
Residents speaking other language at home (%)
Residents speaking other language at home - Born in the United States (%)
Residents speaking other language at home - Native, born elsewhere (%)
Residents speaking other language at home - Foreign born (%)
Marital status - Never married (%)
Marital status - Now married (%)
Marital status - Separated (%)
Marital status - Widowed (%)
Marital status - Divorced (%)
Ancestries Reported - Arab (%)
Ancestries Reported - Czech (%)
Ancestries Reported - Danish (%)
Ancestries Reported - Dutch (%)
Ancestries Reported - English (%)
Ancestries Reported - French (%)
Ancestries Reported - French Canadian (%)
Ancestries Reported - German (%)
Ancestries Reported - Greek (%)
Ancestries Reported - Hungarian (%)
Ancestries Reported - Irish (%)
Ancestries Reported - Italian (%)
Ancestries Reported - Lithuanian (%)
Ancestries Reported - Norwegian (%)
Ancestries Reported - Polish (%)
Ancestries Reported - Portuguese (%)
Ancestries Reported - Russian (%)
Ancestries Reported - Scotch-Irish (%)
Ancestries Reported - Scottish (%)
Ancestries Reported - Slovak (%)
Ancestries Reported - Subsaharan African (%)
Ancestries Reported - Swedish (%)
Ancestries Reported - Swiss (%)
Ancestries Reported - Ukrainian (%)
Ancestries Reported - United States (%)
Ancestries Reported - Welsh (%)
Ancestries Reported - West Indian (%)
Ancestries Reported - Other (%)
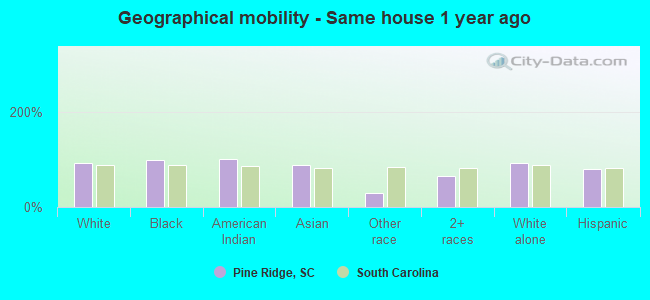
Geographical mobility - Same house 1 year ago (%)
Geographical mobility - Same house 1 year ago (%) - White
Geographical mobility - Same house 1 year ago (%) - Black or African American
Geographical mobility - Same house 1 year ago (%) - Asian
Geographical mobility - Same house 1 year ago (%) - Hispanic or Latino
Geographical mobility - Same house 1 year ago (%) - American Indian and Alaska Native
Geographical mobility - Same house 1 year ago (%) - Multirace
Geographical mobility - Same house 1 year ago (%) - Other Race
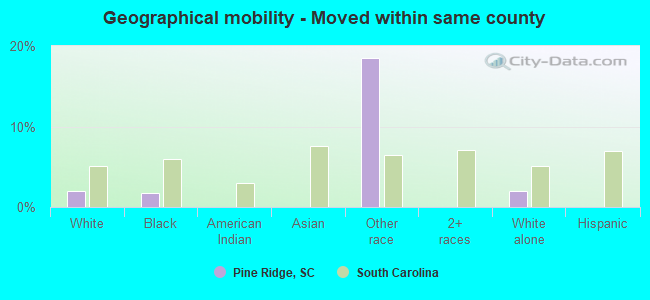
Geographical mobility - Moved within same county (%)
Geographical mobility - Moved within same county (%) - White
Geographical mobility - Moved within same county (%) - Black or African American
Geographical mobility - Moved within same county (%) - Asian
Geographical mobility - Moved within same county (%) - Hispanic or Latino
Geographical mobility - Moved within same county (%) - American Indian and Alaska Native
Geographical mobility - Moved within same county (%) - Multirace
Geographical mobility - Moved within same county (%) - Other Race
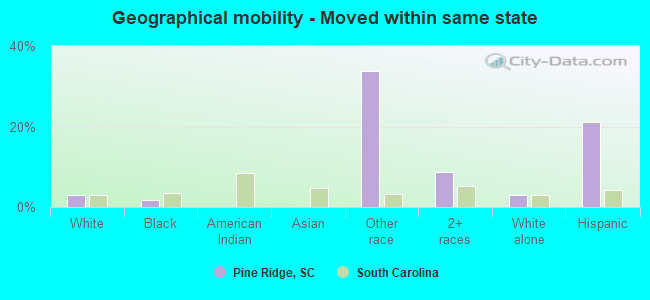
Geographical mobility - Moved from different county within same state (%)
Geographical mobility - Moved from different county within same state (%) - White
Geographical mobility - Moved from different county within same state (%) - Black or African American
Geographical mobility - Moved from different county within same state (%) - Asian
Geographical mobility - Moved from different county within same state (%) - Hispanic or Latino
Geographical mobility - Moved from different county within same state (%) - American Indian and Alaska Native
Geographical mobility - Moved from different county within same state (%) - Multirace
Geographical mobility - Moved from different county within same state (%) - Other Race
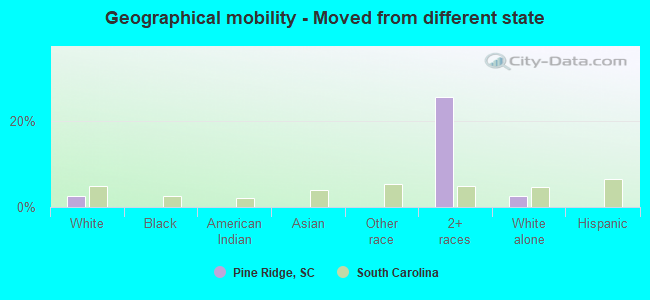
Geographical mobility - Moved from different state (%)
Geographical mobility - Moved from different state (%) - White
Geographical mobility - Moved from different state (%) - Black or African American
Geographical mobility - Moved from different state (%) - Asian
Geographical mobility - Moved from different state (%) - Hispanic or Latino
Geographical mobility - Moved from different state (%) - American Indian and Alaska Native
Geographical mobility - Moved from different state (%) - Multirace
Geographical mobility - Moved from different state (%) - Other Race
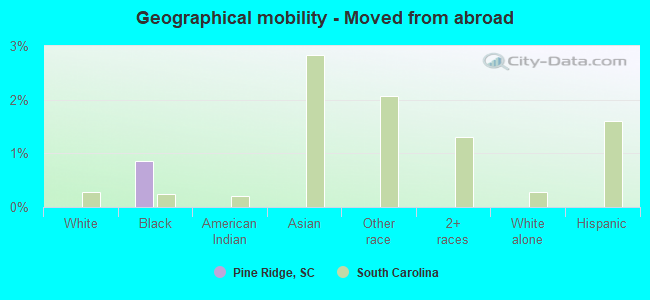
Geographical mobility - Moved from abroad (%)
Geographical mobility - Moved from abroad (%) - White
Geographical mobility - Moved from abroad (%) - Black or African American
Geographical mobility - Moved from abroad (%) - Asian
Geographical mobility - Moved from abroad (%) - Hispanic or Latino
Geographical mobility - Moved from abroad (%) - American Indian and Alaska Native
Geographical mobility - Moved from abroad (%) - Multirace
Geographical mobility - Moved from abroad (%) - Other Race
Place of birth for the foreign-born population - Ireland (%)
Place of birth for the foreign-born population - Denmark (%)
Place of birth for the foreign-born population - Norway (%)
Place of birth for the foreign-born population - Sweden (%)
Place of birth for the foreign-born population - United Kingdom (%)
Place of birth for the foreign-born population - England (%)
Place of birth for the foreign-born population - Scotland (%)
Place of birth for the foreign-born population - Other Northern Europe (%)
Place of birth for the foreign-born population - Austria (%)
Place of birth for the foreign-born population - Belgium (%)
Place of birth for the foreign-born population - France (%)
Place of birth for the foreign-born population - Germany (%)
Place of birth for the foreign-born population - Netherlands (%)
Place of birth for the foreign-born population - Switzerland (%)
Place of birth for the foreign-born population - Other Western Europe (%)
Place of birth for the foreign-born population - Greece (%)
Place of birth for the foreign-born population - Italy (%)
Place of birth for the foreign-born population - Portugal (%)
Place of birth for the foreign-born population - Spain (%)
Place of birth for the foreign-born population - Other Southern Europe (%)
Place of birth for the foreign-born population - Albania (%)
Place of birth for the foreign-born population - Belarus (%)
Place of birth for the foreign-born population - Bosnia and Herzegovina (%)
Place of birth for the foreign-born population - Bulgaria (%)
Place of birth for the foreign-born population - Croatia (%)
Place of birth for the foreign-born population - Czechoslovakia (%)
Place of birth for the foreign-born population - Hungary (%)
Place of birth for the foreign-born population - Latvia (%)
Place of birth for the foreign-born population - Lithuania (%)
Place of birth for the foreign-born population - North Macedonia (Macedonia) (%)
Place of birth for the foreign-born population - Moldova (%)
Place of birth for the foreign-born population - Poland (%)
Place of birth for the foreign-born population - Romania (%)
Place of birth for the foreign-born population - Russia (%)
Place of birth for the foreign-born population - Serbia (%)
Place of birth for the foreign-born population - Ukraine (%)
Place of birth for the foreign-born population - Other Eastern Europe (%)
Place of birth for the foreign-born population - China (%)
Place of birth for the foreign-born population - Hong Kong (%)
Place of birth for the foreign-born population - Taiwan (%)
Place of birth for the foreign-born population - Japan (%)
Place of birth for the foreign-born population - Korea (%)
Place of birth for the foreign-born population - Other Eastern Asia (%)
Place of birth for the foreign-born population - Afghanistan (%)
Place of birth for the foreign-born population - Bangladesh (%)
Place of birth for the foreign-born population - India (%)
Place of birth for the foreign-born population - Iran (%)
Place of birth for the foreign-born population - Kazakhstan (%)
Place of birth for the foreign-born population - Nepal (%)
Place of birth for the foreign-born population - Pakistan (%)
Place of birth for the foreign-born population - Sri Lanka (%)
Place of birth for the foreign-born population - Uzbekistan (%)
Place of birth for the foreign-born population - Other South Central Asia (%)
Place of birth for the foreign-born population - Burma (%)
Place of birth for the foreign-born population - Cambodia (%)
Place of birth for the foreign-born population - Indonesia (%)
Place of birth for the foreign-born population - Laos (%)
Place of birth for the foreign-born population - Malaysia (%)
Place of birth for the foreign-born population - Philippines (%)
Place of birth for the foreign-born population - Singapore (%)
Place of birth for the foreign-born population - Thailand (%)
Place of birth for the foreign-born population - Vietnam (%)
Place of birth for the foreign-born population - Other South Eastern Asia (%)
Place of birth for the foreign-born population - Armenia (%)
Place of birth for the foreign-born population - Iraq (%)
Place of birth for the foreign-born population - Israel (%)
Place of birth for the foreign-born population - Jordan (%)
Place of birth for the foreign-born population - Kuwait (%)
Place of birth for the foreign-born population - Lebanon (%)
Place of birth for the foreign-born population - Saudi Arabia (%)
Place of birth for the foreign-born population - Syria (%)
Place of birth for the foreign-born population - Turkey (%)
Place of birth for the foreign-born population - Yemen (%)
Place of birth for the foreign-born population - Other Western Asia (%)
Place of birth for the foreign-born population - Eritrea (%)
Place of birth for the foreign-born population - Ethiopia (%)
Place of birth for the foreign-born population - Kenya (%)
Place of birth for the foreign-born population - Somalia (%)
Place of birth for the foreign-born population - Uganda (%)
Place of birth for the foreign-born population - Zimbabwe (%)
Place of birth for the foreign-born population - Other Eastern Africa (%)
Place of birth for the foreign-born population - Cameroon (%)
Place of birth for the foreign-born population - Congo (%)
Place of birth for the foreign-born population - Democratic Republic of Congo (Zaire) (%)
Place of birth for the foreign-born population - Other Middle Africa (%)
Place of birth for the foreign-born population - Egypt (%)
Place of birth for the foreign-born population - Morocco (%)
Place of birth for the foreign-born population - Sudan (%)
Place of birth for the foreign-born population - Other Northern Africa (%)
Place of birth for the foreign-born population - South Africa (%)
Place of birth for the foreign-born population - Other Southern Africa (%)
Place of birth for the foreign-born population - Cabo Verde (%)
Place of birth for the foreign-born population - Ghana (%)
Place of birth for the foreign-born population - Liberia (%)
Place of birth for the foreign-born population - Nigeria (%)
Place of birth for the foreign-born population - Senegal (%)
Place of birth for the foreign-born population - Sierra Leone (%)
Place of birth for the foreign-born population - Other Western Africa (%)
Place of birth for the foreign-born population - Australia (%)
Place of birth for the foreign-born population - New Zealand (%)
Place of birth for the foreign-born population - Fiji (%)
Place of birth for the foreign-born population - Micronesia (%)
Place of birth for the foreign-born population - Bahamas (%)
Place of birth for the foreign-born population - Barbados (%)
Place of birth for the foreign-born population - Cuba (%)
Place of birth for the foreign-born population - Dominica (%)
Place of birth for the foreign-born population - Dominican Republic (%)
Place of birth for the foreign-born population - Grenada (%)
Place of birth for the foreign-born population - Haiti (%)
Place of birth for the foreign-born population - Jamaica (%)
Place of birth for the foreign-born population - St. Vincent and the Grenadines (%)
Place of birth for the foreign-born population - Trinidad and Tobago (%)
Place of birth for the foreign-born population - West Indies (%)
Place of birth for the foreign-born population - Other Caribbean (%)
Place of birth for the foreign-born population - Belize (%)
Place of birth for the foreign-born population - Costa Rica (%)
Place of birth for the foreign-born population - El Salvador (%)
Place of birth for the foreign-born population - Guatemala (%)
Place of birth for the foreign-born population - Honduras (%)
Place of birth for the foreign-born population - Mexico (%)
Place of birth for the foreign-born population - Nicaragua (%)
Place of birth for the foreign-born population - Panama (%)
Place of birth for the foreign-born population - Other Central America (%)
Place of birth for the foreign-born population - Argentina (%)
Place of birth for the foreign-born population - Bolivia (%)
Place of birth for the foreign-born population - Brazil (%)
Place of birth for the foreign-born population - Chile (%)
Place of birth for the foreign-born population - Colombia (%)
Place of birth for the foreign-born population - Ecuador (%)
Place of birth for the foreign-born population - Guyana (%)
Place of birth for the foreign-born population - Peru (%)
Place of birth for the foreign-born population - Uruguay (%)
Place of birth for the foreign-born population - Venezuela (%)
Place of birth for the foreign-born population - Other South America (%)
Place of birth for the foreign-born population - Canada (%)
Place of birth for the foreign-born population - Other Northern America (%)
Place of birth for the foreign-born population - Other (%)
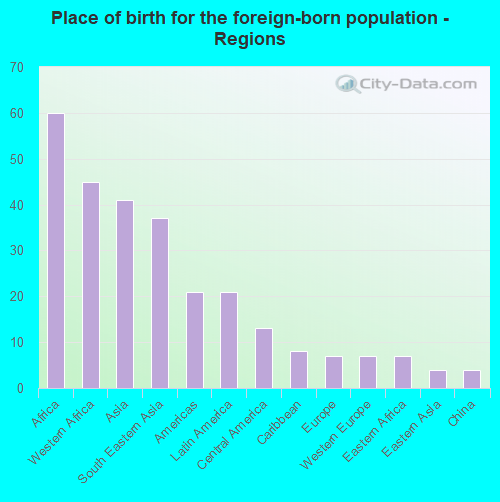
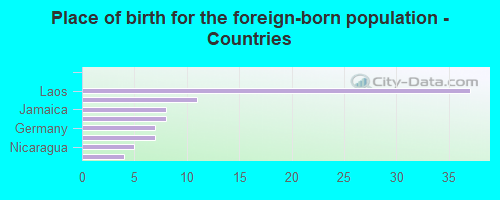
According to 2022 data, the most numerous races in Pine Ridge, SC are White alone (1,624 residents), Black alone (835 residents), and Hispanic (83 residents). 92.2% of Pine Ridge residents speak English at home. 4.7% of Pine Ridge, SC residents are foreign-born (2.2% born in Africa, 1.5% born in Asia, 0.8% born in Latin America), which is 6.4% less than the foreign-born rate of 5.0% across the entire state of South Carolina.
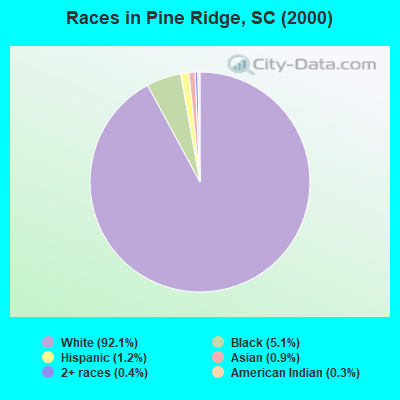
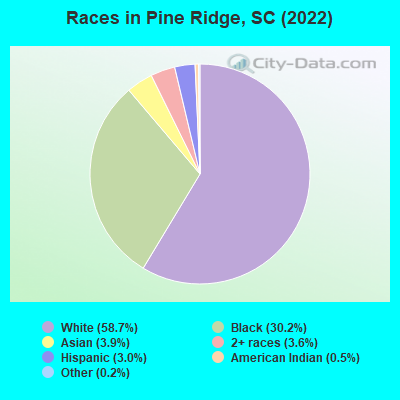
Race distribution in Pine Ridge
2000 2022
2,652,291 66.1% White alone 1,178,486 29.4% Black alone 95,076 2.4% Hispanic 35,568 0.9% Asian alone 33,290 0.8% Two or more races 12,765 0.3% American Indian alone 3,266 0.08% Other race alone 1,270 0.03% Native Hawaiian and Other
3,301,739 62.5% White alone 1,313,290 24.9% Black alone 343,783 6.5% Hispanic 190,508 3.6% Two or more races 89,888 1.7% Asian alone 29,390 0.6% Other race alone 12,112 0.2% American Indian alone 1,924 0.04% Native Hawaiian and Other
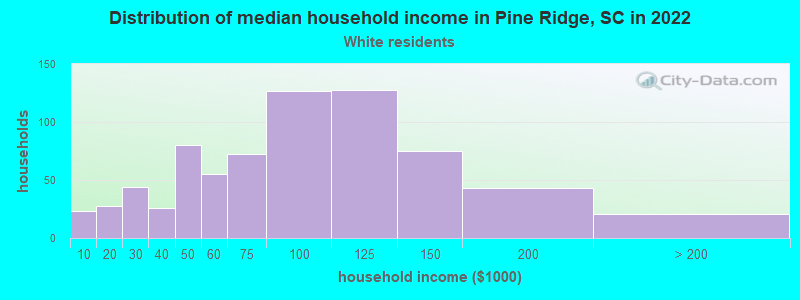
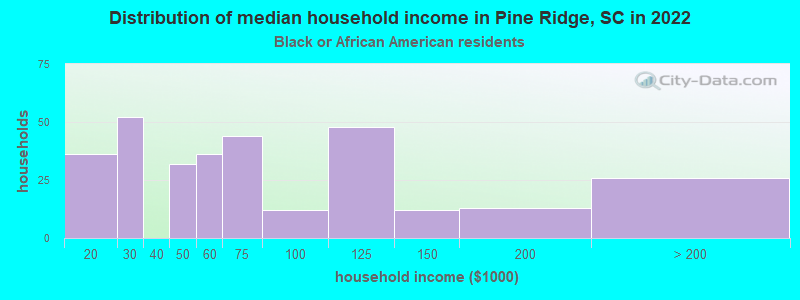
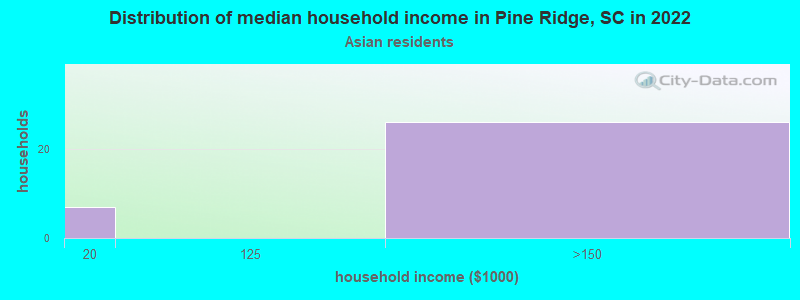
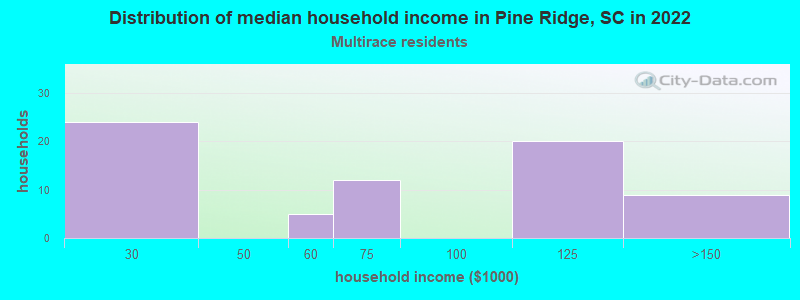
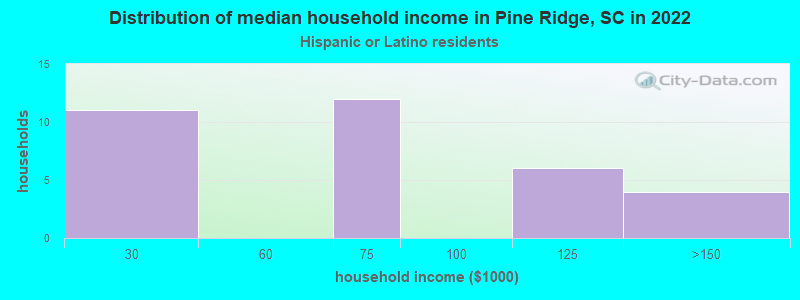
Income and house value in Pine Ridge Median household income in 2022 $80,808 White non-Hispanic householders$71,101 Black householders$135,384 Asian householders$64,464 Two or more races householdersMedian 2022 house value $238,122 White Non-Hispanic householders$357,053 Black or African American householders$142,821 American Indian or Alaska Native householders$486,891 Hispanic or Latino householders
Median age by race in Pine Ridge
47.9 Median age for White residents45.2 48.8 28.1 Median age for Black or African American residents26.2 30.3 59.5 Median age for American Indian / Alaska Native residents21.9 -1,034,343,433.3 45.6 Median age for Asian residents57.6 38.0 -698,412,697.7 Median age for Native Hawaiian / Pacific Islander residents-551,574,375.1 -666,666,666.0 53.9 Median age for Other race residents-647,342,994.5 66.2 32.2 Median age for Two or more races residents20.4 41.4 48.1 Median age for White alone residents45.6 48.7 30.3 Median age for Hispanic or Latino residents29.7 30.1
Owner/renter occupied households by race in Pine Ridge
House owners and renters - White residents 693 94.1% Owner occupied44 5.9% Renter occupiedHouse owners and renters - Black or African American residents 142 50.0% Owner occupied142 50.0% Renter occupiedHouse owners and renters - American Indian / Alaska Native residents 11 100.0% Owner occupiedHouse owners and renters - Asian residents 32 100.0% Owner occupiedHouse owners and renters - Other race residents 3 100.0% Owner occupiedHouse owners and renters - Two or more races residents 51 100.0% Owner occupiedHouse owners and renters - White alone residents 694 94.1% Owner occupied44 5.9% Renter occupiedHouse owners and renters - Hispanic or Latino residents 31 100.0% Owner occupied
Language usage in Pine Ridge
English speakers - Total 92.2% of residents of Pine Ridge speak English at home.
1.8% of residents speak Spanish at home 23 50.0% Speak English very well23 50.0% Speak English less than very well5.3% of residents speak other language at home 118 84.3% Speak English very well22 15.7% Speak English less than very well
English speakers - Born in the United States 98.0% of residents of Pine Ridge speak English at home.
1.4% of residents speak Spanish at home 14 100.0% Speak English very well
English speakers - Native, born elsewhere 56.9% of residents of Pine Ridge speak English at home.
56.9% of residents speak Spanish at home 29 100.0% Speak English less than very well
English speakers - Foreign-born 14.9% of residents of Pine Ridge speak English at home.
13.4% of residents speak Spanish at home 13 72.2% Speak English very well5 27.8% Speak English less than very well66.4% of residents speak other language at home 69 77.5% Speak English very well20 22.5% Speak English less than very well
White (Caucasian) - Speak only English Native:
99.1% (1,538)Foreign-born:
87.8% (5)
Black or African American - Speak only English Native:
95.7% (716)Foreign-born:
27.6% (24)
Black or African American - Speak another language Native:
3.9% (29)Foreign-born:
73.1% (65)
Asian - Speak only English Native:
34.9% (21)Foreign-born:
4.6% (2)
Asian - Speak another language Native:
69.1% (41)Foreign-born:
100.0% (51)
Other race - Speak another language Native:
55.2% (6)Foreign-born:
100.0% (5)
Two or more races - Speak another language Native:
3.7% (4)Foreign-born:
100.0% (13)
White alone - Speak only English Native:
99.8% (1,533)Foreign-born:
100.0% (5)
Hispanic or Latino - Speak another language Native:
60.1% (29)Foreign-born:
100.0% (15)
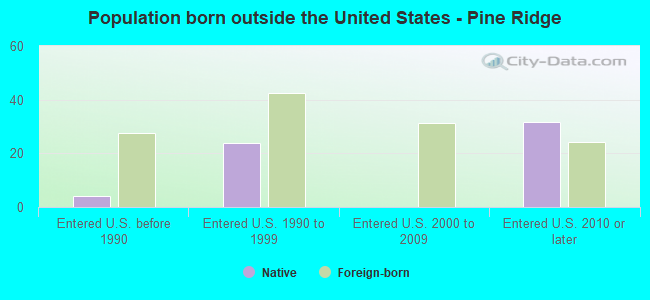
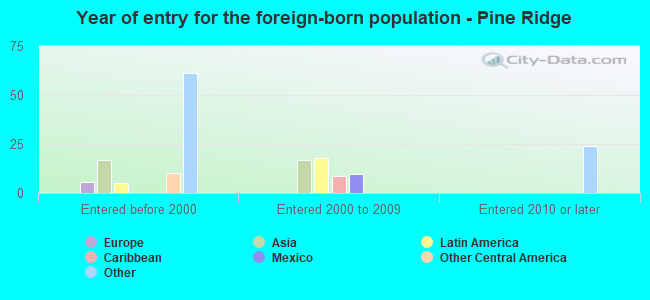
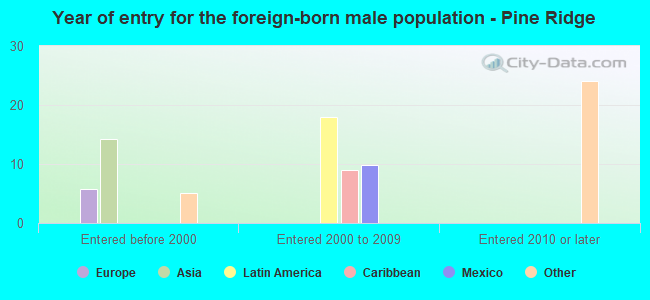
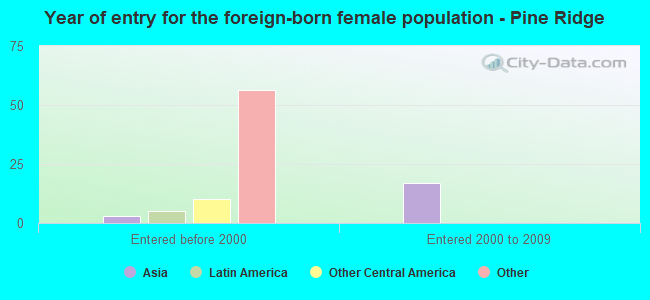
Foreign-born residents in Pine Ridge 130 residents are foreign born (2.2% Africa , 1.5% Asia , 0.8% Latin America ).
This city:
4.7%South Carolina:
5.3%
Marital status for residents in Pine Ridge Marital status - White (Caucasian) population 15 years and over
Males 21.8% Never married68.7% Now married1.1% Separated3.0% Widowed5.5% DivorcedFemales 19.5% Never married56.2% Now married4.7% Separated13.2% Widowed6.4% DivorcedWomen who gave birth in the past 12 months Now married:
100.0% (26)Unmarried:
0.0% (0)
Women who did not give birth in the past 12 months Now married:
46.7% (147)Unmarried:
53.3% (168)
Marital status - Black or African American population 15 years and over
Males 42.4% Never married44.1% Now married2.0% Separated11.5% Widowed0.0% DivorcedFemales 33.1% Never married41.8% Now married1.6% Separated14.7% Widowed8.8% DivorcedWomen who gave birth in the past 12 months Now married:
100.0% (21)Unmarried:
0.0% (0)
Women who did not give birth in the past 12 months Now married:
31.2% (53)Unmarried:
68.8% (117)
Marital status - American Indian / Alaska Native population 15 years and over
Males 84.6% Never married15.4% Now married0.0% Separated0.0% Widowed0.0% DivorcedFemales 62.5% Never married37.5% Now married0.0% Separated0.0% Widowed0.0% DivorcedWomen who did not give birth in the past 12 months Now married:
0.0% (0)Unmarried:
100.0% (7)
Marital status - Asian population 15 years and over
Males 0.0% Never married100.0% Now married0.0% Separated0.0% Widowed0.0% DivorcedFemales 10.0% Never married90.0% Now married0.0% Separated0.0% Widowed0.0% DivorcedWomen who did not give birth in the past 12 months Now married:
85.2% (25)Unmarried:
14.8% (4)
Marital status - Two or more races population 15 years and over
Males 66.0% Never married34.0% Now married0.0% Separated0.0% Widowed0.0% DivorcedFemales 0.0% Never married26.0% Now married0.0% Separated26.0% Widowed48.0% DivorcedWomen who did not give birth in the past 12 months Now married:
20.0% (6)Unmarried:
80.0% (23)
Marital status - White alone, not Hispanic / Latino population 15 years and over
Males 22.0% Never married68.4% Now married1.1% Separated3.0% Widowed5.5% DivorcedFemales 19.8% Never married55.7% Now married4.7% Separated13.3% Widowed6.5% DivorcedWomen who gave birth in the past 12 months Now married:
100.0% (26)Unmarried:
0.0% (0)
Women who did not give birth in the past 12 months Now married:
46.7% (147)Unmarried:
53.3% (168)
Marital status - Hispanic or Latino population 15 years and over
Males 12.5% Never married87.5% Now married0.0% Separated0.0% Widowed0.0% DivorcedFemales 0.0% Never married81.5% Now married0.0% Separated0.0% Widowed18.5% DivorcedWomen who did not give birth in the past 12 months Now married:
100.0% (15)Unmarried:
0.0% (0)
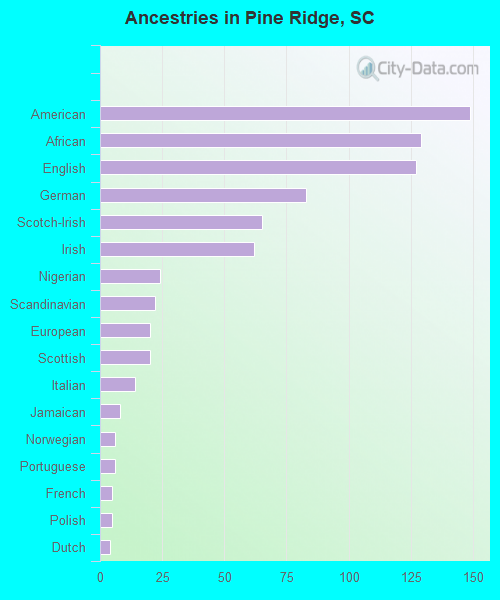
Ancestries in Pine Ridge
149 11.5% American129 9.9% African127 9.8% English83 6.4% German65 5.0% Scotch-Irish62 4.8% Irish24 1.8% Nigerian22 1.7% Scandinavian20 1.5% European20 1.5% Scottish14 1.1% Italian8 0.6% Jamaican6 0.5% Norwegian6 0.5% Portuguese5 0.4% French5 0.4% Polish4 0.3% Dutch1 0.08% British
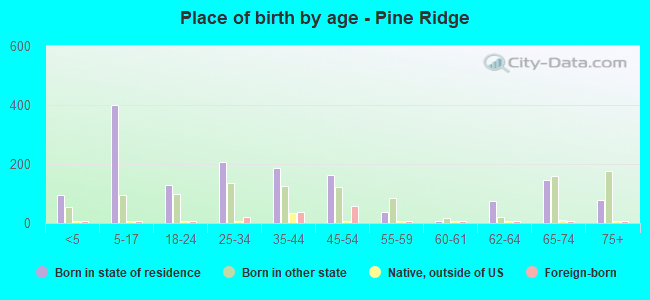
Children Nativity (place of birth) in Pine Ridge
Children under 6 years - Living with two parents Both parents native 142 100.0% NativeOne native, one foreign-born parent 29 100.0% NativeChildren under 6 years - Living with one parent Native parent 11 100.0% NativeChildren 6 to 17 years - Living with two parents Both parents native 214 100.0% NativeBoth parents foreign-born 24 100.0% NativeChildren 6 to 17 years - Living with one parent Native parent 228 100.0% NativeForeign-born parent 10 46.7% Native11 53.3% Foreign-born
Grandparents responsible for own grandchildren in Pine Ridge
Grandparents (30 to 59 years) White / Caucasian 6 100.0% Not responsible for grandchildrenWhite alone, not Hispanic / Latino 6 100.0% Not responsible for grandchildrenGrandparents (60 years and over) White / Caucasian 4 28.9% Responsible for grandchildren9 71.1% Not responsible for grandchildrenWhite alone, not Hispanic / Latino 4 29.9% Responsible for grandchildren9 70.1% Not responsible for grandchildren