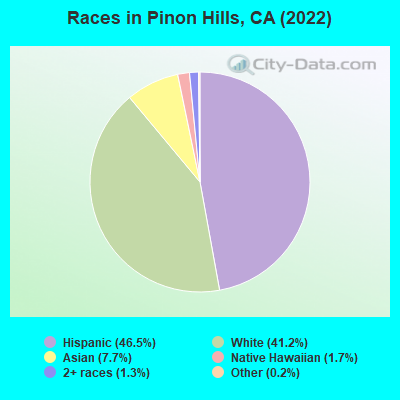
Races in Pinon Hills, California (CA) Detailed Stats
According to 2022 data, the most numerous races in Pinon Hills, CA are Hispanic (2,774 residents), White alone (4,175 residents), and Asian alone (377 residents). 72.3% of Pinon Hills residents speak English at home.
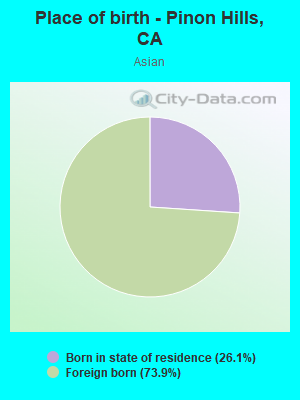
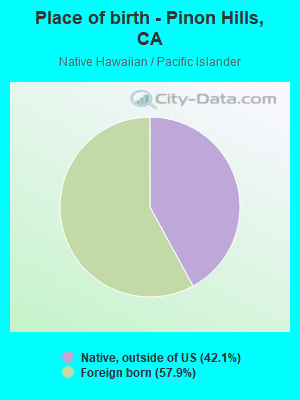
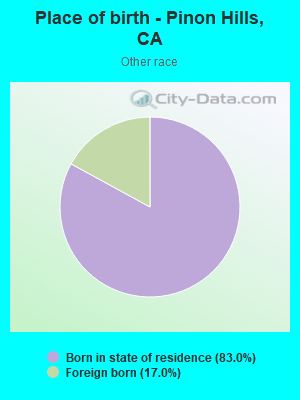
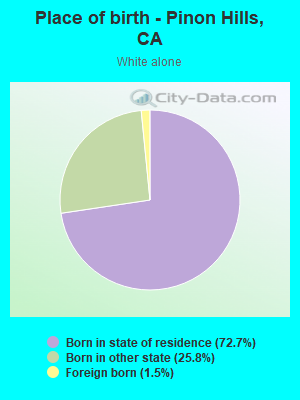
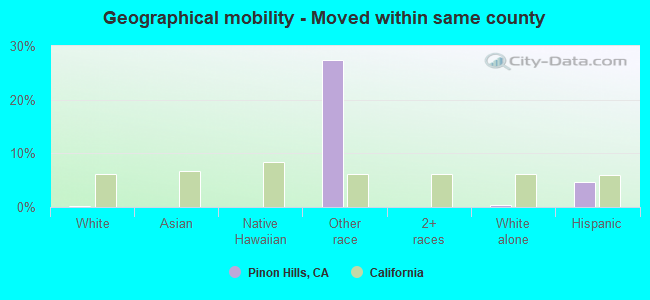
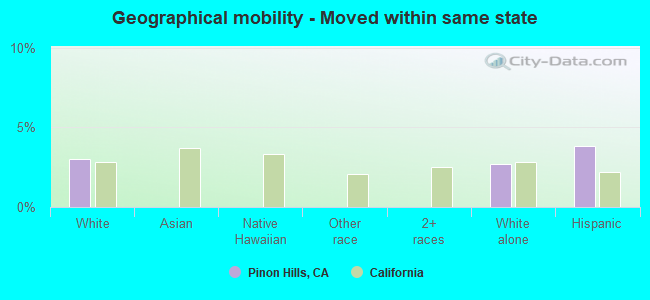
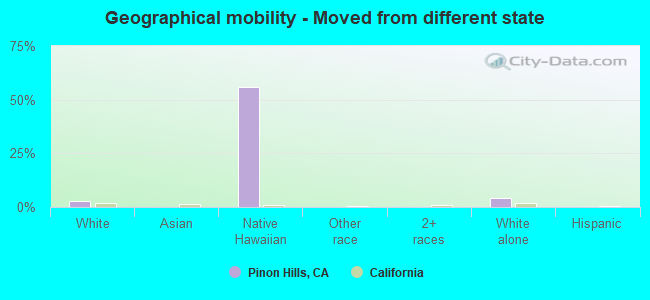
Race distribution in Pinon Hills 4,175 53.6% White alone 2,774 35.6% Hispanic 377 4.8% Asian alone 85 1.1% Native Hawaiian and Other 56 0.7% Two or more races
2000 2022
15,816,790 46.7% White alone 10,966,556 32.4% Hispanic 3,648,860 10.8% Asian alone 2,181,926 6.4% Black alone 903,115 2.7% Two or more races 178,984 0.5% American Indian alone 103,736 0.3% Native Hawaiian and Other 71,681 0.2% Other race alone
15,732,184 40.3% Hispanic 13,160,426 33.7% White alone 5,957,867 15.3% Asian alone 2,025,218 5.2% Black alone 1,663,222 4.3% Two or more races 251,618 0.6% Other race alone 135,777 0.3% Native Hawaiian and Other 103,030 0.3% American Indian alone
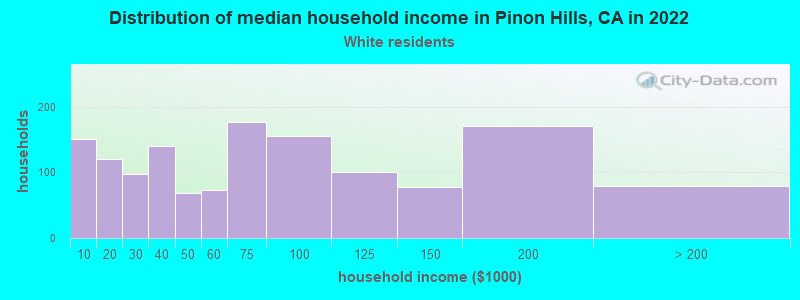
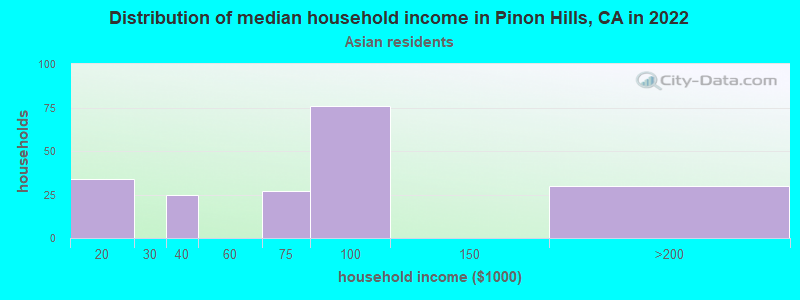
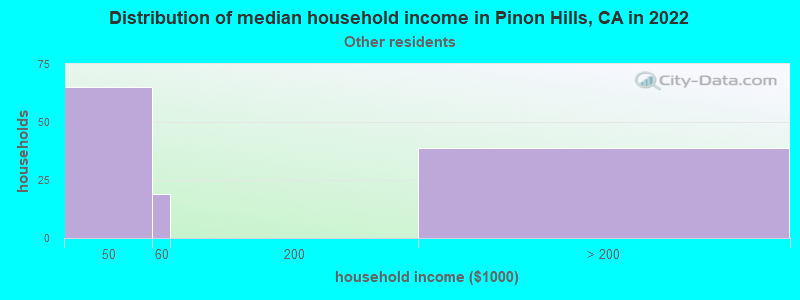
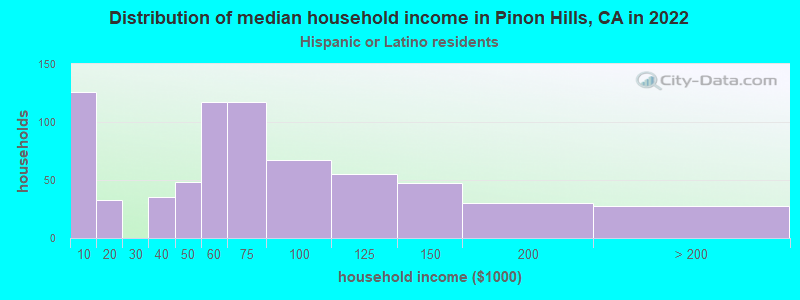
Income and house value in Pinon Hills Median household income in 2022 $80,950 White non-Hispanic householders$35,566 Some other race householders$64,443 Hispanic or Latino race householders
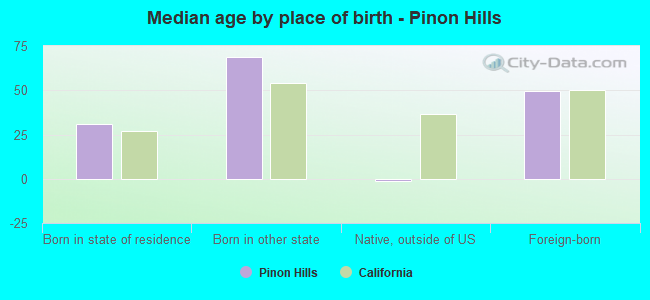
Median age by race in Pinon Hills
46.7 Median age for White residents46.5 47.9 30.7 Median age for Black or African American residents47.2 Median age for Asian residents49.0 46.6 17.6 Median age for Other race residents24.2 15.1 17.2 Median age for Two or more races residents48.4 Median age for White alone residents42.2 55.1 30.6 Median age for Hispanic or Latino residents45.0 25.5
Owner/renter occupied households by race in Pinon Hills
House owners and renters - White residents 1,610 77.4% Owner occupied471 22.6% Renter occupiedHouse owners and renters - Asian residents 139 100.0% Owner occupiedHouse owners and renters - Native Hawaiian / Pacific Islander residents 95 100.0% Renter occupiedHouse owners and renters - Other race residents 47 44.2% Owner occupied59 55.8% Renter occupiedHouse owners and renters - Two or more races residents 156 100.0% Owner occupiedHouse owners and renters - White alone residents 1,300 83.4% Owner occupied258 16.6% Renter occupiedHouse owners and renters - Hispanic or Latino residents 480 58.1% Owner occupied346 41.9% Renter occupied
Language usage in Pinon Hills
English speakers - Total 72.3% of residents of Pinon Hills speak English at home.
22.2% of residents speak Spanish at home 1,128 69.8% Speak English very well488 30.2% Speak English less than very well5.6% of residents speak other language at home 207 51.0% Speak English very well199 49.0% Speak English less than very well
English speakers - Born in the United States 87.6% of residents of Pinon Hills speak English at home.
9.1% of residents speak Spanish at home 120 100.0% Speak English very well3.3% of residents speak other language at home 43 100.0% Speak English very well
All residents speak only English at home
English speakers - Foreign-born 5.5% of residents of Pinon Hills speak English at home.
60.0% of residents speak Spanish at home 168 28.7% Speak English very well418 71.3% Speak English less than very well32.6% of residents speak other language at home 121 38.1% Speak English very well197 61.9% Speak English less than very well
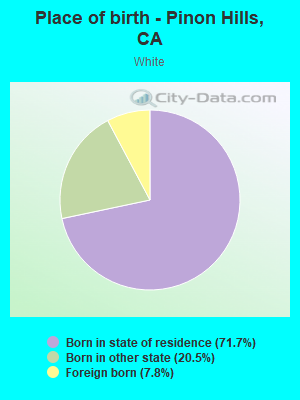
White (Caucasian) - Speak only English Native:
88.0% (4,475)Foreign-born:
10.5% (46)
White (Caucasian) - Speak another language Native:
12.0% (610)Foreign-born:
87.4% (381)
Asian - Speak another language Native:
87.4% (39)Foreign-born:
98.7% (276)
Other race - Speak another language Native:
82.2% (212)Foreign-born:
96.8% (80)
White alone - Speak only English Native:
96.4% (3,785)Foreign-born:
62.8% (42)
White alone - Speak another language Native:
3.2% (126)Foreign-born:
28.9% (19)
Hispanic or Latino - Speak another language Native:
51.0% (1,019)Foreign-born:
97.7% (608)
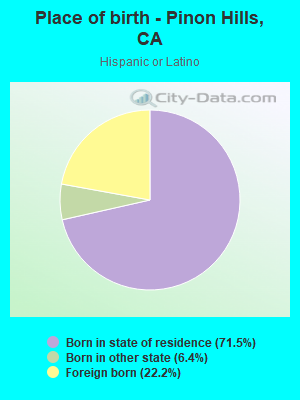
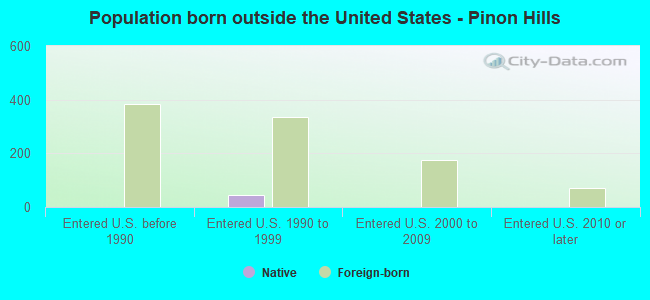
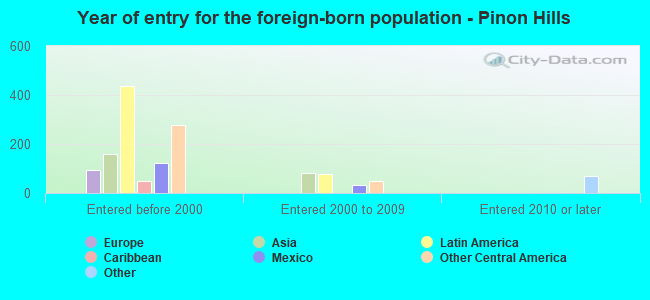
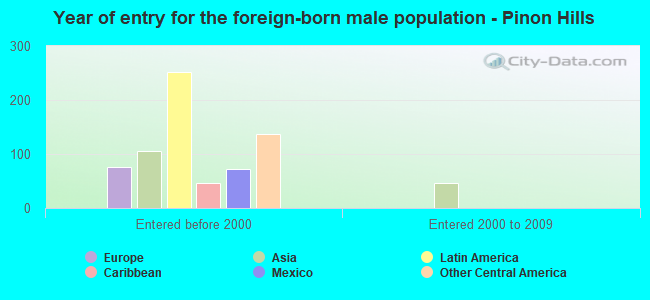
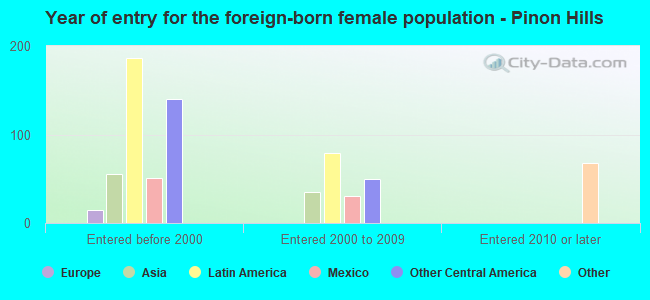
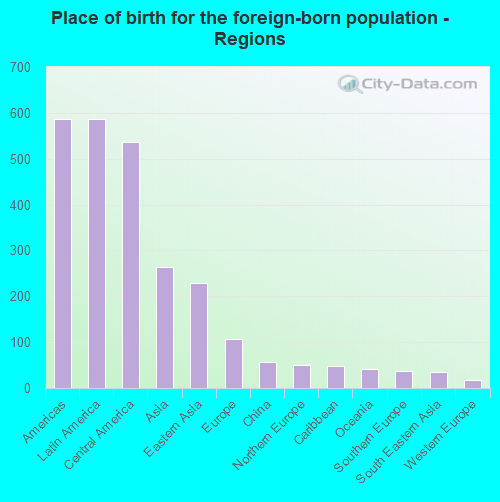
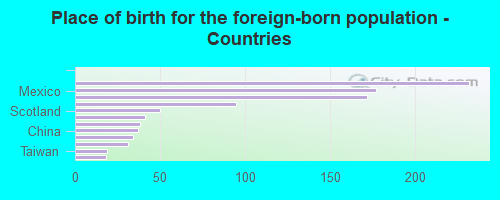
Foreign-born residents in Pinon Hills
Marital status for residents in Pinon Hills Marital status - White (Caucasian) population 15 years and over
Males 25.1% Never married56.7% Now married3.9% Separated6.2% Widowed8.0% DivorcedFemales 22.8% Never married50.6% Now married3.2% Separated15.1% Widowed8.3% DivorcedWomen who did not give birth in the past 12 months Now married:
51.4% (572)Unmarried:
48.6% (542)
Marital status - Asian population 15 years and over
Males 30.7% Never married69.3% Now married0.0% Separated0.0% Widowed0.0% DivorcedFemales 0.0% Never married100.0% Now married0.0% Separated0.0% Widowed0.0% DivorcedWomen who did not give birth in the past 12 months Now married:
100.0% (39)Unmarried:
0.0% (0)
Marital status - Other race population 15 years and over
Males 18.3% Never married81.7% Now married0.0% Separated0.0% Widowed0.0% DivorcedFemales 0.0% Never married95.7% Now married0.0% Separated0.0% Widowed4.3% DivorcedWomen who gave birth in the past 12 months Now married:
100.0% (39)Unmarried:
0.0% (0)
Women who did not give birth in the past 12 months Now married:
93.8% (82)Unmarried:
6.2% (5)
Marital status - White alone, not Hispanic / Latino population 15 years and over
Males 25.8% Never married57.9% Now married2.6% Separated5.5% Widowed8.2% DivorcedFemales 15.5% Never married50.3% Now married4.4% Separated19.3% Widowed10.6% DivorcedWomen who did not give birth in the past 12 months Now married:
60.1% (465)Unmarried:
39.9% (309)
Marital status - Hispanic or Latino population 15 years and over
Males 23.3% Never married57.7% Now married5.4% Separated6.7% Widowed6.9% DivorcedFemales 37.4% Never married57.0% Now married0.0% Separated3.2% Widowed2.4% DivorcedWomen who gave birth in the past 12 months Now married:
100.0% (37)Unmarried:
0.0% (0)
Women who did not give birth in the past 12 months Now married:
44.0% (273)Unmarried:
56.0% (347)
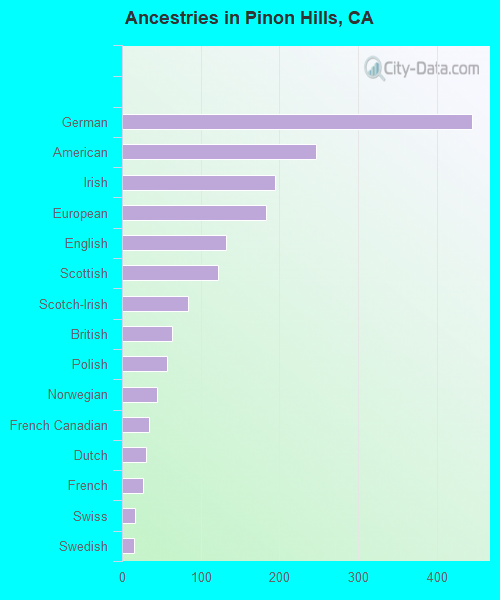
Ancestries in Pinon Hills
444 10.0% German247 5.5% American194 4.4% Irish183 4.1% European132 3.0% English122 2.7% Scottish84 1.9% Scotch-Irish63 1.4% British57 1.3% Polish45 1.0% Norwegian34 0.8% French Canadian31 0.7% Dutch27 0.6% French17 0.4% Swiss15 0.3% Swedish
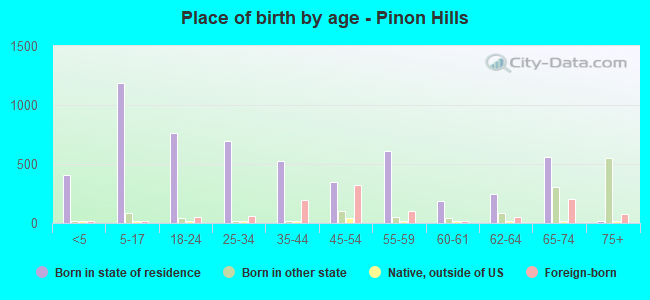
Children Nativity (place of birth) in Pinon Hills
Children under 6 years - Living with two parents Both parents native 285 100.0% NativeBoth parents foreign-born 99 100.0% NativeChildren under 6 years - Living with one parent Native parent 134 100.0% NativeChildren 6 to 17 years - Living with two parents Both parents native 476 100.0% NativeBoth parents foreign-born 189 100.0% NativeOne native, one foreign-born parent 175 100.0% NativeChildren 6 to 17 years - Living with one parent Native parent 251 100.0% NativeForeign-born parent 8 50.0% Native8 50.0% Foreign-born