Races in Poe Valley, Oregon (OR) Detailed Stats
Ancestries, Foreign-born residents, place of birth
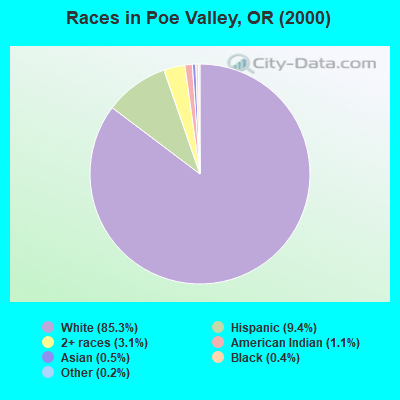
Race distribution in Poe Valley

- 1,20485.3%White alone
- 1339.4%Hispanic
- 443.1%Two or more races
- 151.1%American Indian alone
- 70.5%Asian alone
- 50.4%Black alone
- 30.2%Other race alone
- 10.07%Native Hawaiian and Other
Pacific Islander alone
2000
2022
-
- 2,857,61683.5%White alone
- 275,3148.0%Hispanic
- 100,3332.9%Asian alone
- 82,7332.4%Two or more races
- 53,3251.6%Black alone
- 40,1301.2%American Indian alone
- 7,3980.2%Native Hawaiian and Other
Pacific Islander alone - 4,5500.1%Other race alone

-
- 3,037,57171.6%White alone
- 609,53814.4%Hispanic
- 252,7446.0%Two or more races
- 191,2834.5%Asian alone
- 78,2281.8%Black alone
- 29,3990.7%American Indian alone
- 25,7310.6%Other race alone
- 15,6430.4%Native Hawaiian and Other
Pacific Islander alone

Income and house value in Poe Valley
- Median household income in 2022
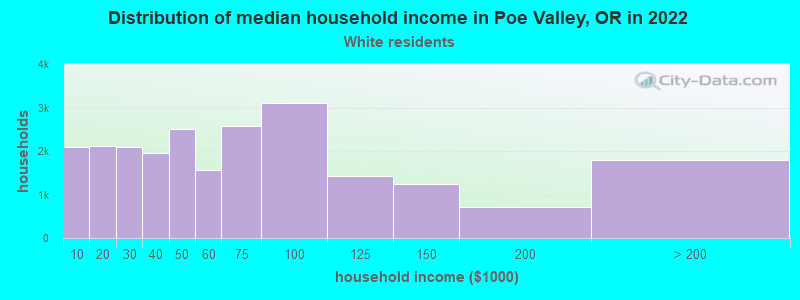
- $57,270White non-Hispanic householders
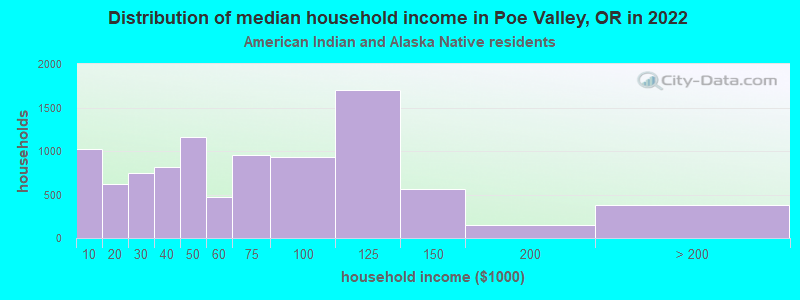
- $58,225American Indian and Alaska Native householders
- $151,832Some other race householders
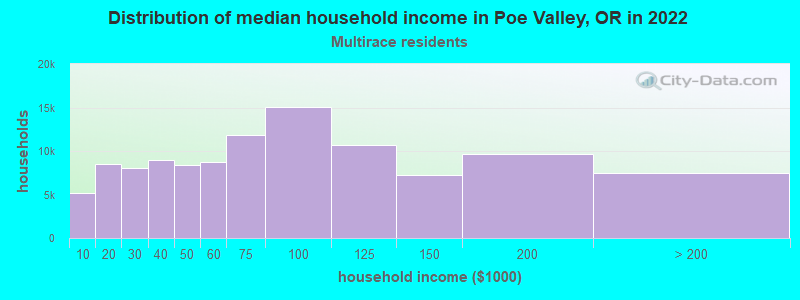
- $95,925Two or more races householders
- $42,179Hispanic or Latino race householders
- Median 2022 house value
- $302,383White Non-Hispanic householders
- $259,885Two or more races householders
- $219,220Hispanic or Latino householders
Household income for White non-Hispanic householders
Household income for American Indian and Alaska Native householders
Household income for Two or more races householders
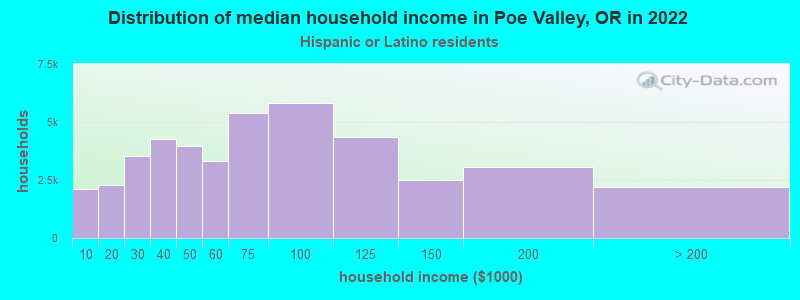
Household income for Hispanic or Latino race householders
Zip code: 97625