Races in Ponca City, Oklahoma (OK) Detailed Stats
Data:
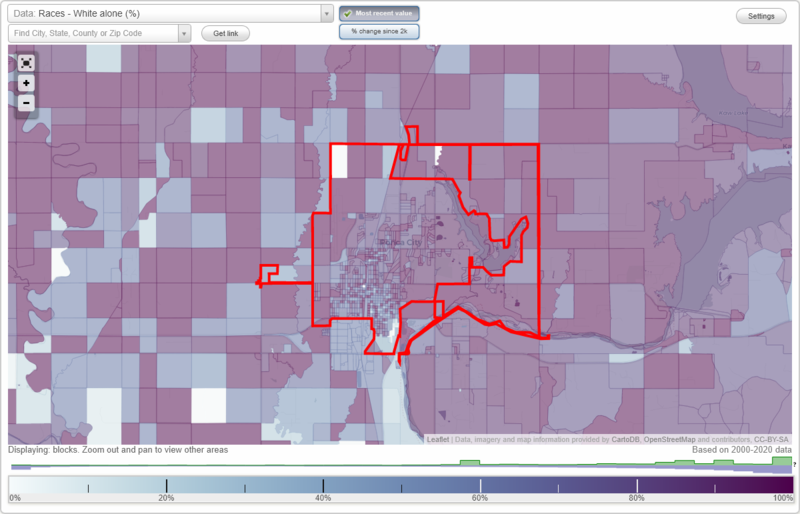
Races - White alone (%)
Races - White alone (% change since 2000)
Races - Black alone (%)
Races - Black alone (% change since 2000)
Races - American Indian alone (%)
Races - American Indian alone (% change since 2000)
Races - Asian alone (%)
Races - Asian alone (% change since 2000)
Races - Hispanic (%)
Races - Hispanic (% change since 2000)
Races - Native Hawaiian and Other Pacific Islander alone (%)
Races - Native Hawaiian and Other Pacific Islander alone (% change since 2000)
Races - Two or more races(%)
Races - Two or more races(% change since 2000)
Races - Other race alone (%)
Races - Other race alone (% change since 2000)
Racial diversity
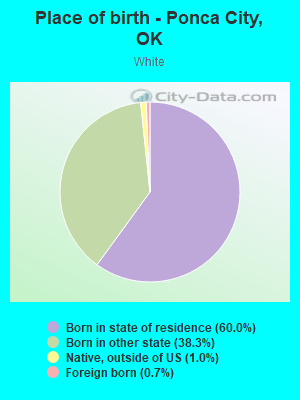
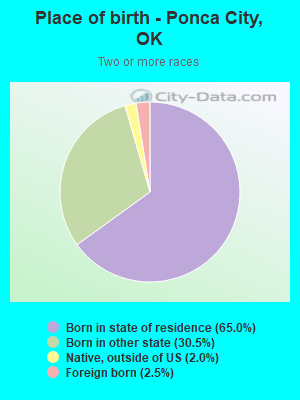
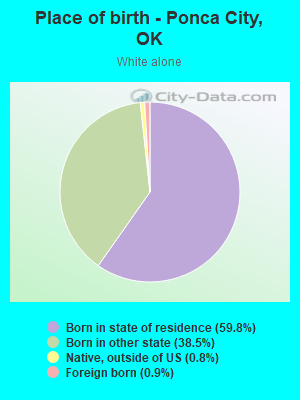
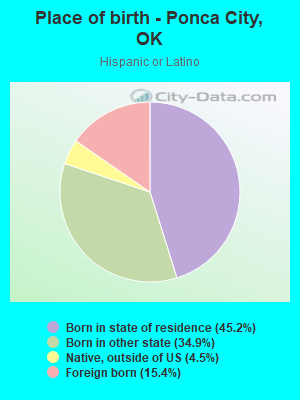
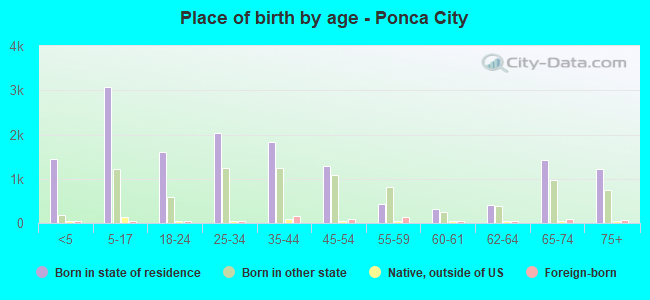
Place of birth - Born in state of residence (%)
Place of birth - Born in state of residence (%) - White
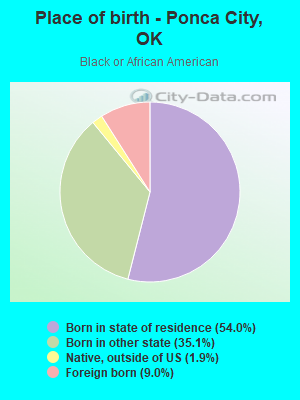
Place of birth - Born in state of residence (%) - Black or African American
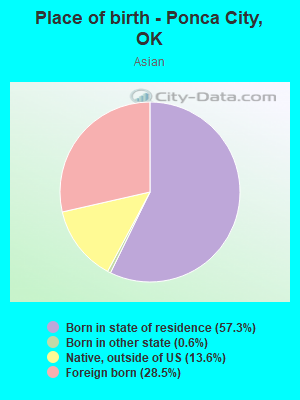
Place of birth - Born in state of residence (%) - Asian
Place of birth - Born in state of residence (%) - Hispanic or Latino
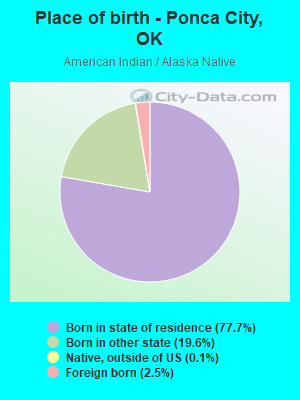
Place of birth - Born in state of residence (%) - American Indian and Alaska Native
Place of birth - Born in state of residence (%) - Multirace
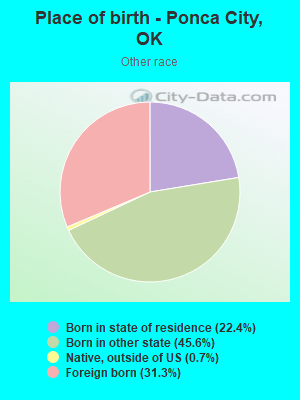
Place of birth - Born in state of residence (%) - Other Race
Place of birth - Born in other state (%)
Place of birth - Born in other state (%) - White
Place of birth - Born in other state (%) - Black or African American
Place of birth - Born in other state (%) - Asian
Place of birth - Born in other state (%) - Hispanic or Latino
Place of birth - Born in other state (%) - American Indian and Alaska Native
Place of birth - Born in other state (%) - Multirace
Place of birth - Born in other state (%) - Other Race
Place of birth - Native, outside of US (%)
Place of birth - Native, outside of US (%) - White
Place of birth - Native, outside of US (%) - Black or African American
Place of birth - Native, outside of US (%) - Asian
Place of birth - Native, outside of US (%) - Hispanic or Latino
Place of birth - Native, outside of US (%) - American Indian and Alaska Native
Place of birth - Native, outside of US (%) - Multirace
Place of birth - Native, outside of US (%) - Other Race
Place of birth - Foreign born (%)
Place of birth - Foreign born (%) - White
Place of birth - Foreign born (%) - Black or African American
Place of birth - Foreign born (%) - Asian
Place of birth - Foreign born (%) - Hispanic or Latino
Place of birth - Foreign born (%) - American Indian and Alaska Native
Place of birth - Foreign born (%) - Multirace
Place of birth - Foreign born (%) - Other Race
Residents speaking English at home (%)
Residents speaking English at home - Born in the United States (%)
Residents speaking English at home - Native, born elsewhere (%)
Residents speaking English at home - Foreign born (%)
Residents speaking Spanish at home (%)
Residents speaking Spanish at home - Born in the United States (%)
Residents speaking Spanish at home - Native, born elsewhere (%)
Residents speaking Spanish at home - Foreign born (%)
Residents speaking other language at home (%)
Residents speaking other language at home - Born in the United States (%)
Residents speaking other language at home - Native, born elsewhere (%)
Residents speaking other language at home - Foreign born (%)
Marital status - Never married (%)
Marital status - Now married (%)
Marital status - Separated (%)
Marital status - Widowed (%)
Marital status - Divorced (%)
Ancestries Reported - Arab (%)
Ancestries Reported - Czech (%)
Ancestries Reported - Danish (%)
Ancestries Reported - Dutch (%)
Ancestries Reported - English (%)
Ancestries Reported - French (%)
Ancestries Reported - French Canadian (%)
Ancestries Reported - German (%)
Ancestries Reported - Greek (%)
Ancestries Reported - Hungarian (%)
Ancestries Reported - Irish (%)
Ancestries Reported - Italian (%)
Ancestries Reported - Lithuanian (%)
Ancestries Reported - Norwegian (%)
Ancestries Reported - Polish (%)
Ancestries Reported - Portuguese (%)
Ancestries Reported - Russian (%)
Ancestries Reported - Scotch-Irish (%)
Ancestries Reported - Scottish (%)
Ancestries Reported - Slovak (%)
Ancestries Reported - Subsaharan African (%)
Ancestries Reported - Swedish (%)
Ancestries Reported - Swiss (%)
Ancestries Reported - Ukrainian (%)
Ancestries Reported - United States (%)
Ancestries Reported - Welsh (%)
Ancestries Reported - West Indian (%)
Ancestries Reported - Other (%)
Geographical mobility - Same house 1 year ago (%)
Geographical mobility - Same house 1 year ago (%) - White
Geographical mobility - Same house 1 year ago (%) - Black or African American
Geographical mobility - Same house 1 year ago (%) - Asian
Geographical mobility - Same house 1 year ago (%) - Hispanic or Latino
Geographical mobility - Same house 1 year ago (%) - American Indian and Alaska Native
Geographical mobility - Same house 1 year ago (%) - Multirace
Geographical mobility - Same house 1 year ago (%) - Other Race
Geographical mobility - Moved within same county (%)
Geographical mobility - Moved within same county (%) - White
Geographical mobility - Moved within same county (%) - Black or African American
Geographical mobility - Moved within same county (%) - Asian
Geographical mobility - Moved within same county (%) - Hispanic or Latino
Geographical mobility - Moved within same county (%) - American Indian and Alaska Native
Geographical mobility - Moved within same county (%) - Multirace
Geographical mobility - Moved within same county (%) - Other Race
Geographical mobility - Moved from different county within same state (%)
Geographical mobility - Moved from different county within same state (%) - White
Geographical mobility - Moved from different county within same state (%) - Black or African American
Geographical mobility - Moved from different county within same state (%) - Asian
Geographical mobility - Moved from different county within same state (%) - Hispanic or Latino
Geographical mobility - Moved from different county within same state (%) - American Indian and Alaska Native
Geographical mobility - Moved from different county within same state (%) - Multirace
Geographical mobility - Moved from different county within same state (%) - Other Race
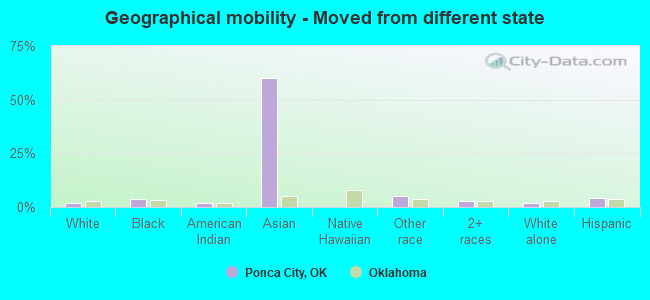
Geographical mobility - Moved from different state (%)
Geographical mobility - Moved from different state (%) - White
Geographical mobility - Moved from different state (%) - Black or African American
Geographical mobility - Moved from different state (%) - Asian
Geographical mobility - Moved from different state (%) - Hispanic or Latino
Geographical mobility - Moved from different state (%) - American Indian and Alaska Native
Geographical mobility - Moved from different state (%) - Multirace
Geographical mobility - Moved from different state (%) - Other Race
Geographical mobility - Moved from abroad (%)
Geographical mobility - Moved from abroad (%) - White
Geographical mobility - Moved from abroad (%) - Black or African American
Geographical mobility - Moved from abroad (%) - Asian
Geographical mobility - Moved from abroad (%) - Hispanic or Latino
Geographical mobility - Moved from abroad (%) - American Indian and Alaska Native
Geographical mobility - Moved from abroad (%) - Multirace
Geographical mobility - Moved from abroad (%) - Other Race
Place of birth for the foreign-born population - Ireland (%)
Place of birth for the foreign-born population - Denmark (%)
Place of birth for the foreign-born population - Norway (%)
Place of birth for the foreign-born population - Sweden (%)
Place of birth for the foreign-born population - United Kingdom (%)
Place of birth for the foreign-born population - England (%)
Place of birth for the foreign-born population - Scotland (%)
Place of birth for the foreign-born population - Other Northern Europe (%)
Place of birth for the foreign-born population - Austria (%)
Place of birth for the foreign-born population - Belgium (%)
Place of birth for the foreign-born population - France (%)
Place of birth for the foreign-born population - Germany (%)
Place of birth for the foreign-born population - Netherlands (%)
Place of birth for the foreign-born population - Switzerland (%)
Place of birth for the foreign-born population - Other Western Europe (%)
Place of birth for the foreign-born population - Greece (%)
Place of birth for the foreign-born population - Italy (%)
Place of birth for the foreign-born population - Portugal (%)
Place of birth for the foreign-born population - Spain (%)
Place of birth for the foreign-born population - Other Southern Europe (%)
Place of birth for the foreign-born population - Albania (%)
Place of birth for the foreign-born population - Belarus (%)
Place of birth for the foreign-born population - Bosnia and Herzegovina (%)
Place of birth for the foreign-born population - Bulgaria (%)
Place of birth for the foreign-born population - Croatia (%)
Place of birth for the foreign-born population - Czechoslovakia (%)
Place of birth for the foreign-born population - Hungary (%)
Place of birth for the foreign-born population - Latvia (%)
Place of birth for the foreign-born population - Lithuania (%)
Place of birth for the foreign-born population - North Macedonia (Macedonia) (%)
Place of birth for the foreign-born population - Moldova (%)
Place of birth for the foreign-born population - Poland (%)
Place of birth for the foreign-born population - Romania (%)
Place of birth for the foreign-born population - Russia (%)
Place of birth for the foreign-born population - Serbia (%)
Place of birth for the foreign-born population - Ukraine (%)
Place of birth for the foreign-born population - Other Eastern Europe (%)
Place of birth for the foreign-born population - China (%)
Place of birth for the foreign-born population - Hong Kong (%)
Place of birth for the foreign-born population - Taiwan (%)
Place of birth for the foreign-born population - Japan (%)
Place of birth for the foreign-born population - Korea (%)
Place of birth for the foreign-born population - Other Eastern Asia (%)
Place of birth for the foreign-born population - Afghanistan (%)
Place of birth for the foreign-born population - Bangladesh (%)
Place of birth for the foreign-born population - India (%)
Place of birth for the foreign-born population - Iran (%)
Place of birth for the foreign-born population - Kazakhstan (%)
Place of birth for the foreign-born population - Nepal (%)
Place of birth for the foreign-born population - Pakistan (%)
Place of birth for the foreign-born population - Sri Lanka (%)
Place of birth for the foreign-born population - Uzbekistan (%)
Place of birth for the foreign-born population - Other South Central Asia (%)
Place of birth for the foreign-born population - Burma (%)
Place of birth for the foreign-born population - Cambodia (%)
Place of birth for the foreign-born population - Indonesia (%)
Place of birth for the foreign-born population - Laos (%)
Place of birth for the foreign-born population - Malaysia (%)
Place of birth for the foreign-born population - Philippines (%)
Place of birth for the foreign-born population - Singapore (%)
Place of birth for the foreign-born population - Thailand (%)
Place of birth for the foreign-born population - Vietnam (%)
Place of birth for the foreign-born population - Other South Eastern Asia (%)
Place of birth for the foreign-born population - Armenia (%)
Place of birth for the foreign-born population - Iraq (%)
Place of birth for the foreign-born population - Israel (%)
Place of birth for the foreign-born population - Jordan (%)
Place of birth for the foreign-born population - Kuwait (%)
Place of birth for the foreign-born population - Lebanon (%)
Place of birth for the foreign-born population - Saudi Arabia (%)
Place of birth for the foreign-born population - Syria (%)
Place of birth for the foreign-born population - Turkey (%)
Place of birth for the foreign-born population - Yemen (%)
Place of birth for the foreign-born population - Other Western Asia (%)
Place of birth for the foreign-born population - Eritrea (%)
Place of birth for the foreign-born population - Ethiopia (%)
Place of birth for the foreign-born population - Kenya (%)
Place of birth for the foreign-born population - Somalia (%)
Place of birth for the foreign-born population - Uganda (%)
Place of birth for the foreign-born population - Zimbabwe (%)
Place of birth for the foreign-born population - Other Eastern Africa (%)
Place of birth for the foreign-born population - Cameroon (%)
Place of birth for the foreign-born population - Congo (%)
Place of birth for the foreign-born population - Democratic Republic of Congo (Zaire) (%)
Place of birth for the foreign-born population - Other Middle Africa (%)
Place of birth for the foreign-born population - Egypt (%)
Place of birth for the foreign-born population - Morocco (%)
Place of birth for the foreign-born population - Sudan (%)
Place of birth for the foreign-born population - Other Northern Africa (%)
Place of birth for the foreign-born population - South Africa (%)
Place of birth for the foreign-born population - Other Southern Africa (%)
Place of birth for the foreign-born population - Cabo Verde (%)
Place of birth for the foreign-born population - Ghana (%)
Place of birth for the foreign-born population - Liberia (%)
Place of birth for the foreign-born population - Nigeria (%)
Place of birth for the foreign-born population - Senegal (%)
Place of birth for the foreign-born population - Sierra Leone (%)
Place of birth for the foreign-born population - Other Western Africa (%)
Place of birth for the foreign-born population - Australia (%)
Place of birth for the foreign-born population - New Zealand (%)
Place of birth for the foreign-born population - Fiji (%)
Place of birth for the foreign-born population - Micronesia (%)
Place of birth for the foreign-born population - Bahamas (%)
Place of birth for the foreign-born population - Barbados (%)
Place of birth for the foreign-born population - Cuba (%)
Place of birth for the foreign-born population - Dominica (%)
Place of birth for the foreign-born population - Dominican Republic (%)
Place of birth for the foreign-born population - Grenada (%)
Place of birth for the foreign-born population - Haiti (%)
Place of birth for the foreign-born population - Jamaica (%)
Place of birth for the foreign-born population - St. Vincent and the Grenadines (%)
Place of birth for the foreign-born population - Trinidad and Tobago (%)
Place of birth for the foreign-born population - West Indies (%)
Place of birth for the foreign-born population - Other Caribbean (%)
Place of birth for the foreign-born population - Belize (%)
Place of birth for the foreign-born population - Costa Rica (%)
Place of birth for the foreign-born population - El Salvador (%)
Place of birth for the foreign-born population - Guatemala (%)
Place of birth for the foreign-born population - Honduras (%)
Place of birth for the foreign-born population - Mexico (%)
Place of birth for the foreign-born population - Nicaragua (%)
Place of birth for the foreign-born population - Panama (%)
Place of birth for the foreign-born population - Other Central America (%)
Place of birth for the foreign-born population - Argentina (%)
Place of birth for the foreign-born population - Bolivia (%)
Place of birth for the foreign-born population - Brazil (%)
Place of birth for the foreign-born population - Chile (%)
Place of birth for the foreign-born population - Colombia (%)
Place of birth for the foreign-born population - Ecuador (%)
Place of birth for the foreign-born population - Guyana (%)
Place of birth for the foreign-born population - Peru (%)
Place of birth for the foreign-born population - Uruguay (%)
Place of birth for the foreign-born population - Venezuela (%)
Place of birth for the foreign-born population - Other South America (%)
Place of birth for the foreign-born population - Canada (%)
Place of birth for the foreign-born population - Other Northern America (%)
Place of birth for the foreign-born population - Other (%)
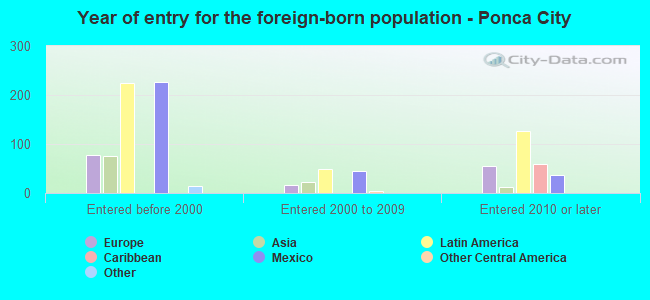
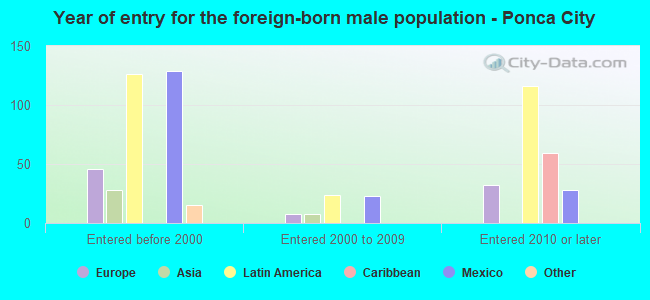
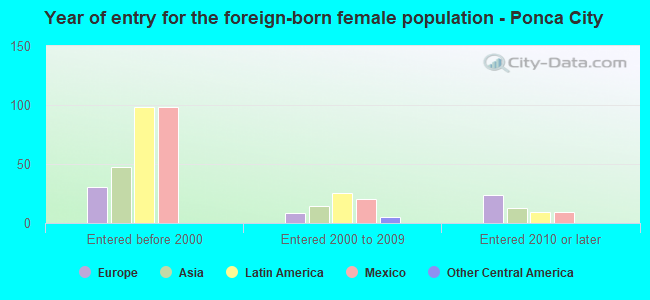
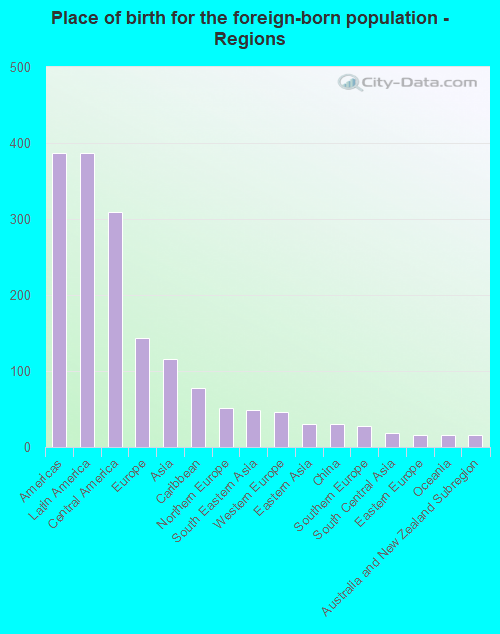
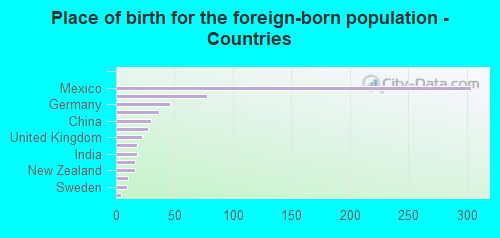
According to 2022 data, the most numerous races in Ponca City, OK are White alone (16,903 residents), Hispanic (2,418 residents), and Two or more races (2,606 residents). 93.8% of Ponca City residents speak English at home. 2.7% of Ponca City, OK residents are foreign-born (1.6% born in Latin America, 0.6% born in Europe, 0.5% born in Asia), which is 123.6% less than the foreign-born rate of 6.0% across the entire state of Oklahoma.
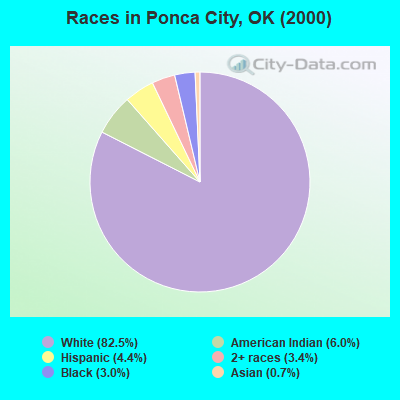
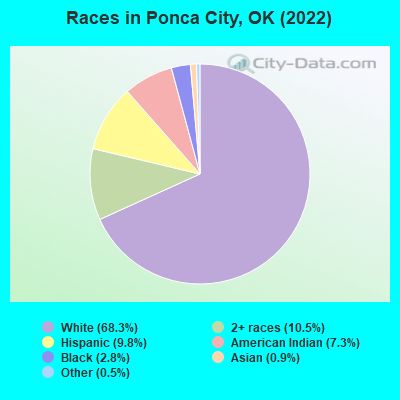
Race distribution in Ponca City
2000 2022
2,556,368 74.1% White alone 266,158 7.7% American Indian alone 257,981 7.5% Black alone 179,304 5.2% Hispanic 140,249 4.1% Two or more races 46,172 1.3% Asian alone 2,322 0.07% Other race alone 2,100 0.06% Native Hawaiian and Other
2,517,403 62.6% White alone 486,692 12.1% Hispanic 364,453 9.1% Two or more races 273,650 6.8% American Indian alone 268,543 6.7% Black alone 92,672 2.3% Asian alone 10,786 0.3% Other race alone 5,601 0.1% Native Hawaiian and Other
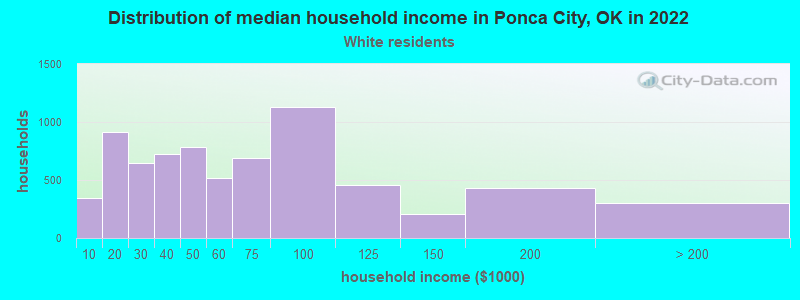
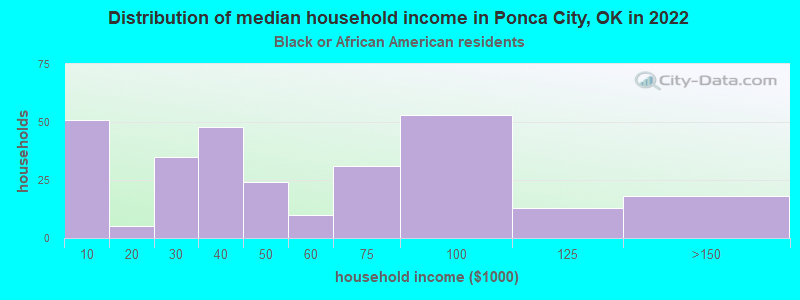
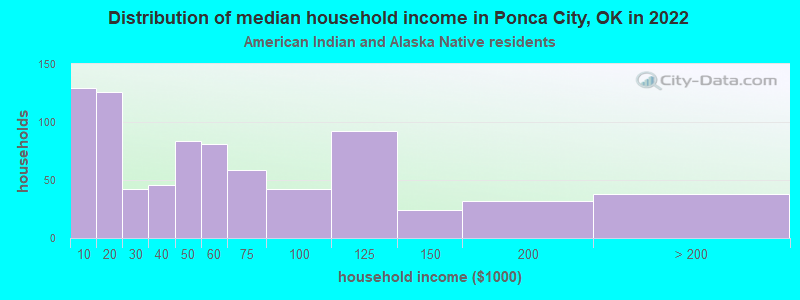
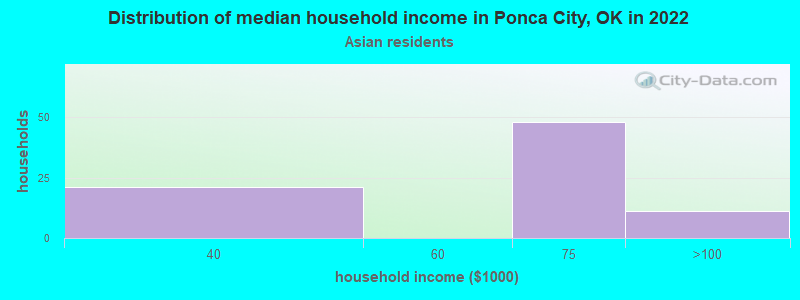
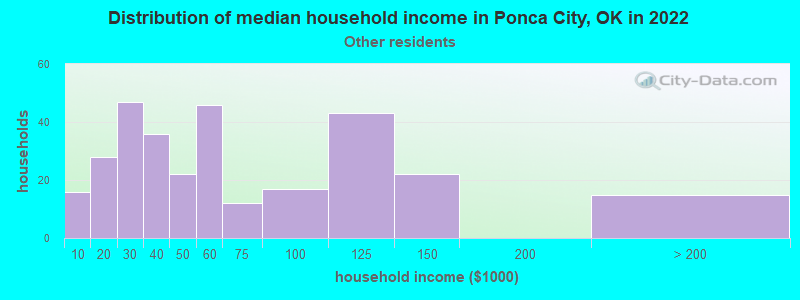
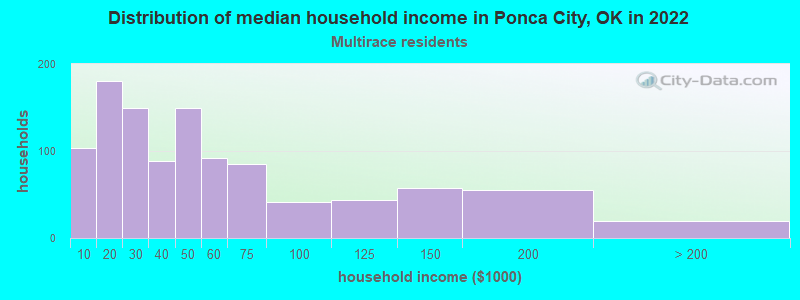
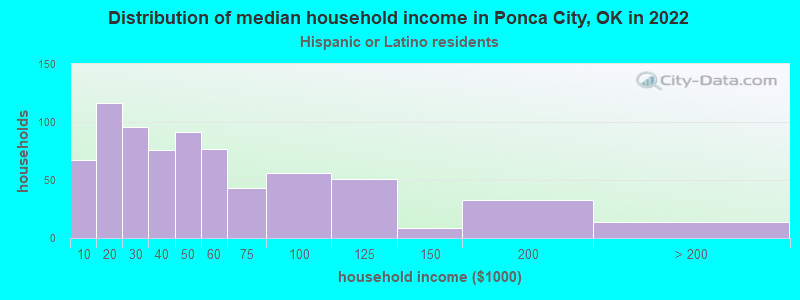
Income and house value in Ponca City Median household income in 2022 $51,273 White non-Hispanic householders$39,885 Black householders$45,517 American Indian and Alaska Native householders$65,934 Asian householders$51,389 Some other race householders$41,388 Two or more races householders$41,589 Hispanic or Latino race householdersMedian 2022 house value $138,040 White Non-Hispanic householders$85,071 Black or African American householders$85,071 American Indian or Alaska Native householders $240,310 Asian householders$63,058 Some other race householders$133,225 Two or more races householders$75,440 Hispanic or Latino householders
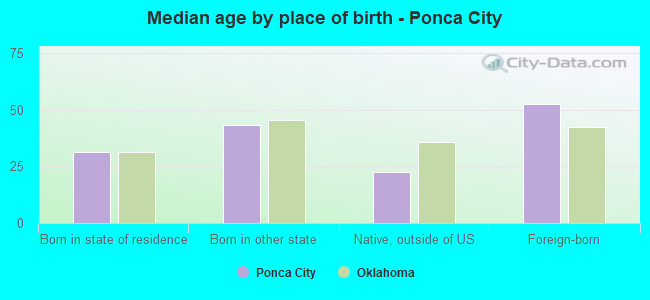
Median age by race in Ponca City
40.8 Median age for White residents40.4 41.9 34.2 Median age for Black or African American residents34.0 36.2 29.9 Median age for American Indian / Alaska Native residents28.2 31.4 21.5 Median age for Asian residents87.6 21.5 -725,225,224.5 Median age for Native Hawaiian / Pacific Islander residents-675,324,674.6 -767,251,461.2 34.7 Median age for Other race residents33.5 42.2 22.5 Median age for Two or more races residents24.0 22.4 41.3 Median age for White alone residents40.3 42.4 22.3 Median age for Hispanic or Latino residents24.3 20.1
Owner/renter occupied households by race in Ponca City
House owners and renters - White residents 4,699 66.0% Owner occupied2,426 34.0% Renter occupiedHouse owners and renters - Black or African American residents 110 37.0% Owner occupied188 63.0% Renter occupiedHouse owners and renters - American Indian / Alaska Native residents 368 47.6% Owner occupied404 52.4% Renter occupiedHouse owners and renters - Asian residents 26 32.7% Owner occupied54 67.3% Renter occupiedHouse owners and renters - Other race residents 161 52.9% Owner occupied144 47.1% Renter occupiedHouse owners and renters - Two or more races residents 525 48.7% Owner occupied553 51.3% Renter occupiedHouse owners and renters - White alone residents 4,667 65.6% Owner occupied2,450 34.4% Renter occupiedHouse owners and renters - Hispanic or Latino residents 390 53.1% Owner occupied345 46.9% Renter occupied
Language usage in Ponca City
English speakers - Total 93.8% of residents of Ponca City speak English at home.
5.0% of residents speak Spanish at home 888 77.1% Speak English very well264 22.9% Speak English less than very well1.2% of residents speak other language at home 190 67.4% Speak English very well92 32.6% Speak English less than very well
English speakers - Born in the United States 95.6% of residents of Ponca City speak English at home.
3.8% of residents speak Spanish at home 276 84.9% Speak English very well49 15.1% Speak English less than very well0.6% of residents speak other language at home 54 100.0% Speak English very well
English speakers - Native, born elsewhere 72.1% of residents of Ponca City speak English at home.
25.6% of residents speak Spanish at home 57 74.0% Speak English very well20 26.0% Speak English less than very well
English speakers - Foreign-born 32.6% of residents of Ponca City speak English at home.
45.2% of residents speak Spanish at home 125 41.7% Speak English very well175 58.3% Speak English less than very well21.1% of residents speak other language at home 54 38.6% Speak English very well86 61.4% Speak English less than very well
White (Caucasian) - Speak only English Native:
98.4% (15,878)Foreign-born:
47.3% (54)
White (Caucasian) - Speak another language Native:
1.9% (304)Foreign-born:
59.7% (69)
Black or African American - Speak only English Native:
96.4% (623)Foreign-born:
89.3% (61)
American Indian / Alaska Native - Speak only English Native:
96.3% (1,762)Foreign-born:
93.4% (48)
Asian - Speak only English Native:
85.2% (93)Foreign-born:
47.5% (31)
Asian - Speak another language Native:
14.6% (16)Foreign-born:
50.5% (33)
Other race - Speak another language Native:
34.4% (187)Foreign-born:
100.0% (261)
Two or more races - Speak only English Native:
86.7% (2,805)Foreign-born:
18.3% (17)
Two or more races - Speak another language Native:
12.7% (410)Foreign-born:
76.6% (71)
White alone - Speak only English Native:
98.1% (15,635)Foreign-born:
36.8% (59)
White alone - Speak another language Native:
1.9% (306)Foreign-born:
62.4% (100)
Hispanic or Latino - Speak only English Native:
67.3% (1,176)Foreign-born:
19.2% (72)
Hispanic or Latino - Speak another language Native:
33.1% (578)Foreign-born:
82.1% (307)
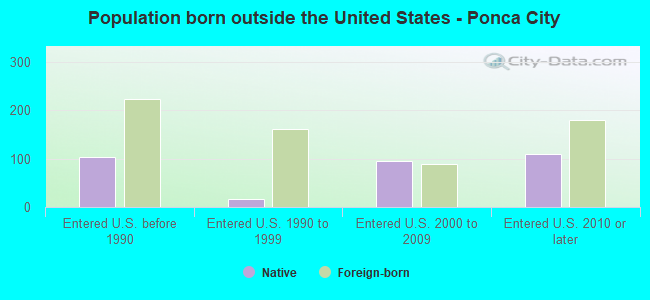
Foreign-born residents in Ponca City 664 residents are foreign born (1.6% Latin America , 0.6% Europe , 0.5% Asia ).
This city:
2.7%Oklahoma:
6.1%
Marital status for residents in Ponca City Marital status - White (Caucasian) population 15 years and over
Males 30.7% Never married48.5% Now married0.7% Separated4.1% Widowed16.1% DivorcedFemales 21.6% Never married44.8% Now married2.2% Separated10.1% Widowed21.2% DivorcedWomen who gave birth in the past 12 months Now married:
74.2% (114)Unmarried:
25.8% (40)
Women who did not give birth in the past 12 months Now married:
41.5% (1,459)Unmarried:
58.5% (2,058)
Marital status - Black or African American population 15 years and over
Males 50.6% Never married31.8% Now married0.0% Separated0.0% Widowed17.7% DivorcedFemales 44.8% Never married24.5% Now married0.0% Separated10.7% Widowed19.9% DivorcedWomen who did not give birth in the past 12 months Now married:
11.0% (14)Unmarried:
89.0% (114)
Marital status - American Indian / Alaska Native population 15 years and over
Males 49.0% Never married32.4% Now married1.6% Separated0.9% Widowed16.1% DivorcedFemales 36.2% Never married24.2% Now married8.2% Separated5.6% Widowed25.8% DivorcedWomen who gave birth in the past 12 months Now married:
100.0% (18)Unmarried:
0.0% (0)
Women who did not give birth in the past 12 months Now married:
34.7% (213)Unmarried:
65.3% (401)
Marital status - Asian population 15 years and over
Males 42.1% Never married0.0% Now married0.0% Separated57.9% Widowed0.0% DivorcedFemales 75.4% Never married24.6% Now married0.0% Separated0.0% Widowed0.0% DivorcedWomen who did not give birth in the past 12 months Now married:
8.7% (9)Unmarried:
91.3% (95)
Marital status - Other race population 15 years and over
Males 37.4% Never married45.9% Now married0.0% Separated0.0% Widowed16.7% DivorcedFemales 18.0% Never married35.5% Now married4.7% Separated8.1% Widowed33.7% DivorcedWomen who gave birth in the past 12 months Now married:
0.0% (0)Unmarried:
100.0% (5)
Women who did not give birth in the past 12 months Now married:
44.2% (49)Unmarried:
55.8% (62)
Marital status - Two or more races population 15 years and over
Males 46.4% Never married31.0% Now married1.4% Separated2.8% Widowed18.4% DivorcedFemales 40.6% Never married42.0% Now married0.8% Separated9.3% Widowed7.3% DivorcedWomen who gave birth in the past 12 months Now married:
51.9% (89)Unmarried:
48.1% (83)
Women who did not give birth in the past 12 months Now married:
39.4% (328)Unmarried:
60.6% (506)
Marital status - White alone, not Hispanic / Latino population 15 years and over
Males 30.0% Never married49.0% Now married0.7% Separated3.9% Widowed16.3% DivorcedFemales 21.2% Never married44.7% Now married2.2% Separated10.3% Widowed21.5% DivorcedWomen who gave birth in the past 12 months Now married:
81.9% (118)Unmarried:
18.1% (26)
Women who did not give birth in the past 12 months Now married:
40.6% (1,412)Unmarried:
59.4% (2,069)
Marital status - Hispanic or Latino population 15 years and over
Males 44.2% Never married34.3% Now married0.3% Separated5.0% Widowed16.3% DivorcedFemales 34.5% Never married40.7% Now married7.2% Separated3.8% Widowed13.8% DivorcedWomen who gave birth in the past 12 months Now married:
57.6% (58)Unmarried:
42.4% (43)
Women who did not give birth in the past 12 months Now married:
51.3% (261)Unmarried:
48.7% (248)
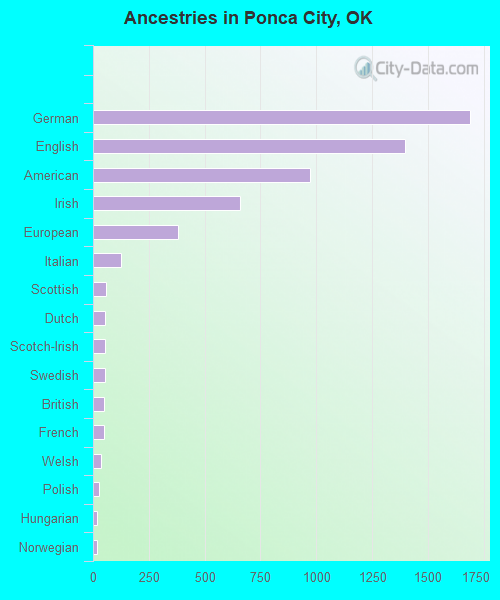
Ancestries in Ponca City
1,689 18.1% German1,397 15.0% English974 10.4% American659 7.1% Irish380 4.1% European124 1.3% Italian59 0.6% Scottish55 0.6% Dutch55 0.6% Scotch-Irish52 0.6% Swedish51 0.5% British49 0.5% French35 0.4% Welsh25 0.3% Polish20 0.2% Hungarian17 0.2% Norwegian15 0.2% Greek14 0.1% Danish14 0.1% French Canadian13 0.1% Eastern European11 0.1% Lithuanian9 0.10% Portuguese7 0.07% Russian4 0.04% Northern European4 0.04% Pennsylvania German3 0.03% Dutch West Indian
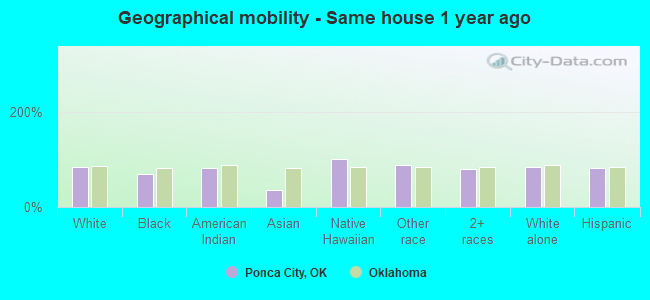
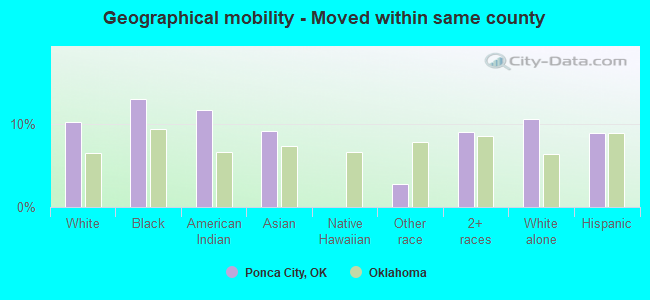
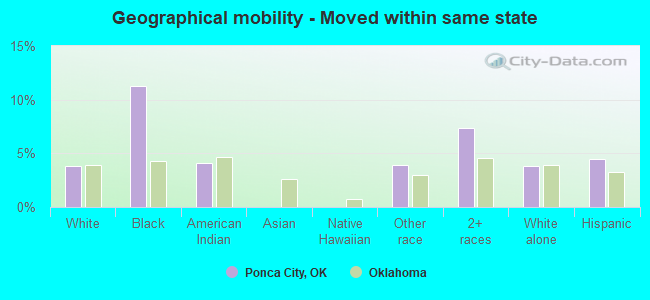
Geographical mobility in Ponca City Same house 1 year ago 14,066 83.1% White (Caucasian)530 70.2% Black or African American1,643 81.1% American Indian / Alaska Native85 36.3% Asian19 100.0% Native Hawaiian / Pacific Islander718 87.7% Other race2,987 80.0% Two or more races13,882 82.7% White alone, not Hispanic / Latino1,909 81.7% Hispanic or LatinoMoved within same county 1,750 10.3% White / Caucasian99 13.1% Black or African American238 11.7% American Indian / Alaska Native22 9.2% Asian23 2.8% Other race341 9.1% Two or more races1,787 10.6% White alone, not Hispanic / Latino210 9.0% Hispanic or LatinoMoved within same state 653 3.9% White / Caucasian85 11.3% Black or African American83 4.1% American Indian / Alaska Native32 3.9% Other race276 7.4% Two or more races645 3.8% White alone, not Hispanic / Latino105 4.5% Hispanic or LatinoMoved from different state 325 1.9% White / Caucasian29 3.9% Black or African American38 1.9% American Indian / Alaska Native142 60.3% Asian41 5.0% Other race102 2.7% Two or more races340 2.0% White alone, not Hispanic / Latino100 4.3% Hispanic or Latino
Children Nativity (place of birth) in Ponca City
Children under 6 years - Living with two parents Both parents native 1,056 100.0% NativeOne native, one foreign-born parent 88 100.0% NativeChildren under 6 years - Living with one parent Native parent 753 100.0% NativeChildren 6 to 17 years - Living with two parents Both parents native 2,220 100.0% Native0 0.0% Foreign-bornBoth parents foreign-born 27 82.4% Native6 17.6% Foreign-bornOne native, one foreign-born parent 52 100.0% NativeChildren 6 to 17 years - Living with one parent Native parent 1,477 100.0% NativeForeign-born parent 68 49.9% Native68 50.1% Foreign-born
Grandparents responsible for own grandchildren in Ponca City
Grandparents (30 to 59 years) White / Caucasian 44 54.1% Responsible for grandchildren37 45.9% Not responsible for grandchildrenBlack or African American 61 100.0% Responsible for grandchildrenAmerican Indian / Alaska Native 8 56.9% Responsible for grandchildren6 43.1% Not responsible for grandchildrenOther race 26 57.4% Responsible for grandchildren19 42.6% Not responsible for grandchildrenTwo or more races 52 100.0% Responsible for grandchildrenWhite alone, not Hispanic / Latino 46 52.7% Responsible for grandchildren41 47.3% Not responsible for grandchildrenHispanic or Latino 27 67.5% Responsible for grandchildren13 32.5% Not responsible for grandchildrenGrandparents (60 years and over) White / Caucasian 52 31.0% Responsible for grandchildren115 69.0% Not responsible for grandchildrenBlack or African American 11 100.0% Responsible for grandchildrenTwo or more races 52 100.0% Not responsible for grandchildrenWhite alone, not Hispanic / Latino 52 30.1% Responsible for grandchildren120 69.9% Not responsible for grandchildrenHispanic or Latino 3 100.0% Not responsible for grandchildren