Races in Port Jefferson, New York (NY) Detailed Stats
Data:
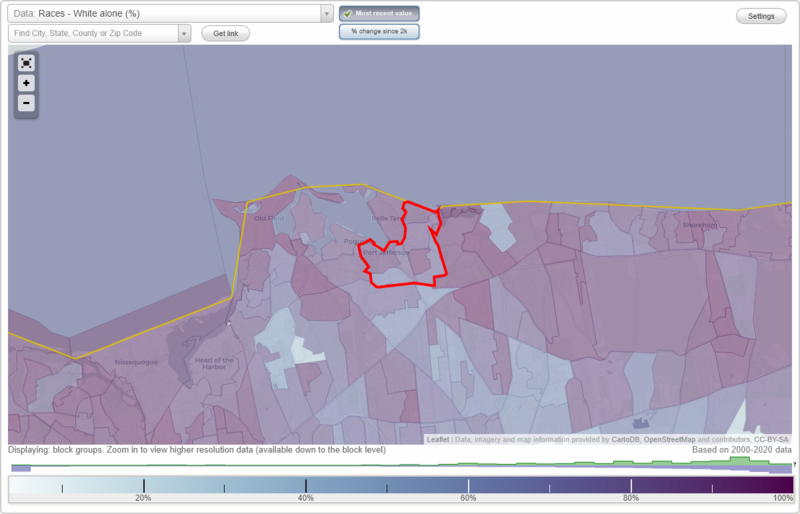
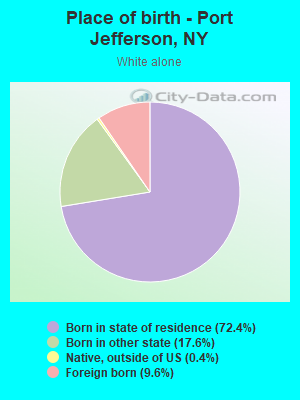
Races - White alone (%)
Races - White alone (% change since 2000)
Races - Black alone (%)
Races - Black alone (% change since 2000)
Races - American Indian alone (%)
Races - American Indian alone (% change since 2000)
Races - Asian alone (%)
Races - Asian alone (% change since 2000)
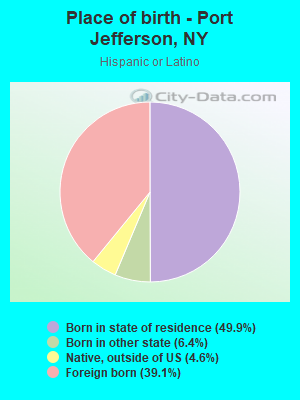
Races - Hispanic (%)
Races - Hispanic (% change since 2000)
Races - Native Hawaiian and Other Pacific Islander alone (%)
Races - Native Hawaiian and Other Pacific Islander alone (% change since 2000)
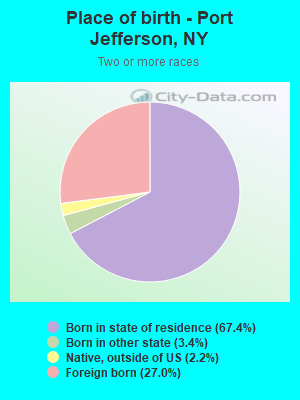
Races - Two or more races(%)
Races - Two or more races(% change since 2000)
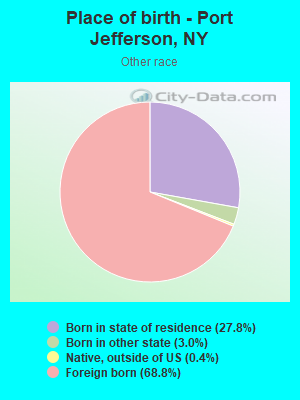
Races - Other race alone (%)
Races - Other race alone (% change since 2000)
Racial diversity
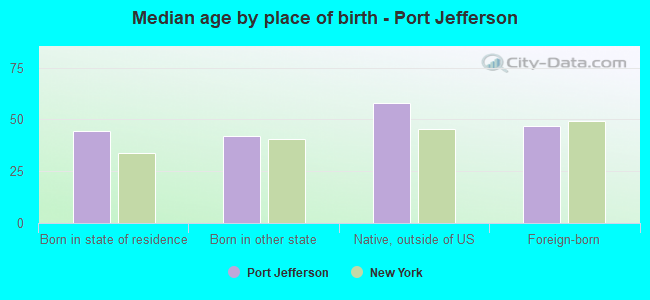
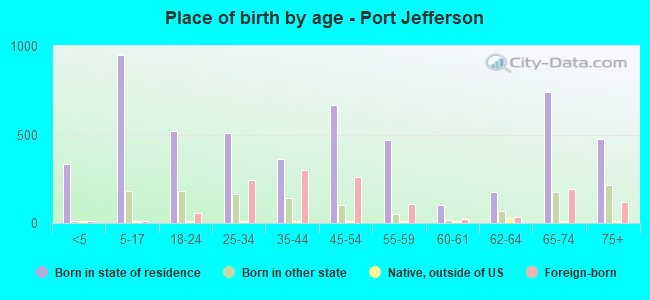
Place of birth - Born in state of residence (%)
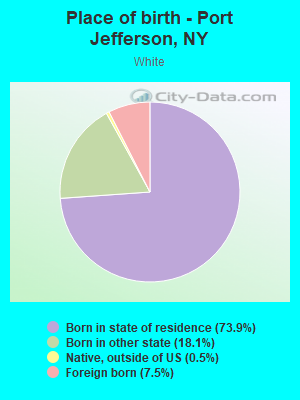
Place of birth - Born in state of residence (%) - White
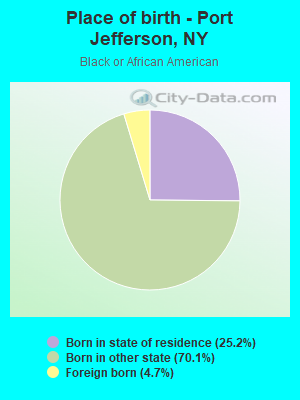
Place of birth - Born in state of residence (%) - Black or African American
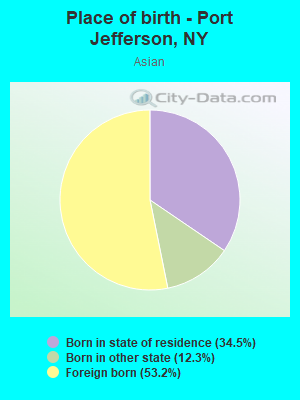
Place of birth - Born in state of residence (%) - Asian
Place of birth - Born in state of residence (%) - Hispanic or Latino
Place of birth - Born in state of residence (%) - American Indian and Alaska Native
Place of birth - Born in state of residence (%) - Multirace
Place of birth - Born in state of residence (%) - Other Race
Place of birth - Born in other state (%)
Place of birth - Born in other state (%) - White
Place of birth - Born in other state (%) - Black or African American
Place of birth - Born in other state (%) - Asian
Place of birth - Born in other state (%) - Hispanic or Latino
Place of birth - Born in other state (%) - American Indian and Alaska Native
Place of birth - Born in other state (%) - Multirace
Place of birth - Born in other state (%) - Other Race
Place of birth - Native, outside of US (%)
Place of birth - Native, outside of US (%) - White
Place of birth - Native, outside of US (%) - Black or African American
Place of birth - Native, outside of US (%) - Asian
Place of birth - Native, outside of US (%) - Hispanic or Latino
Place of birth - Native, outside of US (%) - American Indian and Alaska Native
Place of birth - Native, outside of US (%) - Multirace
Place of birth - Native, outside of US (%) - Other Race
Place of birth - Foreign born (%)
Place of birth - Foreign born (%) - White
Place of birth - Foreign born (%) - Black or African American
Place of birth - Foreign born (%) - Asian
Place of birth - Foreign born (%) - Hispanic or Latino
Place of birth - Foreign born (%) - American Indian and Alaska Native
Place of birth - Foreign born (%) - Multirace
Place of birth - Foreign born (%) - Other Race
Residents speaking English at home (%)
Residents speaking English at home - Born in the United States (%)
Residents speaking English at home - Native, born elsewhere (%)
Residents speaking English at home - Foreign born (%)
Residents speaking Spanish at home (%)
Residents speaking Spanish at home - Born in the United States (%)
Residents speaking Spanish at home - Native, born elsewhere (%)
Residents speaking Spanish at home - Foreign born (%)
Residents speaking other language at home (%)
Residents speaking other language at home - Born in the United States (%)
Residents speaking other language at home - Native, born elsewhere (%)
Residents speaking other language at home - Foreign born (%)
Marital status - Never married (%)
Marital status - Now married (%)
Marital status - Separated (%)
Marital status - Widowed (%)
Marital status - Divorced (%)
Ancestries Reported - Arab (%)
Ancestries Reported - Czech (%)
Ancestries Reported - Danish (%)
Ancestries Reported - Dutch (%)
Ancestries Reported - English (%)
Ancestries Reported - French (%)
Ancestries Reported - French Canadian (%)
Ancestries Reported - German (%)
Ancestries Reported - Greek (%)
Ancestries Reported - Hungarian (%)
Ancestries Reported - Irish (%)
Ancestries Reported - Italian (%)
Ancestries Reported - Lithuanian (%)
Ancestries Reported - Norwegian (%)
Ancestries Reported - Polish (%)
Ancestries Reported - Portuguese (%)
Ancestries Reported - Russian (%)
Ancestries Reported - Scotch-Irish (%)
Ancestries Reported - Scottish (%)
Ancestries Reported - Slovak (%)
Ancestries Reported - Subsaharan African (%)
Ancestries Reported - Swedish (%)
Ancestries Reported - Swiss (%)
Ancestries Reported - Ukrainian (%)
Ancestries Reported - United States (%)
Ancestries Reported - Welsh (%)
Ancestries Reported - West Indian (%)
Ancestries Reported - Other (%)
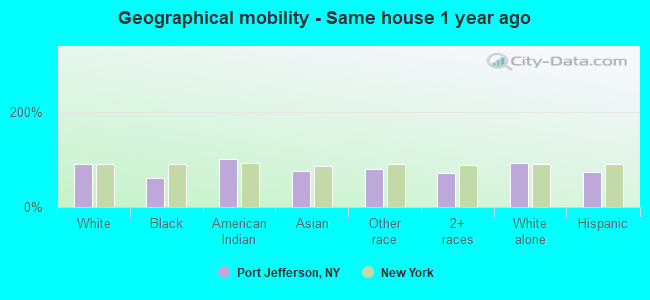
Geographical mobility - Same house 1 year ago (%)
Geographical mobility - Same house 1 year ago (%) - White
Geographical mobility - Same house 1 year ago (%) - Black or African American
Geographical mobility - Same house 1 year ago (%) - Asian
Geographical mobility - Same house 1 year ago (%) - Hispanic or Latino
Geographical mobility - Same house 1 year ago (%) - American Indian and Alaska Native
Geographical mobility - Same house 1 year ago (%) - Multirace
Geographical mobility - Same house 1 year ago (%) - Other Race
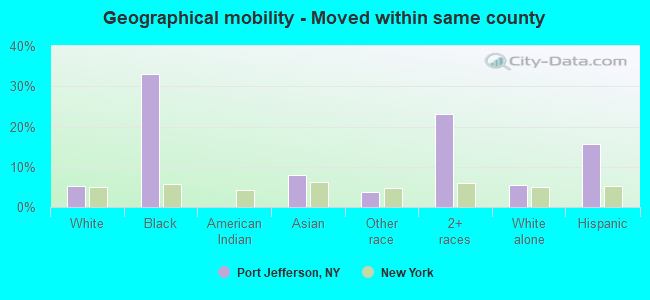
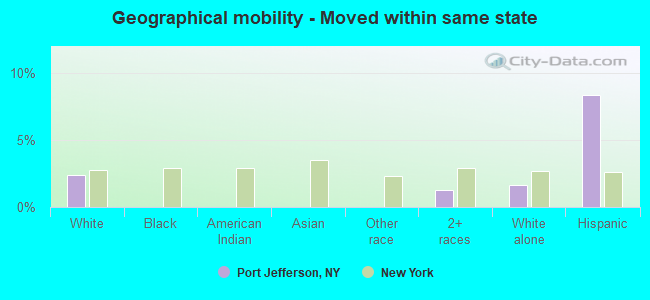
Geographical mobility - Moved within same county (%)
Geographical mobility - Moved within same county (%) - White
Geographical mobility - Moved within same county (%) - Black or African American
Geographical mobility - Moved within same county (%) - Asian
Geographical mobility - Moved within same county (%) - Hispanic or Latino
Geographical mobility - Moved within same county (%) - American Indian and Alaska Native
Geographical mobility - Moved within same county (%) - Multirace
Geographical mobility - Moved within same county (%) - Other Race
Geographical mobility - Moved from different county within same state (%)
Geographical mobility - Moved from different county within same state (%) - White
Geographical mobility - Moved from different county within same state (%) - Black or African American
Geographical mobility - Moved from different county within same state (%) - Asian
Geographical mobility - Moved from different county within same state (%) - Hispanic or Latino
Geographical mobility - Moved from different county within same state (%) - American Indian and Alaska Native
Geographical mobility - Moved from different county within same state (%) - Multirace
Geographical mobility - Moved from different county within same state (%) - Other Race
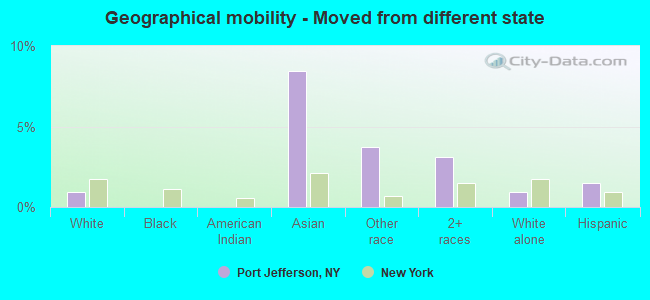
Geographical mobility - Moved from different state (%)
Geographical mobility - Moved from different state (%) - White
Geographical mobility - Moved from different state (%) - Black or African American
Geographical mobility - Moved from different state (%) - Asian
Geographical mobility - Moved from different state (%) - Hispanic or Latino
Geographical mobility - Moved from different state (%) - American Indian and Alaska Native
Geographical mobility - Moved from different state (%) - Multirace
Geographical mobility - Moved from different state (%) - Other Race
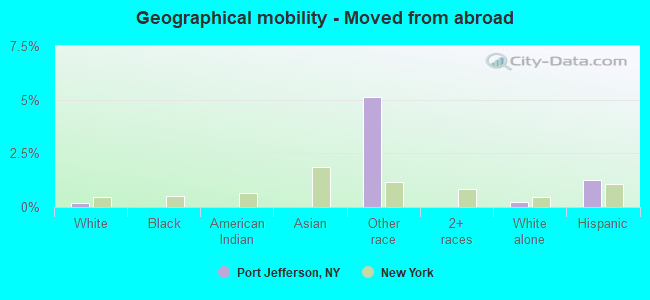
Geographical mobility - Moved from abroad (%)
Geographical mobility - Moved from abroad (%) - White
Geographical mobility - Moved from abroad (%) - Black or African American
Geographical mobility - Moved from abroad (%) - Asian
Geographical mobility - Moved from abroad (%) - Hispanic or Latino
Geographical mobility - Moved from abroad (%) - American Indian and Alaska Native
Geographical mobility - Moved from abroad (%) - Multirace
Geographical mobility - Moved from abroad (%) - Other Race
Place of birth for the foreign-born population - Ireland (%)
Place of birth for the foreign-born population - Denmark (%)
Place of birth for the foreign-born population - Norway (%)
Place of birth for the foreign-born population - Sweden (%)
Place of birth for the foreign-born population - United Kingdom (%)
Place of birth for the foreign-born population - England (%)
Place of birth for the foreign-born population - Scotland (%)
Place of birth for the foreign-born population - Other Northern Europe (%)
Place of birth for the foreign-born population - Austria (%)
Place of birth for the foreign-born population - Belgium (%)
Place of birth for the foreign-born population - France (%)
Place of birth for the foreign-born population - Germany (%)
Place of birth for the foreign-born population - Netherlands (%)
Place of birth for the foreign-born population - Switzerland (%)
Place of birth for the foreign-born population - Other Western Europe (%)
Place of birth for the foreign-born population - Greece (%)
Place of birth for the foreign-born population - Italy (%)
Place of birth for the foreign-born population - Portugal (%)
Place of birth for the foreign-born population - Spain (%)
Place of birth for the foreign-born population - Other Southern Europe (%)
Place of birth for the foreign-born population - Albania (%)
Place of birth for the foreign-born population - Belarus (%)
Place of birth for the foreign-born population - Bosnia and Herzegovina (%)
Place of birth for the foreign-born population - Bulgaria (%)
Place of birth for the foreign-born population - Croatia (%)
Place of birth for the foreign-born population - Czechoslovakia (%)
Place of birth for the foreign-born population - Hungary (%)
Place of birth for the foreign-born population - Latvia (%)
Place of birth for the foreign-born population - Lithuania (%)
Place of birth for the foreign-born population - North Macedonia (Macedonia) (%)
Place of birth for the foreign-born population - Moldova (%)
Place of birth for the foreign-born population - Poland (%)
Place of birth for the foreign-born population - Romania (%)
Place of birth for the foreign-born population - Russia (%)
Place of birth for the foreign-born population - Serbia (%)
Place of birth for the foreign-born population - Ukraine (%)
Place of birth for the foreign-born population - Other Eastern Europe (%)
Place of birth for the foreign-born population - China (%)
Place of birth for the foreign-born population - Hong Kong (%)
Place of birth for the foreign-born population - Taiwan (%)
Place of birth for the foreign-born population - Japan (%)
Place of birth for the foreign-born population - Korea (%)
Place of birth for the foreign-born population - Other Eastern Asia (%)
Place of birth for the foreign-born population - Afghanistan (%)
Place of birth for the foreign-born population - Bangladesh (%)
Place of birth for the foreign-born population - India (%)
Place of birth for the foreign-born population - Iran (%)
Place of birth for the foreign-born population - Kazakhstan (%)
Place of birth for the foreign-born population - Nepal (%)
Place of birth for the foreign-born population - Pakistan (%)
Place of birth for the foreign-born population - Sri Lanka (%)
Place of birth for the foreign-born population - Uzbekistan (%)
Place of birth for the foreign-born population - Other South Central Asia (%)
Place of birth for the foreign-born population - Burma (%)
Place of birth for the foreign-born population - Cambodia (%)
Place of birth for the foreign-born population - Indonesia (%)
Place of birth for the foreign-born population - Laos (%)
Place of birth for the foreign-born population - Malaysia (%)
Place of birth for the foreign-born population - Philippines (%)
Place of birth for the foreign-born population - Singapore (%)
Place of birth for the foreign-born population - Thailand (%)
Place of birth for the foreign-born population - Vietnam (%)
Place of birth for the foreign-born population - Other South Eastern Asia (%)
Place of birth for the foreign-born population - Armenia (%)
Place of birth for the foreign-born population - Iraq (%)
Place of birth for the foreign-born population - Israel (%)
Place of birth for the foreign-born population - Jordan (%)
Place of birth for the foreign-born population - Kuwait (%)
Place of birth for the foreign-born population - Lebanon (%)
Place of birth for the foreign-born population - Saudi Arabia (%)
Place of birth for the foreign-born population - Syria (%)
Place of birth for the foreign-born population - Turkey (%)
Place of birth for the foreign-born population - Yemen (%)
Place of birth for the foreign-born population - Other Western Asia (%)
Place of birth for the foreign-born population - Eritrea (%)
Place of birth for the foreign-born population - Ethiopia (%)
Place of birth for the foreign-born population - Kenya (%)
Place of birth for the foreign-born population - Somalia (%)
Place of birth for the foreign-born population - Uganda (%)
Place of birth for the foreign-born population - Zimbabwe (%)
Place of birth for the foreign-born population - Other Eastern Africa (%)
Place of birth for the foreign-born population - Cameroon (%)
Place of birth for the foreign-born population - Congo (%)
Place of birth for the foreign-born population - Democratic Republic of Congo (Zaire) (%)
Place of birth for the foreign-born population - Other Middle Africa (%)
Place of birth for the foreign-born population - Egypt (%)
Place of birth for the foreign-born population - Morocco (%)
Place of birth for the foreign-born population - Sudan (%)
Place of birth for the foreign-born population - Other Northern Africa (%)
Place of birth for the foreign-born population - South Africa (%)
Place of birth for the foreign-born population - Other Southern Africa (%)
Place of birth for the foreign-born population - Cabo Verde (%)
Place of birth for the foreign-born population - Ghana (%)
Place of birth for the foreign-born population - Liberia (%)
Place of birth for the foreign-born population - Nigeria (%)
Place of birth for the foreign-born population - Senegal (%)
Place of birth for the foreign-born population - Sierra Leone (%)
Place of birth for the foreign-born population - Other Western Africa (%)
Place of birth for the foreign-born population - Australia (%)
Place of birth for the foreign-born population - New Zealand (%)
Place of birth for the foreign-born population - Fiji (%)
Place of birth for the foreign-born population - Micronesia (%)
Place of birth for the foreign-born population - Bahamas (%)
Place of birth for the foreign-born population - Barbados (%)
Place of birth for the foreign-born population - Cuba (%)
Place of birth for the foreign-born population - Dominica (%)
Place of birth for the foreign-born population - Dominican Republic (%)
Place of birth for the foreign-born population - Grenada (%)
Place of birth for the foreign-born population - Haiti (%)
Place of birth for the foreign-born population - Jamaica (%)
Place of birth for the foreign-born population - St. Vincent and the Grenadines (%)
Place of birth for the foreign-born population - Trinidad and Tobago (%)
Place of birth for the foreign-born population - West Indies (%)
Place of birth for the foreign-born population - Other Caribbean (%)
Place of birth for the foreign-born population - Belize (%)
Place of birth for the foreign-born population - Costa Rica (%)
Place of birth for the foreign-born population - El Salvador (%)
Place of birth for the foreign-born population - Guatemala (%)
Place of birth for the foreign-born population - Honduras (%)
Place of birth for the foreign-born population - Mexico (%)
Place of birth for the foreign-born population - Nicaragua (%)
Place of birth for the foreign-born population - Panama (%)
Place of birth for the foreign-born population - Other Central America (%)
Place of birth for the foreign-born population - Argentina (%)
Place of birth for the foreign-born population - Bolivia (%)
Place of birth for the foreign-born population - Brazil (%)
Place of birth for the foreign-born population - Chile (%)
Place of birth for the foreign-born population - Colombia (%)
Place of birth for the foreign-born population - Ecuador (%)
Place of birth for the foreign-born population - Guyana (%)
Place of birth for the foreign-born population - Peru (%)
Place of birth for the foreign-born population - Uruguay (%)
Place of birth for the foreign-born population - Venezuela (%)
Place of birth for the foreign-born population - Other South America (%)
Place of birth for the foreign-born population - Canada (%)
Place of birth for the foreign-born population - Other Northern America (%)
Place of birth for the foreign-born population - Other (%)
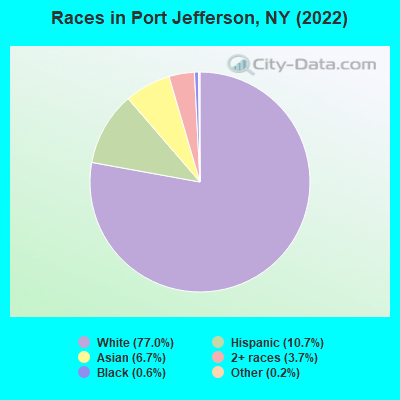
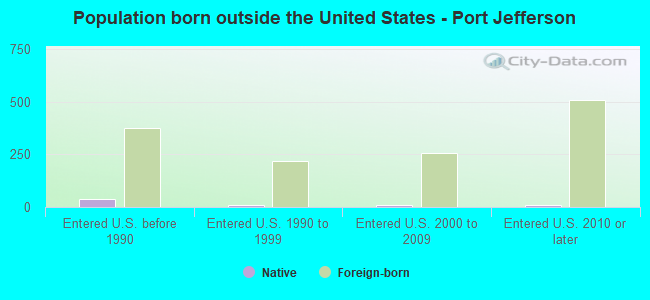
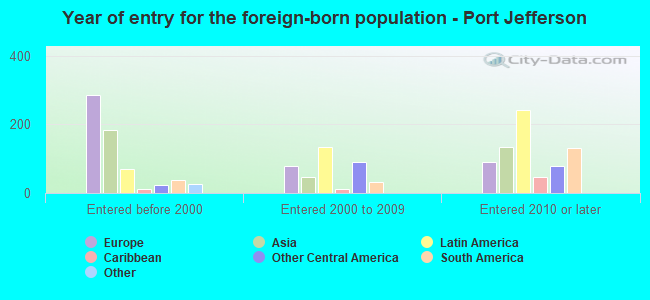
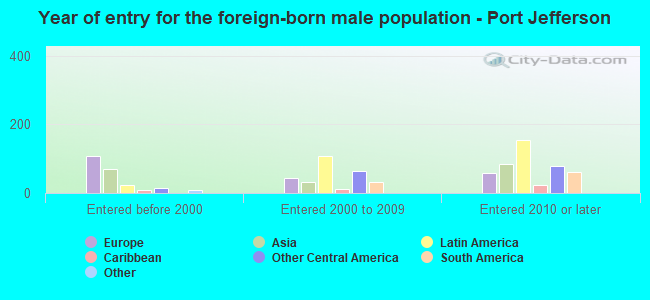
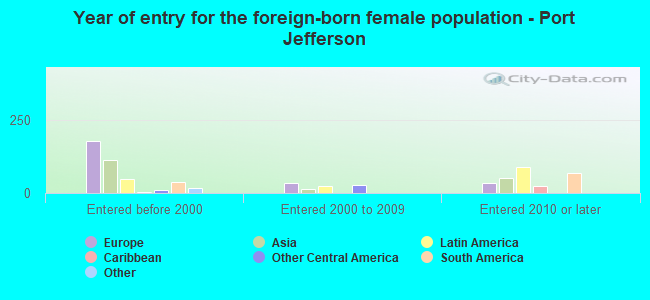
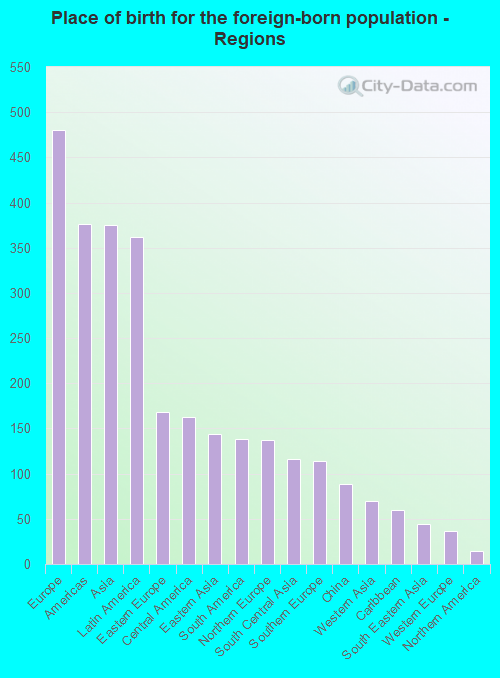
According to 2022 data, the most numerous races in Port Jefferson, NY are White alone (6,159 residents), Hispanic (859 residents), and Black alone (48 residents). 79.7% of Port Jefferson residents speak English at home. 15.4% of Port Jefferson, NY residents are foreign-born (6.1% born in Europe, 4.8% born in Asia, 4.6% born in Latin America), which is 42.7% less than the foreign-born rate of 22.0% across the entire state of New York.
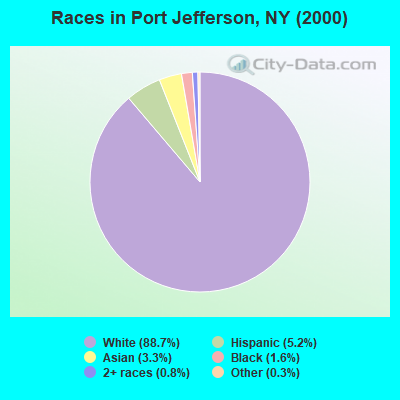
Race distribution in Port Jefferson
2000 2022
11,760,981 62.0% White alone 2,867,583 15.1% Hispanic 2,812,623 14.8% Black alone 1,035,926 5.5% Asian alone 366,116 1.9% Two or more races 75,499 0.4% Other race alone 52,499 0.3% American Indian alone 5,230 0.03% Native Hawaiian and Other
10,408,933 52.9% White alone 3,867,299 19.7% Hispanic 2,633,840 13.4% Black alone 1,776,286 9.0% Asian alone 732,670 3.7% Two or more races 216,110 1.1% Other race alone 35,082 0.2% American Indian alone 6,931 0.04% Native Hawaiian and Other
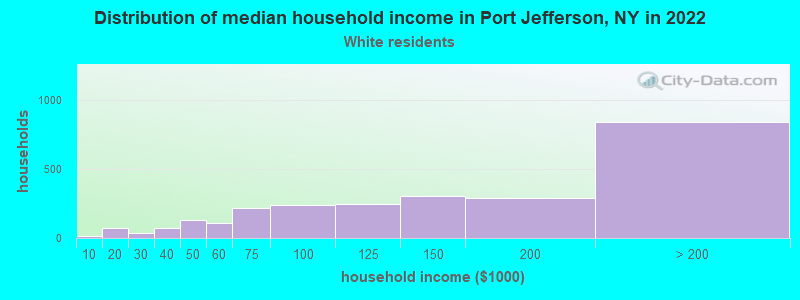
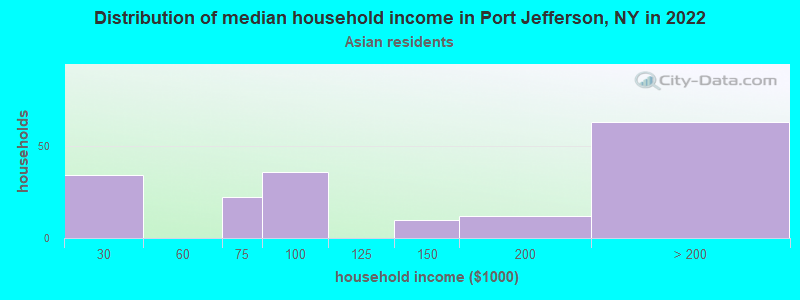
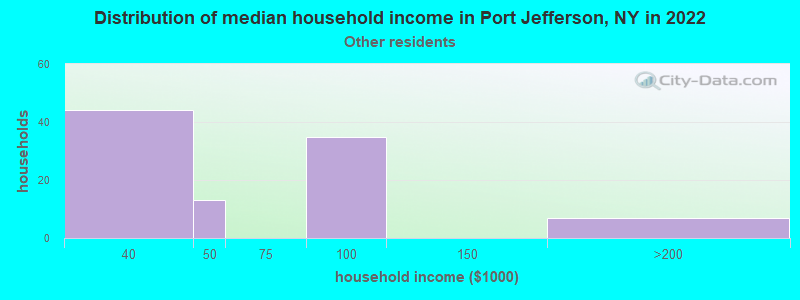
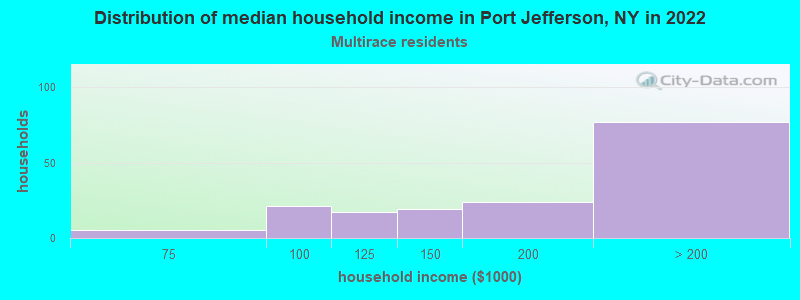
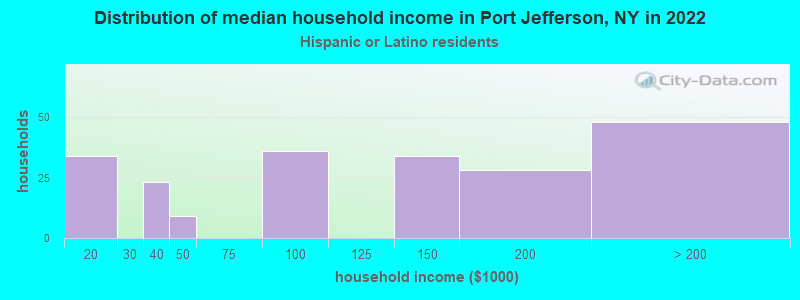
Income and house value in Port Jefferson Median household income in 2022 $136,095 White non-Hispanic householdersover $200,000 Two or more races householders$121,805 Hispanic or Latino race householdersMedian 2022 house value $677,279 White Non-Hispanic householders$505,131 Black or African American householders over $1,000,000 Asian householders$606,157 Hispanic or Latino householders
Median age by race in Port Jefferson
50.5 Median age for White residents47.2 52.0 55.4 Median age for Black or African American residents-660,784,313.1 46.4 -748,832,865.7 Median age for American Indian / Alaska Native residents-807,017,543.1 -513,692,161.9 31.3 Median age for Asian residents27.2 40.1 -742,816,091.2 Median age for Native Hawaiian / Pacific Islander residents-831,187,409.8 -771,300,447.7 30.6 Median age for Other race residents38.9 23.8 36.3 Median age for Two or more races residents31.9 38.2 50.0 Median age for White alone residents46.7 51.4 33.6 Median age for Hispanic or Latino residents40.2 21.8
Owner/renter occupied households by race in Port Jefferson
House owners and renters - White residents 1,923 74.9% Owner occupied645 25.1% Renter occupiedHouse owners and renters - Black or African American residents 15 100.0% Renter occupiedHouse owners and renters - American Indian / Alaska Native residents 14 100.0% Renter occupiedHouse owners and renters - Asian residents 109 61.5% Owner occupied69 38.5% Renter occupiedHouse owners and renters - Other race residents 5 4.5% Owner occupied107 95.5% Renter occupiedHouse owners and renters - Two or more races residents 116 72.1% Owner occupied45 27.9% Renter occupiedHouse owners and renters - White alone residents 1,967 75.2% Owner occupied649 24.8% Renter occupiedHouse owners and renters - Hispanic or Latino residents 82 36.2% Owner occupied145 63.8% Renter occupied
Language usage in Port Jefferson
English speakers - Total 79.7% of residents of Port Jefferson speak English at home.
7.6% of residents speak Spanish at home 384 66.2% Speak English very well196 33.8% Speak English less than very well12.6% of residents speak other language at home 814 84.4% Speak English very well151 15.6% Speak English less than very well
English speakers - Born in the United States 97.6% of residents of Port Jefferson speak English at home.
3.2% of residents speak other language at home 39 95.1% Speak English very well2 4.9% Speak English less than very well
English speakers - Native, born elsewhere 24.6% of residents of Port Jefferson speak English at home.
52.3% of residents speak Spanish at home 9 26.5% Speak English very well25 73.5% Speak English less than very well18.5% of residents speak other language at home 12 100.0% Speak English very well
English speakers - Foreign-born 27.0% of residents of Port Jefferson speak English at home.
24.4% of residents speak Spanish at home 160 49.1% Speak English very well166 50.9% Speak English less than very well46.3% of residents speak other language at home 500 80.8% Speak English very well119 19.2% Speak English less than very well
White (Caucasian) - Speak only English Native:
94.9% (5,070)Foreign-born:
61.8% (279)
White (Caucasian) - Speak another language Native:
5.1% (272)Foreign-born:
48.0% (217)
Black or African American - Speak only English Native:
97.0% (45)Foreign-born:
100.0% (2)
Asian - Speak only English Native:
74.1% (200)Foreign-born:
9.8% (28)
Asian - Speak another language Native:
20.6% (56)Foreign-born:
91.3% (257)
Other race - Speak another language Native:
72.8% (77)Foreign-born:
100.0% (263)
Two or more races - Speak another language Native:
13.7% (58)Foreign-born:
100.0% (178)
White alone - Speak only English Native:
94.3% (5,065)Foreign-born:
44.5% (263)
White alone - Speak another language Native:
5.8% (314)Foreign-born:
55.5% (329)
Hispanic or Latino - Speak only English Native:
58.8% (254)Foreign-born:
12.8% (43)
Hispanic or Latino - Speak another language Native:
41.8% (180)Foreign-born:
86.7% (290)
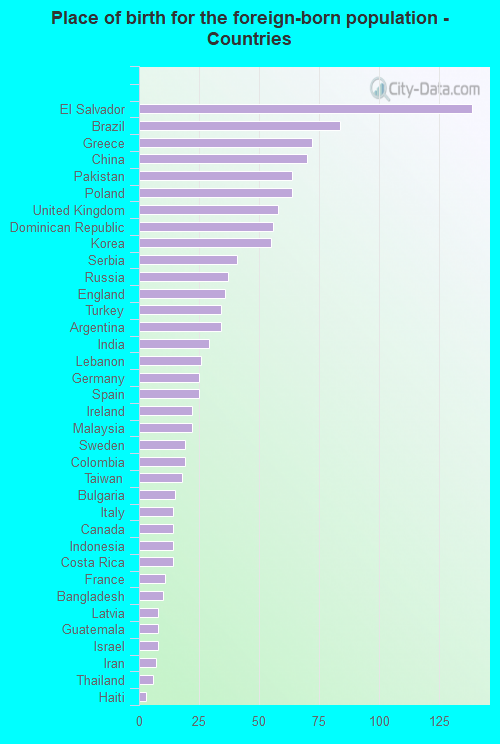
Foreign-born residents in Port Jefferson 1,233 residents are foreign born (6.1% Europe , 4.8% Asia , 4.6% Latin America ).
This city:
15.4%New York:
22.6%
Marital status for residents in Port Jefferson Marital status - White (Caucasian) population 15 years and over
Males 37.2% Never married51.4% Now married1.1% Separated2.1% Widowed8.2% DivorcedFemales 26.8% Never married49.1% Now married0.4% Separated11.3% Widowed12.4% DivorcedWomen who gave birth in the past 12 months Now married:
100.0% (54)Unmarried:
0.0% (0)
Women who did not give birth in the past 12 months Now married:
38.1% (394)Unmarried:
61.9% (640)
Marital status - Black or African American population 15 years and over
Males 67.9% Never married0.0% Now married0.0% Separated0.0% Widowed32.1% DivorcedFemales 9.5% Never married0.0% Now married0.0% Separated9.5% Widowed81.0% DivorcedWomen who did not give birth in the past 12 months Now married:
0.0% (0)Unmarried:
100.0% (14)
Marital status - Asian population 15 years and over
Males 42.7% Never married57.3% Now married0.0% Separated0.0% Widowed0.0% DivorcedFemales 23.9% Never married63.3% Now married0.0% Separated12.8% Widowed0.0% DivorcedWomen who did not give birth in the past 12 months Now married:
66.1% (87)Unmarried:
33.9% (45)
Marital status - Other race population 15 years and over
Males 78.5% Never married14.7% Now married0.0% Separated0.0% Widowed6.7% DivorcedFemales 85.9% Never married14.1% Now married0.0% Separated0.0% Widowed0.0% DivorcedWomen who did not give birth in the past 12 months Now married:
11.3% (10)Unmarried:
88.7% (80)
Marital status - Two or more races population 15 years and over
Males 42.0% Never married49.0% Now married8.9% Separated0.0% Widowed0.0% DivorcedFemales 29.9% Never married45.2% Now married12.4% Separated6.2% Widowed6.2% DivorcedWomen who gave birth in the past 12 months Now married:
100.0% (19)Unmarried:
0.0% (0)
Women who did not give birth in the past 12 months Now married:
50.8% (97)Unmarried:
49.2% (94)
Marital status - White alone, not Hispanic / Latino population 15 years and over
Males 36.3% Never married51.7% Now married1.2% Separated2.3% Widowed8.6% DivorcedFemales 27.1% Never married48.8% Now married0.4% Separated11.4% Widowed12.2% DivorcedWomen who gave birth in the past 12 months Now married:
100.0% (58)Unmarried:
0.0% (0)
Women who did not give birth in the past 12 months Now married:
37.2% (411)Unmarried:
62.8% (693)
Marital status - Hispanic or Latino population 15 years and over
Males 60.7% Never married33.4% Now married3.3% Separated0.0% Widowed2.6% DivorcedFemales 36.5% Never married32.9% Now married13.2% Separated5.4% Widowed12.0% DivorcedWomen who did not give birth in the past 12 months Now married:
47.4% (67)Unmarried:
52.6% (74)
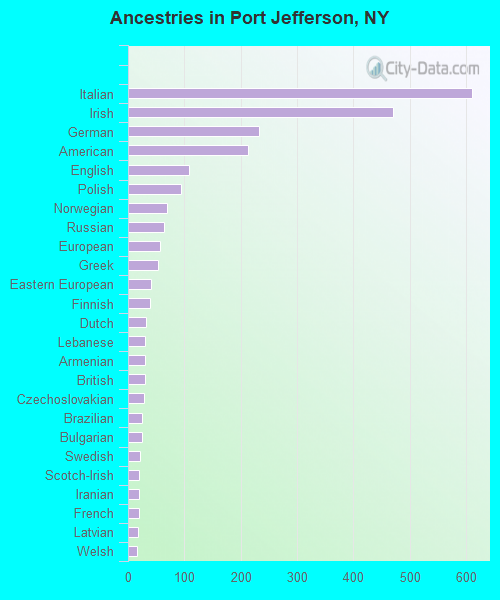
Ancestries in Port Jefferson
610 17.7% Italian470 13.6% Irish232 6.7% German213 6.2% American109 3.2% English94 2.7% Polish69 2.0% Norwegian64 1.9% Russian56 1.6% European54 1.6% Greek40 1.2% Eastern European39 1.1% Finnish32 0.9% Dutch30 0.9% Lebanese30 0.9% Armenian30 0.9% British28 0.8% Czechoslovakian25 0.7% Brazilian24 0.7% Bulgarian21 0.6% Swedish20 0.6% Scotch-Irish20 0.6% Iranian19 0.6% French18 0.5% Latvian16 0.5% Welsh11 0.3% Serbian9 0.3% Ukrainian8 0.2% Slovak7 0.2% Lithuanian7 0.2% Arab7 0.2% Celtic5 0.1% Palestinian5 0.1% Scandinavian4 0.1% Scottish2 0.06% Portuguese2 0.06% Haitian
Children Nativity (place of birth) in Port Jefferson
Children under 6 years - Living with two parents Both parents native 250 100.0% NativeBoth parents foreign-born 58 100.0% NativeOne native, one foreign-born parent 64 100.0% NativeChildren under 6 years - Living with one parent Native parent 44 100.0% NativeChildren 6 to 17 years - Living with two parents Both parents native 438 100.0% Native0 0.0% Foreign-bornBoth parents foreign-born 188 97.1% Native6 2.9% Foreign-bornOne native, one foreign-born parent 84 100.0% NativeChildren 6 to 17 years - Living with one parent Native parent 129 100.0% NativeForeign-born parent 139 51.5% Native131 48.5% Foreign-born
Grandparents responsible for own grandchildren in Port Jefferson
Grandparents (30 to 59 years) White / Caucasian 7 100.0% Not responsible for grandchildrenWhite alone, not Hispanic / Latino 8 100.0% Not responsible for grandchildrenGrandparents (60 years and over) White / Caucasian 7 17.5% Responsible for grandchildren33 82.5% Not responsible for grandchildrenWhite alone, not Hispanic / Latino 9 19.1% Responsible for grandchildren36 80.9% Not responsible for grandchildren