Races in Port Jefferson Station, New York (NY) Detailed Stats
Data:
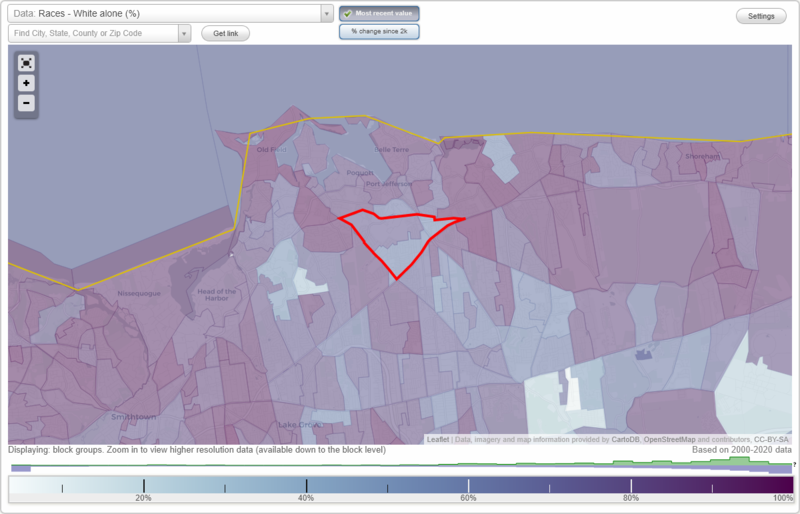
Races - White alone (%)
Races - White alone (% change since 2000)
Races - Black alone (%)
Races - Black alone (% change since 2000)
Races - American Indian alone (%)
Races - American Indian alone (% change since 2000)
Races - Asian alone (%)
Races - Asian alone (% change since 2000)
Races - Hispanic (%)
Races - Hispanic (% change since 2000)
Races - Native Hawaiian and Other Pacific Islander alone (%)
Races - Native Hawaiian and Other Pacific Islander alone (% change since 2000)
Races - Two or more races(%)
Races - Two or more races(% change since 2000)
Races - Other race alone (%)
Races - Other race alone (% change since 2000)
Racial diversity
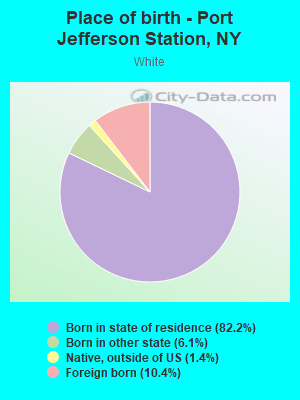
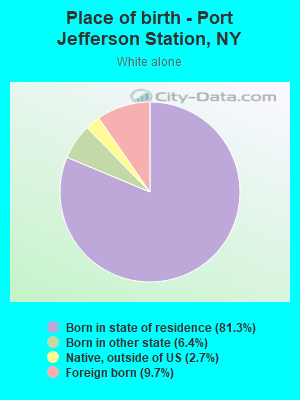
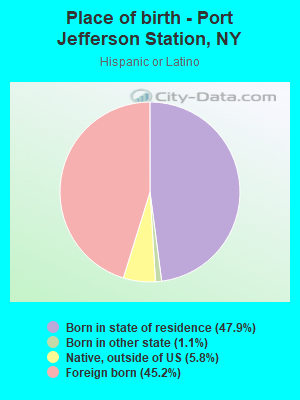
Place of birth - Born in state of residence (%)
Place of birth - Born in state of residence (%) - White
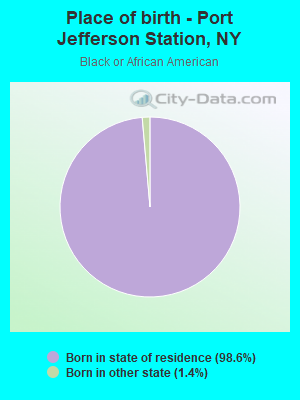
Place of birth - Born in state of residence (%) - Black or African American
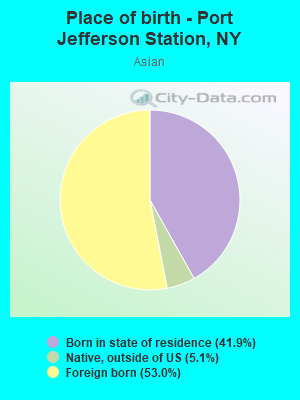
Place of birth - Born in state of residence (%) - Asian
Place of birth - Born in state of residence (%) - Hispanic or Latino
Place of birth - Born in state of residence (%) - American Indian and Alaska Native
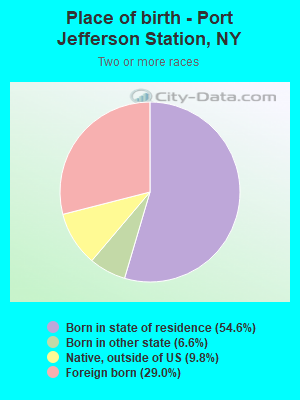
Place of birth - Born in state of residence (%) - Multirace
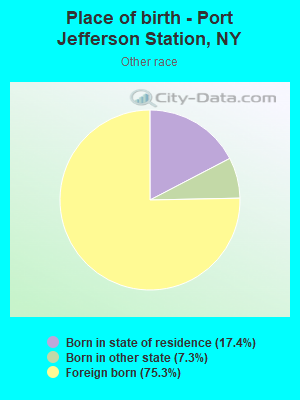
Place of birth - Born in state of residence (%) - Other Race
Place of birth - Born in other state (%)
Place of birth - Born in other state (%) - White
Place of birth - Born in other state (%) - Black or African American
Place of birth - Born in other state (%) - Asian
Place of birth - Born in other state (%) - Hispanic or Latino
Place of birth - Born in other state (%) - American Indian and Alaska Native
Place of birth - Born in other state (%) - Multirace
Place of birth - Born in other state (%) - Other Race
Place of birth - Native, outside of US (%)
Place of birth - Native, outside of US (%) - White
Place of birth - Native, outside of US (%) - Black or African American
Place of birth - Native, outside of US (%) - Asian
Place of birth - Native, outside of US (%) - Hispanic or Latino
Place of birth - Native, outside of US (%) - American Indian and Alaska Native
Place of birth - Native, outside of US (%) - Multirace
Place of birth - Native, outside of US (%) - Other Race
Place of birth - Foreign born (%)
Place of birth - Foreign born (%) - White
Place of birth - Foreign born (%) - Black or African American
Place of birth - Foreign born (%) - Asian
Place of birth - Foreign born (%) - Hispanic or Latino
Place of birth - Foreign born (%) - American Indian and Alaska Native
Place of birth - Foreign born (%) - Multirace
Place of birth - Foreign born (%) - Other Race
Residents speaking English at home (%)
Residents speaking English at home - Born in the United States (%)
Residents speaking English at home - Native, born elsewhere (%)
Residents speaking English at home - Foreign born (%)
Residents speaking Spanish at home (%)
Residents speaking Spanish at home - Born in the United States (%)
Residents speaking Spanish at home - Native, born elsewhere (%)
Residents speaking Spanish at home - Foreign born (%)
Residents speaking other language at home (%)
Residents speaking other language at home - Born in the United States (%)
Residents speaking other language at home - Native, born elsewhere (%)
Residents speaking other language at home - Foreign born (%)
Marital status - Never married (%)
Marital status - Now married (%)
Marital status - Separated (%)
Marital status - Widowed (%)
Marital status - Divorced (%)
Ancestries Reported - Arab (%)
Ancestries Reported - Czech (%)
Ancestries Reported - Danish (%)
Ancestries Reported - Dutch (%)
Ancestries Reported - English (%)
Ancestries Reported - French (%)
Ancestries Reported - French Canadian (%)
Ancestries Reported - German (%)
Ancestries Reported - Greek (%)
Ancestries Reported - Hungarian (%)
Ancestries Reported - Irish (%)
Ancestries Reported - Italian (%)
Ancestries Reported - Lithuanian (%)
Ancestries Reported - Norwegian (%)
Ancestries Reported - Polish (%)
Ancestries Reported - Portuguese (%)
Ancestries Reported - Russian (%)
Ancestries Reported - Scotch-Irish (%)
Ancestries Reported - Scottish (%)
Ancestries Reported - Slovak (%)
Ancestries Reported - Subsaharan African (%)
Ancestries Reported - Swedish (%)
Ancestries Reported - Swiss (%)
Ancestries Reported - Ukrainian (%)
Ancestries Reported - United States (%)
Ancestries Reported - Welsh (%)
Ancestries Reported - West Indian (%)
Ancestries Reported - Other (%)
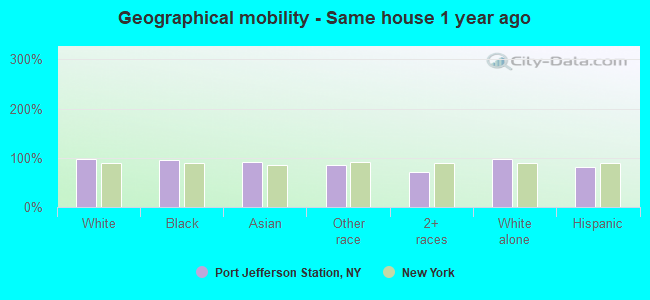
Geographical mobility - Same house 1 year ago (%)
Geographical mobility - Same house 1 year ago (%) - White
Geographical mobility - Same house 1 year ago (%) - Black or African American
Geographical mobility - Same house 1 year ago (%) - Asian
Geographical mobility - Same house 1 year ago (%) - Hispanic or Latino
Geographical mobility - Same house 1 year ago (%) - American Indian and Alaska Native
Geographical mobility - Same house 1 year ago (%) - Multirace
Geographical mobility - Same house 1 year ago (%) - Other Race
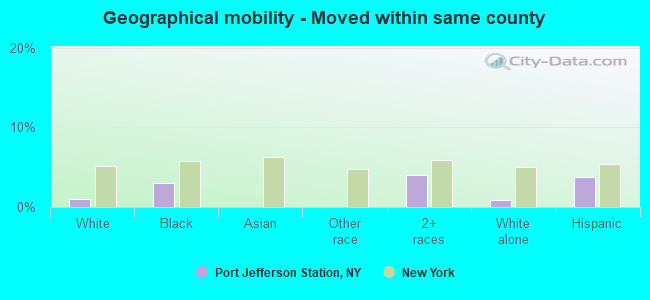
Geographical mobility - Moved within same county (%)
Geographical mobility - Moved within same county (%) - White
Geographical mobility - Moved within same county (%) - Black or African American
Geographical mobility - Moved within same county (%) - Asian
Geographical mobility - Moved within same county (%) - Hispanic or Latino
Geographical mobility - Moved within same county (%) - American Indian and Alaska Native
Geographical mobility - Moved within same county (%) - Multirace
Geographical mobility - Moved within same county (%) - Other Race
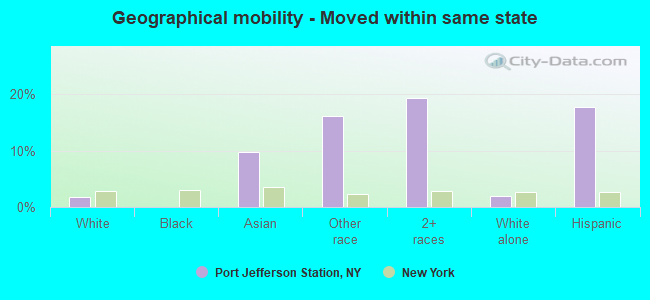
Geographical mobility - Moved from different county within same state (%)
Geographical mobility - Moved from different county within same state (%) - White
Geographical mobility - Moved from different county within same state (%) - Black or African American
Geographical mobility - Moved from different county within same state (%) - Asian
Geographical mobility - Moved from different county within same state (%) - Hispanic or Latino
Geographical mobility - Moved from different county within same state (%) - American Indian and Alaska Native
Geographical mobility - Moved from different county within same state (%) - Multirace
Geographical mobility - Moved from different county within same state (%) - Other Race
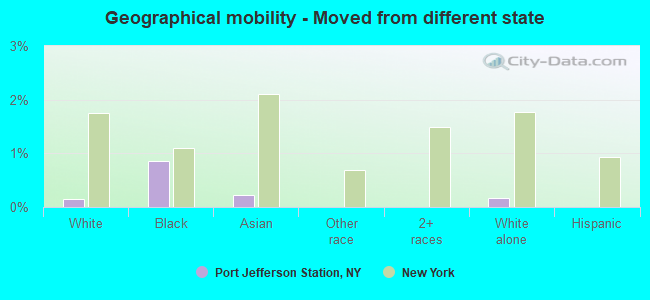
Geographical mobility - Moved from different state (%)
Geographical mobility - Moved from different state (%) - White
Geographical mobility - Moved from different state (%) - Black or African American
Geographical mobility - Moved from different state (%) - Asian
Geographical mobility - Moved from different state (%) - Hispanic or Latino
Geographical mobility - Moved from different state (%) - American Indian and Alaska Native
Geographical mobility - Moved from different state (%) - Multirace
Geographical mobility - Moved from different state (%) - Other Race
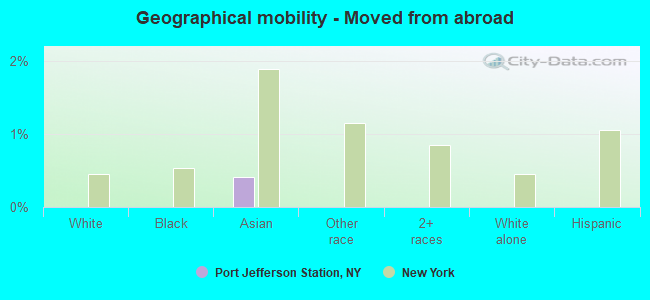
Geographical mobility - Moved from abroad (%)
Geographical mobility - Moved from abroad (%) - White
Geographical mobility - Moved from abroad (%) - Black or African American
Geographical mobility - Moved from abroad (%) - Asian
Geographical mobility - Moved from abroad (%) - Hispanic or Latino
Geographical mobility - Moved from abroad (%) - American Indian and Alaska Native
Geographical mobility - Moved from abroad (%) - Multirace
Geographical mobility - Moved from abroad (%) - Other Race
Place of birth for the foreign-born population - Ireland (%)
Place of birth for the foreign-born population - Denmark (%)
Place of birth for the foreign-born population - Norway (%)
Place of birth for the foreign-born population - Sweden (%)
Place of birth for the foreign-born population - United Kingdom (%)
Place of birth for the foreign-born population - England (%)
Place of birth for the foreign-born population - Scotland (%)
Place of birth for the foreign-born population - Other Northern Europe (%)
Place of birth for the foreign-born population - Austria (%)
Place of birth for the foreign-born population - Belgium (%)
Place of birth for the foreign-born population - France (%)
Place of birth for the foreign-born population - Germany (%)
Place of birth for the foreign-born population - Netherlands (%)
Place of birth for the foreign-born population - Switzerland (%)
Place of birth for the foreign-born population - Other Western Europe (%)
Place of birth for the foreign-born population - Greece (%)
Place of birth for the foreign-born population - Italy (%)
Place of birth for the foreign-born population - Portugal (%)
Place of birth for the foreign-born population - Spain (%)
Place of birth for the foreign-born population - Other Southern Europe (%)
Place of birth for the foreign-born population - Albania (%)
Place of birth for the foreign-born population - Belarus (%)
Place of birth for the foreign-born population - Bosnia and Herzegovina (%)
Place of birth for the foreign-born population - Bulgaria (%)
Place of birth for the foreign-born population - Croatia (%)
Place of birth for the foreign-born population - Czechoslovakia (%)
Place of birth for the foreign-born population - Hungary (%)
Place of birth for the foreign-born population - Latvia (%)
Place of birth for the foreign-born population - Lithuania (%)
Place of birth for the foreign-born population - North Macedonia (Macedonia) (%)
Place of birth for the foreign-born population - Moldova (%)
Place of birth for the foreign-born population - Poland (%)
Place of birth for the foreign-born population - Romania (%)
Place of birth for the foreign-born population - Russia (%)
Place of birth for the foreign-born population - Serbia (%)
Place of birth for the foreign-born population - Ukraine (%)
Place of birth for the foreign-born population - Other Eastern Europe (%)
Place of birth for the foreign-born population - China (%)
Place of birth for the foreign-born population - Hong Kong (%)
Place of birth for the foreign-born population - Taiwan (%)
Place of birth for the foreign-born population - Japan (%)
Place of birth for the foreign-born population - Korea (%)
Place of birth for the foreign-born population - Other Eastern Asia (%)
Place of birth for the foreign-born population - Afghanistan (%)
Place of birth for the foreign-born population - Bangladesh (%)
Place of birth for the foreign-born population - India (%)
Place of birth for the foreign-born population - Iran (%)
Place of birth for the foreign-born population - Kazakhstan (%)
Place of birth for the foreign-born population - Nepal (%)
Place of birth for the foreign-born population - Pakistan (%)
Place of birth for the foreign-born population - Sri Lanka (%)
Place of birth for the foreign-born population - Uzbekistan (%)
Place of birth for the foreign-born population - Other South Central Asia (%)
Place of birth for the foreign-born population - Burma (%)
Place of birth for the foreign-born population - Cambodia (%)
Place of birth for the foreign-born population - Indonesia (%)
Place of birth for the foreign-born population - Laos (%)
Place of birth for the foreign-born population - Malaysia (%)
Place of birth for the foreign-born population - Philippines (%)
Place of birth for the foreign-born population - Singapore (%)
Place of birth for the foreign-born population - Thailand (%)
Place of birth for the foreign-born population - Vietnam (%)
Place of birth for the foreign-born population - Other South Eastern Asia (%)
Place of birth for the foreign-born population - Armenia (%)
Place of birth for the foreign-born population - Iraq (%)
Place of birth for the foreign-born population - Israel (%)
Place of birth for the foreign-born population - Jordan (%)
Place of birth for the foreign-born population - Kuwait (%)
Place of birth for the foreign-born population - Lebanon (%)
Place of birth for the foreign-born population - Saudi Arabia (%)
Place of birth for the foreign-born population - Syria (%)
Place of birth for the foreign-born population - Turkey (%)
Place of birth for the foreign-born population - Yemen (%)
Place of birth for the foreign-born population - Other Western Asia (%)
Place of birth for the foreign-born population - Eritrea (%)
Place of birth for the foreign-born population - Ethiopia (%)
Place of birth for the foreign-born population - Kenya (%)
Place of birth for the foreign-born population - Somalia (%)
Place of birth for the foreign-born population - Uganda (%)
Place of birth for the foreign-born population - Zimbabwe (%)
Place of birth for the foreign-born population - Other Eastern Africa (%)
Place of birth for the foreign-born population - Cameroon (%)
Place of birth for the foreign-born population - Congo (%)
Place of birth for the foreign-born population - Democratic Republic of Congo (Zaire) (%)
Place of birth for the foreign-born population - Other Middle Africa (%)
Place of birth for the foreign-born population - Egypt (%)
Place of birth for the foreign-born population - Morocco (%)
Place of birth for the foreign-born population - Sudan (%)
Place of birth for the foreign-born population - Other Northern Africa (%)
Place of birth for the foreign-born population - South Africa (%)
Place of birth for the foreign-born population - Other Southern Africa (%)
Place of birth for the foreign-born population - Cabo Verde (%)
Place of birth for the foreign-born population - Ghana (%)
Place of birth for the foreign-born population - Liberia (%)
Place of birth for the foreign-born population - Nigeria (%)
Place of birth for the foreign-born population - Senegal (%)
Place of birth for the foreign-born population - Sierra Leone (%)
Place of birth for the foreign-born population - Other Western Africa (%)
Place of birth for the foreign-born population - Australia (%)
Place of birth for the foreign-born population - New Zealand (%)
Place of birth for the foreign-born population - Fiji (%)
Place of birth for the foreign-born population - Micronesia (%)
Place of birth for the foreign-born population - Bahamas (%)
Place of birth for the foreign-born population - Barbados (%)
Place of birth for the foreign-born population - Cuba (%)
Place of birth for the foreign-born population - Dominica (%)
Place of birth for the foreign-born population - Dominican Republic (%)
Place of birth for the foreign-born population - Grenada (%)
Place of birth for the foreign-born population - Haiti (%)
Place of birth for the foreign-born population - Jamaica (%)
Place of birth for the foreign-born population - St. Vincent and the Grenadines (%)
Place of birth for the foreign-born population - Trinidad and Tobago (%)
Place of birth for the foreign-born population - West Indies (%)
Place of birth for the foreign-born population - Other Caribbean (%)
Place of birth for the foreign-born population - Belize (%)
Place of birth for the foreign-born population - Costa Rica (%)
Place of birth for the foreign-born population - El Salvador (%)
Place of birth for the foreign-born population - Guatemala (%)
Place of birth for the foreign-born population - Honduras (%)
Place of birth for the foreign-born population - Mexico (%)
Place of birth for the foreign-born population - Nicaragua (%)
Place of birth for the foreign-born population - Panama (%)
Place of birth for the foreign-born population - Other Central America (%)
Place of birth for the foreign-born population - Argentina (%)
Place of birth for the foreign-born population - Bolivia (%)
Place of birth for the foreign-born population - Brazil (%)
Place of birth for the foreign-born population - Chile (%)
Place of birth for the foreign-born population - Colombia (%)
Place of birth for the foreign-born population - Ecuador (%)
Place of birth for the foreign-born population - Guyana (%)
Place of birth for the foreign-born population - Peru (%)
Place of birth for the foreign-born population - Uruguay (%)
Place of birth for the foreign-born population - Venezuela (%)
Place of birth for the foreign-born population - Other South America (%)
Place of birth for the foreign-born population - Canada (%)
Place of birth for the foreign-born population - Other Northern America (%)
Place of birth for the foreign-born population - Other (%)
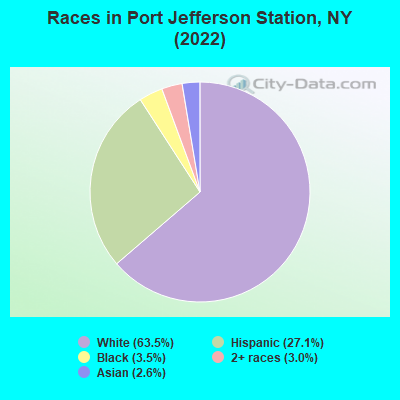
According to 2022 data, the most numerous races in Port Jefferson Station, NY are White alone (5,070 residents), Hispanic (2,165 residents), and Black alone (278 residents). 69.6% of Port Jefferson Station residents speak English at home. 18.6% of Port Jefferson Station, NY residents are foreign-born (10.9% born in Latin America, 4.8% born in Europe, 2.1% born in Asia), which is 18.3% less than the foreign-born rate of 22.0% across the entire state of New York.
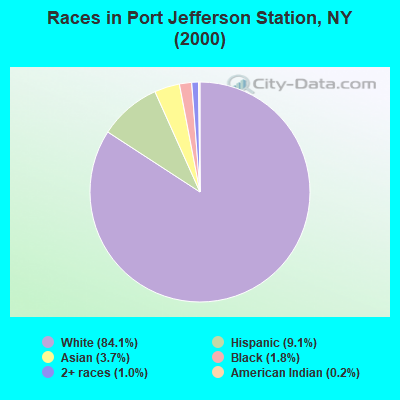
Race distribution in Port Jefferson Station
2000 2022
11,760,981 62.0% White alone 2,867,583 15.1% Hispanic 2,812,623 14.8% Black alone 1,035,926 5.5% Asian alone 366,116 1.9% Two or more races 75,499 0.4% Other race alone 52,499 0.3% American Indian alone 5,230 0.03% Native Hawaiian and Other
10,408,933 52.9% White alone 3,867,299 19.7% Hispanic 2,633,840 13.4% Black alone 1,776,286 9.0% Asian alone 732,670 3.7% Two or more races 216,110 1.1% Other race alone 35,082 0.2% American Indian alone 6,931 0.04% Native Hawaiian and Other
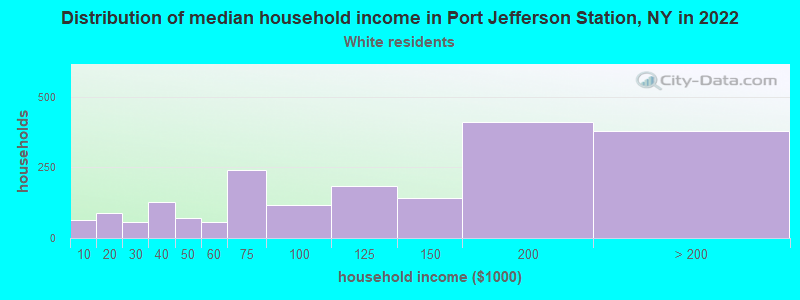
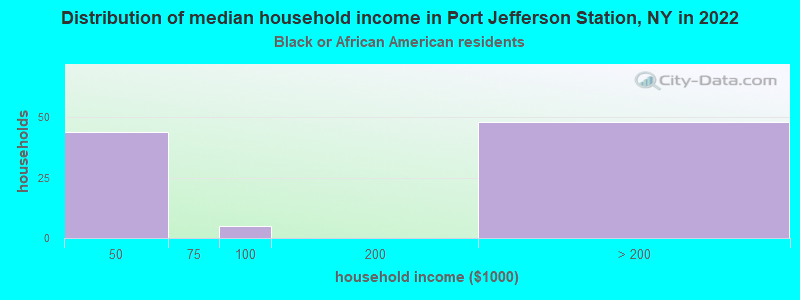
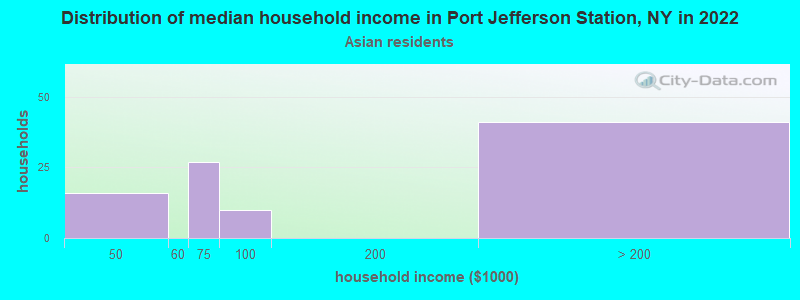
Income and house value in Port Jefferson Station Median household income in 2022 $123,028 White non-Hispanic householdersover $200,000 Black householders$123,996 Some other race householders$109,981 Two or more races householders$106,732 Hispanic or Latino race householdersMedian 2022 house value $489,348 White Non-Hispanic householders$630,764 Black or African American householders $669,700 Asian householders$384,999 Some other race householders$415,214 Two or more races householders$560,990 Hispanic or Latino householders
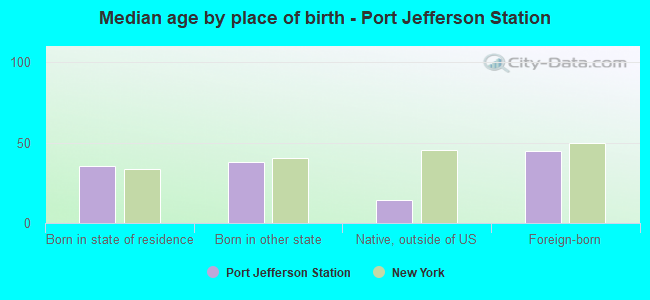
Median age by race in Port Jefferson Station
46.3 Median age for White residents53.0 42.3 48.4 Median age for Black or African American residents42.5 49.9 -748,832,865.7 Median age for American Indian / Alaska Native residents-807,017,543.1 -513,692,161.9 33.0 Median age for Asian residents26.2 33.8 -742,816,091.2 Median age for Native Hawaiian / Pacific Islander residents-831,187,409.8 -771,300,447.7 30.3 Median age for Other race residents39.8 19.2 27.2 Median age for Two or more races residents25.2 31.1 46.4 Median age for White alone residents51.8 43.2 27.2 Median age for Hispanic or Latino residents31.2 21.7
Owner/renter occupied households by race in Port Jefferson Station
House owners and renters - White residents 1,470 76.2% Owner occupied460 23.8% Renter occupiedHouse owners and renters - Black or African American residents 55 57.0% Owner occupied41 43.0% Renter occupiedHouse owners and renters - Asian residents 73 78.5% Owner occupied20 21.5% Renter occupiedHouse owners and renters - Other race residents 69 73.7% Owner occupied24 26.3% Renter occupiedHouse owners and renters - Two or more races residents 520 98.0% Owner occupied11 2.0% Renter occupiedHouse owners and renters - White alone residents 1,441 74.7% Owner occupied488 25.3% Renter occupiedHouse owners and renters - Hispanic or Latino residents 349 91.7% Owner occupied32 8.3% Renter occupied
Language usage in Port Jefferson Station
English speakers - Total 69.6% of residents of Port Jefferson Station speak English at home.
17.8% of residents speak Spanish at home 865 65.4% Speak English very well458 34.6% Speak English less than very well12.8% of residents speak other language at home 682 71.7% Speak English very well269 28.3% Speak English less than very well
English speakers - Born in the United States 94.6% of residents of Port Jefferson Station speak English at home.
2.7% of residents speak Spanish at home 12 100.0% Speak English very well3.8% of residents speak other language at home 17 100.0% Speak English less than very well
English speakers - Native, born elsewhere 81.6% of residents of Port Jefferson Station speak English at home.
13.5% of residents speak Spanish at home 36 100.0% Speak English very well13.2% of residents speak other language at home 29 82.9% Speak English very well6 17.1% Speak English less than very well
English speakers - Foreign-born 17.5% of residents of Port Jefferson Station speak English at home.
47.2% of residents speak Spanish at home 355 46.7% Speak English very well405 53.3% Speak English less than very well33.6% of residents speak other language at home 292 53.9% Speak English very well250 46.1% Speak English less than very well
White (Caucasian) - Speak only English Native:
92.7% (3,976)Foreign-born:
23.6% (127)
White (Caucasian) - Speak another language Native:
6.7% (288)Foreign-born:
74.6% (400)
Asian - Speak only English Native:
9.5% (11)Foreign-born:
8.1% (13)
Asian - Speak another language Native:
97.1% (109)Foreign-born:
94.2% (146)
Other race - Speak only English Native:
18.6% (17)Foreign-born:
2.3% (6)
Other race - Speak another language Native:
79.0% (71)Foreign-born:
98.9% (268)
Two or more races - Speak only English Native:
57.3% (698)Foreign-born:
26.8% (149)
Two or more races - Speak another language Native:
42.4% (516)Foreign-born:
71.2% (397)
White alone - Speak only English Native:
94.0% (4,015)Foreign-born:
7.1% (35)
White alone - Speak another language Native:
6.2% (264)Foreign-born:
92.8% (457)
Hispanic or Latino - Speak only English Native:
42.2% (418)Foreign-born:
20.3% (200)
Hispanic or Latino - Speak another language Native:
57.3% (568)Foreign-born:
78.4% (771)
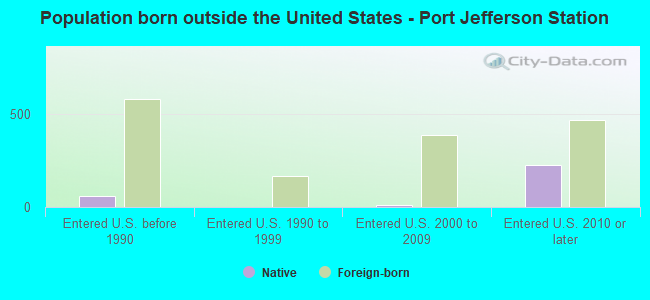
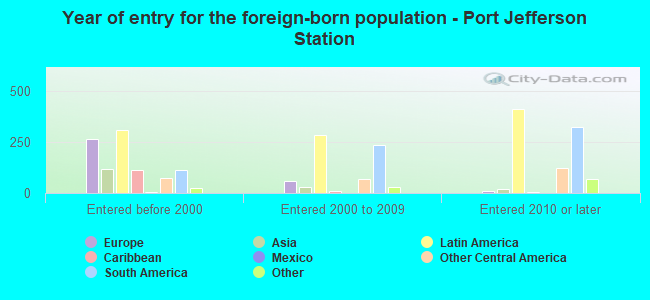
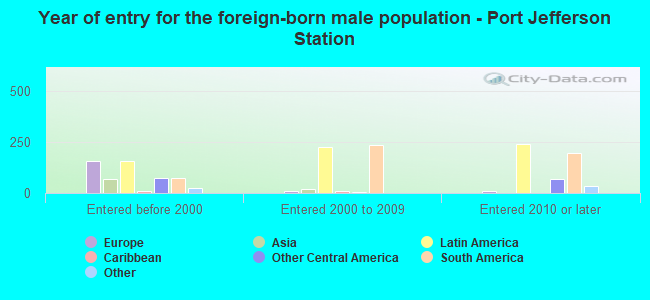
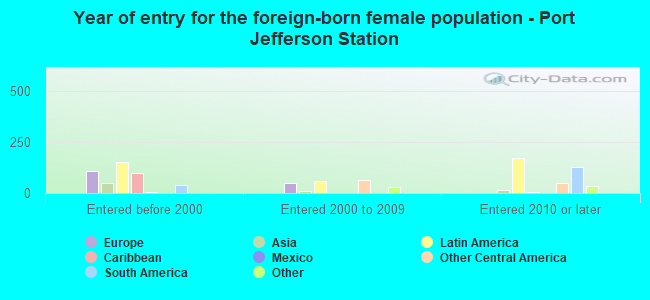
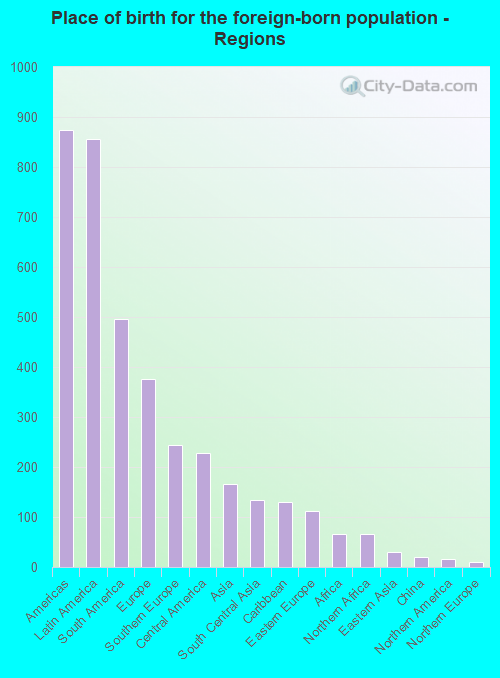
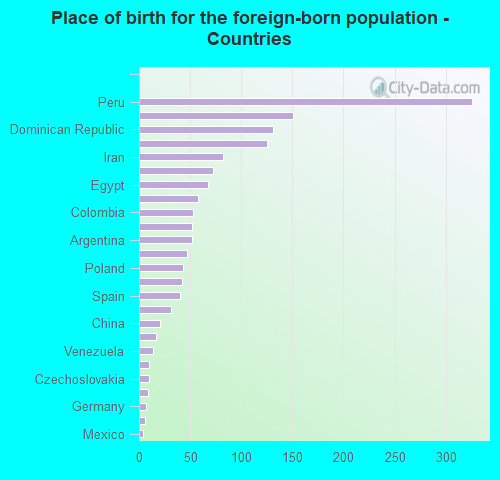
Foreign-born residents in Port Jefferson Station 1,484 residents are foreign born (10.9% Latin America , 4.8% Europe , 2.1% Asia ).
This city:
18.6%New York:
22.6%
Marital status for residents in Port Jefferson Station Marital status - White (Caucasian) population 15 years and over
Males 32.6% Never married63.2% Now married0.9% Separated1.1% Widowed2.2% DivorcedFemales 34.1% Never married51.7% Now married1.4% Separated6.0% Widowed6.9% DivorcedWomen who gave birth in the past 12 months Now married:
100.0% (16)Unmarried:
0.0% (0)
Women who did not give birth in the past 12 months Now married:
36.9% (432)Unmarried:
63.1% (738)
Marital status - Black or African American population 15 years and over
Males 35.5% Never married51.4% Now married9.3% Separated0.0% Widowed3.7% DivorcedFemales 37.1% Never married62.9% Now married0.0% Separated0.0% Widowed0.0% DivorcedWomen who did not give birth in the past 12 months Now married:
67.5% (56)Unmarried:
32.5% (27)
Marital status - Asian population 15 years and over
Males 21.3% Never married65.3% Now married0.0% Separated0.0% Widowed13.3% DivorcedFemales 25.6% Never married66.7% Now married0.0% Separated0.0% Widowed7.8% DivorcedWomen who gave birth in the past 12 months Now married:
100.0% (18)Unmarried:
0.0% (0)
Women who did not give birth in the past 12 months Now married:
50.6% (46)Unmarried:
49.4% (45)
Marital status - Other race population 15 years and over
Males 40.8% Never married53.3% Now married0.0% Separated0.0% Widowed5.9% DivorcedFemales 75.7% Never married17.6% Now married0.0% Separated0.0% Widowed6.8% DivorcedWomen who gave birth in the past 12 months Now married:
100.0% (3)Unmarried:
0.0% (0)
Women who did not give birth in the past 12 months Now married:
6.7% (6)Unmarried:
93.3% (82)
Marital status - Two or more races population 15 years and over
Males 34.3% Never married62.8% Now married0.0% Separated0.0% Widowed2.9% DivorcedFemales 36.0% Never married56.6% Now married0.0% Separated0.0% Widowed7.4% DivorcedWomen who did not give birth in the past 12 months Now married:
60.5% (410)Unmarried:
39.5% (268)
Marital status - White alone, not Hispanic / Latino population 15 years and over
Males 35.9% Never married60.4% Now married0.0% Separated1.2% Widowed2.5% DivorcedFemales 31.1% Never married53.1% Now married1.5% Separated6.6% Widowed7.6% DivorcedWomen who gave birth in the past 12 months Now married:
100.0% (17)Unmarried:
0.0% (0)
Women who did not give birth in the past 12 months Now married:
41.2% (455)Unmarried:
58.8% (651)
Marital status - Hispanic or Latino population 15 years and over
Males 29.5% Never married67.0% Now married2.3% Separated0.0% Widowed1.2% DivorcedFemales 49.7% Never married44.7% Now married0.0% Separated0.0% Widowed5.5% DivorcedWomen who gave birth in the past 12 months Now married:
100.0% (2)Unmarried:
0.0% (0)
Women who did not give birth in the past 12 months Now married:
37.9% (250)Unmarried:
62.1% (410)
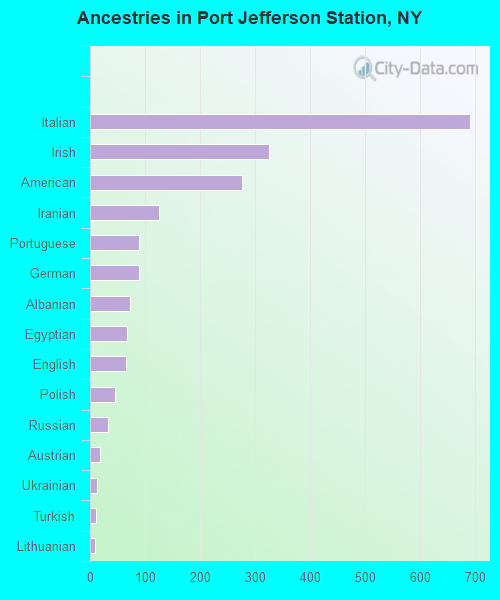
Ancestries in Port Jefferson Station
691 22.5% Italian325 10.6% Irish277 9.0% American125 4.1% Iranian90 2.9% Portuguese89 2.9% German73 2.4% Albanian68 2.2% Egyptian66 2.1% English46 1.5% Polish32 1.0% Russian18 0.6% Austrian13 0.4% Ukrainian11 0.4% Turkish10 0.3% Lithuanian2 0.07% Trinidadian and Tobagonian
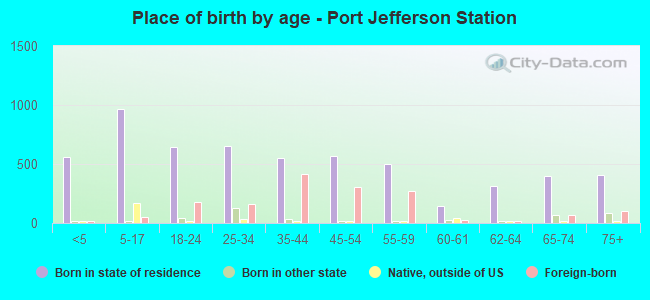
Children Nativity (place of birth) in Port Jefferson Station
Children under 6 years - Living with two parents Both parents native 305 100.0% NativeBoth parents foreign-born 105 100.0% NativeOne native, one foreign-born parent 106 100.0% NativeChildren under 6 years - Living with one parent Native parent 63 100.0% NativeChildren 6 to 17 years - Living with two parents Both parents native 379 100.0% Native0 0.0% Foreign-bornBoth parents foreign-born 195 87.3% Native28 12.7% Foreign-bornOne native, one foreign-born parent 275 100.0% NativeChildren 6 to 17 years - Living with one parent Native parent 187 100.0% NativeForeign-born parent 50 60.8% Native32 39.2% Foreign-born