Races in Port Reading, New Jersey (NJ) Detailed Stats
Data:
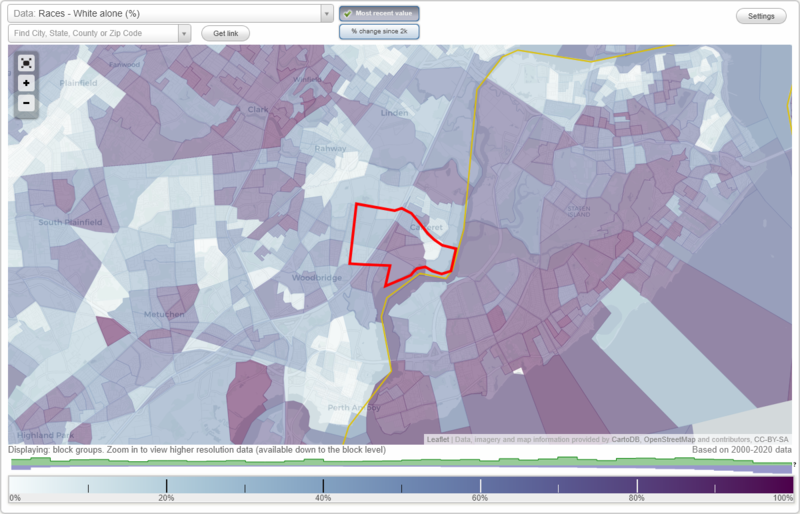
Races - White alone (%)
Races - White alone (% change since 2000)
Races - Black alone (%)
Races - Black alone (% change since 2000)
Races - American Indian alone (%)
Races - American Indian alone (% change since 2000)
Races - Asian alone (%)
Races - Asian alone (% change since 2000)
Races - Hispanic (%)
Races - Hispanic (% change since 2000)
Races - Native Hawaiian and Other Pacific Islander alone (%)
Races - Native Hawaiian and Other Pacific Islander alone (% change since 2000)
Races - Two or more races(%)
Races - Two or more races(% change since 2000)
Races - Other race alone (%)
Races - Other race alone (% change since 2000)
Racial diversity
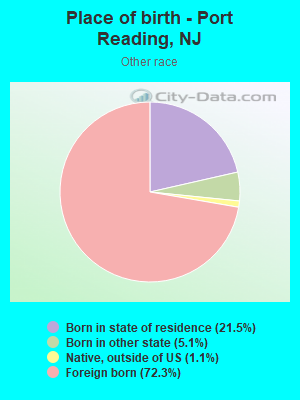
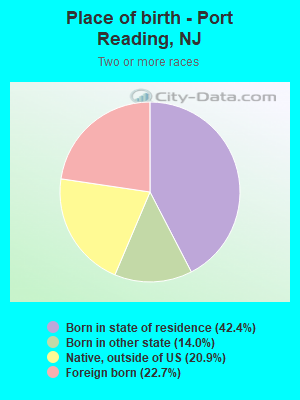
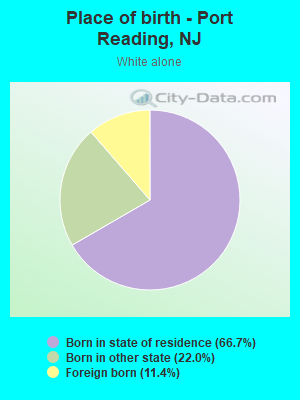
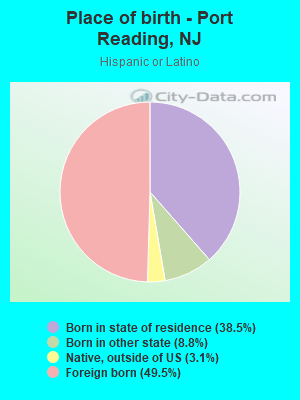
Place of birth - Born in state of residence (%)
Place of birth - Born in state of residence (%) - White
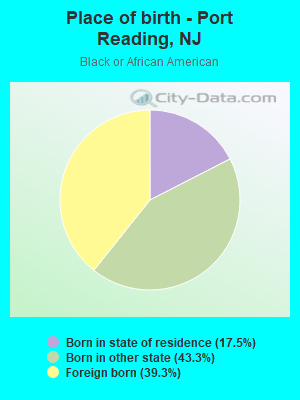
Place of birth - Born in state of residence (%) - Black or African American
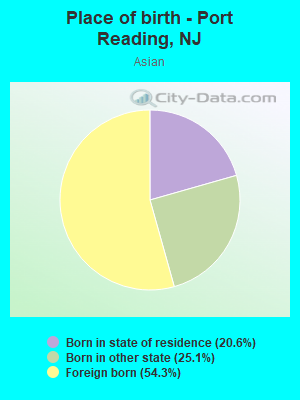
Place of birth - Born in state of residence (%) - Asian
Place of birth - Born in state of residence (%) - Hispanic or Latino
Place of birth - Born in state of residence (%) - American Indian and Alaska Native
Place of birth - Born in state of residence (%) - Multirace
Place of birth - Born in state of residence (%) - Other Race
Place of birth - Born in other state (%)
Place of birth - Born in other state (%) - White
Place of birth - Born in other state (%) - Black or African American
Place of birth - Born in other state (%) - Asian
Place of birth - Born in other state (%) - Hispanic or Latino
Place of birth - Born in other state (%) - American Indian and Alaska Native
Place of birth - Born in other state (%) - Multirace
Place of birth - Born in other state (%) - Other Race
Place of birth - Native, outside of US (%)
Place of birth - Native, outside of US (%) - White
Place of birth - Native, outside of US (%) - Black or African American
Place of birth - Native, outside of US (%) - Asian
Place of birth - Native, outside of US (%) - Hispanic or Latino
Place of birth - Native, outside of US (%) - American Indian and Alaska Native
Place of birth - Native, outside of US (%) - Multirace
Place of birth - Native, outside of US (%) - Other Race
Place of birth - Foreign born (%)
Place of birth - Foreign born (%) - White
Place of birth - Foreign born (%) - Black or African American
Place of birth - Foreign born (%) - Asian
Place of birth - Foreign born (%) - Hispanic or Latino
Place of birth - Foreign born (%) - American Indian and Alaska Native
Place of birth - Foreign born (%) - Multirace
Place of birth - Foreign born (%) - Other Race
Residents speaking English at home (%)
Residents speaking English at home - Born in the United States (%)
Residents speaking English at home - Native, born elsewhere (%)
Residents speaking English at home - Foreign born (%)
Residents speaking Spanish at home (%)
Residents speaking Spanish at home - Born in the United States (%)
Residents speaking Spanish at home - Native, born elsewhere (%)
Residents speaking Spanish at home - Foreign born (%)
Residents speaking other language at home (%)
Residents speaking other language at home - Born in the United States (%)
Residents speaking other language at home - Native, born elsewhere (%)
Residents speaking other language at home - Foreign born (%)
Marital status - Never married (%)
Marital status - Now married (%)
Marital status - Separated (%)
Marital status - Widowed (%)
Marital status - Divorced (%)
Ancestries Reported - Arab (%)
Ancestries Reported - Czech (%)
Ancestries Reported - Danish (%)
Ancestries Reported - Dutch (%)
Ancestries Reported - English (%)
Ancestries Reported - French (%)
Ancestries Reported - French Canadian (%)
Ancestries Reported - German (%)
Ancestries Reported - Greek (%)
Ancestries Reported - Hungarian (%)
Ancestries Reported - Irish (%)
Ancestries Reported - Italian (%)
Ancestries Reported - Lithuanian (%)
Ancestries Reported - Norwegian (%)
Ancestries Reported - Polish (%)
Ancestries Reported - Portuguese (%)
Ancestries Reported - Russian (%)
Ancestries Reported - Scotch-Irish (%)
Ancestries Reported - Scottish (%)
Ancestries Reported - Slovak (%)
Ancestries Reported - Subsaharan African (%)
Ancestries Reported - Swedish (%)
Ancestries Reported - Swiss (%)
Ancestries Reported - Ukrainian (%)
Ancestries Reported - United States (%)
Ancestries Reported - Welsh (%)
Ancestries Reported - West Indian (%)
Ancestries Reported - Other (%)
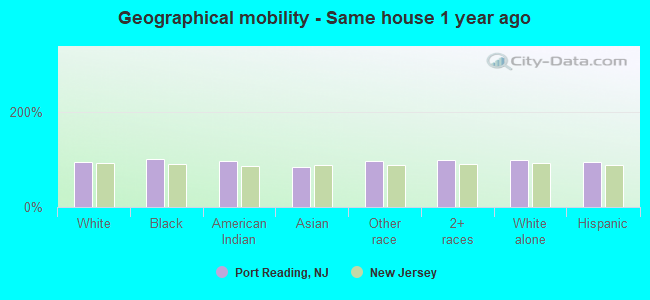
Geographical mobility - Same house 1 year ago (%)
Geographical mobility - Same house 1 year ago (%) - White
Geographical mobility - Same house 1 year ago (%) - Black or African American
Geographical mobility - Same house 1 year ago (%) - Asian
Geographical mobility - Same house 1 year ago (%) - Hispanic or Latino
Geographical mobility - Same house 1 year ago (%) - American Indian and Alaska Native
Geographical mobility - Same house 1 year ago (%) - Multirace
Geographical mobility - Same house 1 year ago (%) - Other Race
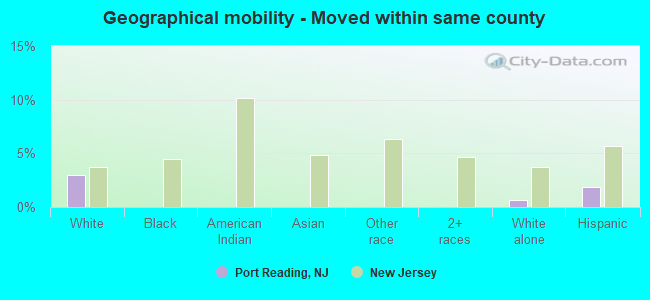
Geographical mobility - Moved within same county (%)
Geographical mobility - Moved within same county (%) - White
Geographical mobility - Moved within same county (%) - Black or African American
Geographical mobility - Moved within same county (%) - Asian
Geographical mobility - Moved within same county (%) - Hispanic or Latino
Geographical mobility - Moved within same county (%) - American Indian and Alaska Native
Geographical mobility - Moved within same county (%) - Multirace
Geographical mobility - Moved within same county (%) - Other Race
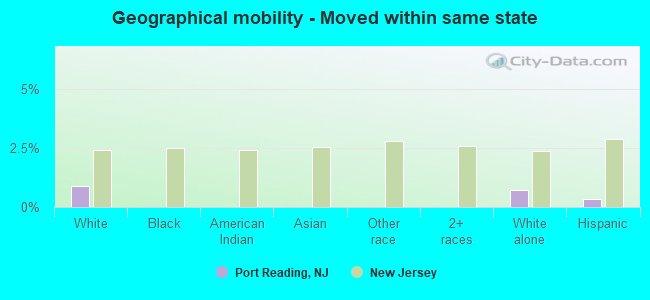
Geographical mobility - Moved from different county within same state (%)
Geographical mobility - Moved from different county within same state (%) - White
Geographical mobility - Moved from different county within same state (%) - Black or African American
Geographical mobility - Moved from different county within same state (%) - Asian
Geographical mobility - Moved from different county within same state (%) - Hispanic or Latino
Geographical mobility - Moved from different county within same state (%) - American Indian and Alaska Native
Geographical mobility - Moved from different county within same state (%) - Multirace
Geographical mobility - Moved from different county within same state (%) - Other Race
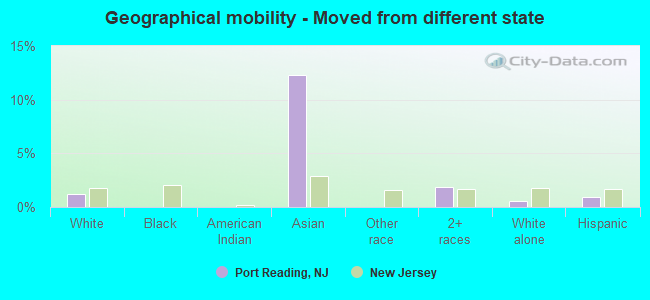
Geographical mobility - Moved from different state (%)
Geographical mobility - Moved from different state (%) - White
Geographical mobility - Moved from different state (%) - Black or African American
Geographical mobility - Moved from different state (%) - Asian
Geographical mobility - Moved from different state (%) - Hispanic or Latino
Geographical mobility - Moved from different state (%) - American Indian and Alaska Native
Geographical mobility - Moved from different state (%) - Multirace
Geographical mobility - Moved from different state (%) - Other Race
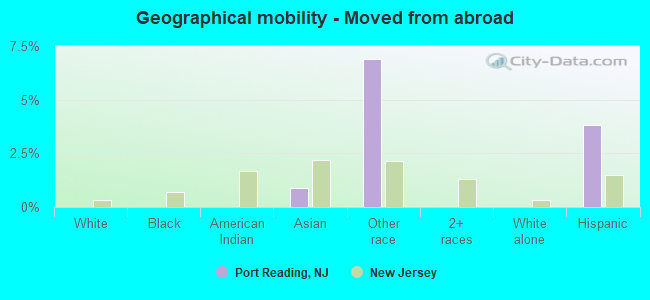
Geographical mobility - Moved from abroad (%)
Geographical mobility - Moved from abroad (%) - White
Geographical mobility - Moved from abroad (%) - Black or African American
Geographical mobility - Moved from abroad (%) - Asian
Geographical mobility - Moved from abroad (%) - Hispanic or Latino
Geographical mobility - Moved from abroad (%) - American Indian and Alaska Native
Geographical mobility - Moved from abroad (%) - Multirace
Geographical mobility - Moved from abroad (%) - Other Race
Place of birth for the foreign-born population - Ireland (%)
Place of birth for the foreign-born population - Denmark (%)
Place of birth for the foreign-born population - Norway (%)
Place of birth for the foreign-born population - Sweden (%)
Place of birth for the foreign-born population - United Kingdom (%)
Place of birth for the foreign-born population - England (%)
Place of birth for the foreign-born population - Scotland (%)
Place of birth for the foreign-born population - Other Northern Europe (%)
Place of birth for the foreign-born population - Austria (%)
Place of birth for the foreign-born population - Belgium (%)
Place of birth for the foreign-born population - France (%)
Place of birth for the foreign-born population - Germany (%)
Place of birth for the foreign-born population - Netherlands (%)
Place of birth for the foreign-born population - Switzerland (%)
Place of birth for the foreign-born population - Other Western Europe (%)
Place of birth for the foreign-born population - Greece (%)
Place of birth for the foreign-born population - Italy (%)
Place of birth for the foreign-born population - Portugal (%)
Place of birth for the foreign-born population - Spain (%)
Place of birth for the foreign-born population - Other Southern Europe (%)
Place of birth for the foreign-born population - Albania (%)
Place of birth for the foreign-born population - Belarus (%)
Place of birth for the foreign-born population - Bosnia and Herzegovina (%)
Place of birth for the foreign-born population - Bulgaria (%)
Place of birth for the foreign-born population - Croatia (%)
Place of birth for the foreign-born population - Czechoslovakia (%)
Place of birth for the foreign-born population - Hungary (%)
Place of birth for the foreign-born population - Latvia (%)
Place of birth for the foreign-born population - Lithuania (%)
Place of birth for the foreign-born population - North Macedonia (Macedonia) (%)
Place of birth for the foreign-born population - Moldova (%)
Place of birth for the foreign-born population - Poland (%)
Place of birth for the foreign-born population - Romania (%)
Place of birth for the foreign-born population - Russia (%)
Place of birth for the foreign-born population - Serbia (%)
Place of birth for the foreign-born population - Ukraine (%)
Place of birth for the foreign-born population - Other Eastern Europe (%)
Place of birth for the foreign-born population - China (%)
Place of birth for the foreign-born population - Hong Kong (%)
Place of birth for the foreign-born population - Taiwan (%)
Place of birth for the foreign-born population - Japan (%)
Place of birth for the foreign-born population - Korea (%)
Place of birth for the foreign-born population - Other Eastern Asia (%)
Place of birth for the foreign-born population - Afghanistan (%)
Place of birth for the foreign-born population - Bangladesh (%)
Place of birth for the foreign-born population - India (%)
Place of birth for the foreign-born population - Iran (%)
Place of birth for the foreign-born population - Kazakhstan (%)
Place of birth for the foreign-born population - Nepal (%)
Place of birth for the foreign-born population - Pakistan (%)
Place of birth for the foreign-born population - Sri Lanka (%)
Place of birth for the foreign-born population - Uzbekistan (%)
Place of birth for the foreign-born population - Other South Central Asia (%)
Place of birth for the foreign-born population - Burma (%)
Place of birth for the foreign-born population - Cambodia (%)
Place of birth for the foreign-born population - Indonesia (%)
Place of birth for the foreign-born population - Laos (%)
Place of birth for the foreign-born population - Malaysia (%)
Place of birth for the foreign-born population - Philippines (%)
Place of birth for the foreign-born population - Singapore (%)
Place of birth for the foreign-born population - Thailand (%)
Place of birth for the foreign-born population - Vietnam (%)
Place of birth for the foreign-born population - Other South Eastern Asia (%)
Place of birth for the foreign-born population - Armenia (%)
Place of birth for the foreign-born population - Iraq (%)
Place of birth for the foreign-born population - Israel (%)
Place of birth for the foreign-born population - Jordan (%)
Place of birth for the foreign-born population - Kuwait (%)
Place of birth for the foreign-born population - Lebanon (%)
Place of birth for the foreign-born population - Saudi Arabia (%)
Place of birth for the foreign-born population - Syria (%)
Place of birth for the foreign-born population - Turkey (%)
Place of birth for the foreign-born population - Yemen (%)
Place of birth for the foreign-born population - Other Western Asia (%)
Place of birth for the foreign-born population - Eritrea (%)
Place of birth for the foreign-born population - Ethiopia (%)
Place of birth for the foreign-born population - Kenya (%)
Place of birth for the foreign-born population - Somalia (%)
Place of birth for the foreign-born population - Uganda (%)
Place of birth for the foreign-born population - Zimbabwe (%)
Place of birth for the foreign-born population - Other Eastern Africa (%)
Place of birth for the foreign-born population - Cameroon (%)
Place of birth for the foreign-born population - Congo (%)
Place of birth for the foreign-born population - Democratic Republic of Congo (Zaire) (%)
Place of birth for the foreign-born population - Other Middle Africa (%)
Place of birth for the foreign-born population - Egypt (%)
Place of birth for the foreign-born population - Morocco (%)
Place of birth for the foreign-born population - Sudan (%)
Place of birth for the foreign-born population - Other Northern Africa (%)
Place of birth for the foreign-born population - South Africa (%)
Place of birth for the foreign-born population - Other Southern Africa (%)
Place of birth for the foreign-born population - Cabo Verde (%)
Place of birth for the foreign-born population - Ghana (%)
Place of birth for the foreign-born population - Liberia (%)
Place of birth for the foreign-born population - Nigeria (%)
Place of birth for the foreign-born population - Senegal (%)
Place of birth for the foreign-born population - Sierra Leone (%)
Place of birth for the foreign-born population - Other Western Africa (%)
Place of birth for the foreign-born population - Australia (%)
Place of birth for the foreign-born population - New Zealand (%)
Place of birth for the foreign-born population - Fiji (%)
Place of birth for the foreign-born population - Micronesia (%)
Place of birth for the foreign-born population - Bahamas (%)
Place of birth for the foreign-born population - Barbados (%)
Place of birth for the foreign-born population - Cuba (%)
Place of birth for the foreign-born population - Dominica (%)
Place of birth for the foreign-born population - Dominican Republic (%)
Place of birth for the foreign-born population - Grenada (%)
Place of birth for the foreign-born population - Haiti (%)
Place of birth for the foreign-born population - Jamaica (%)
Place of birth for the foreign-born population - St. Vincent and the Grenadines (%)
Place of birth for the foreign-born population - Trinidad and Tobago (%)
Place of birth for the foreign-born population - West Indies (%)
Place of birth for the foreign-born population - Other Caribbean (%)
Place of birth for the foreign-born population - Belize (%)
Place of birth for the foreign-born population - Costa Rica (%)
Place of birth for the foreign-born population - El Salvador (%)
Place of birth for the foreign-born population - Guatemala (%)
Place of birth for the foreign-born population - Honduras (%)
Place of birth for the foreign-born population - Mexico (%)
Place of birth for the foreign-born population - Nicaragua (%)
Place of birth for the foreign-born population - Panama (%)
Place of birth for the foreign-born population - Other Central America (%)
Place of birth for the foreign-born population - Argentina (%)
Place of birth for the foreign-born population - Bolivia (%)
Place of birth for the foreign-born population - Brazil (%)
Place of birth for the foreign-born population - Chile (%)
Place of birth for the foreign-born population - Colombia (%)
Place of birth for the foreign-born population - Ecuador (%)
Place of birth for the foreign-born population - Guyana (%)
Place of birth for the foreign-born population - Peru (%)
Place of birth for the foreign-born population - Uruguay (%)
Place of birth for the foreign-born population - Venezuela (%)
Place of birth for the foreign-born population - Other South America (%)
Place of birth for the foreign-born population - Canada (%)
Place of birth for the foreign-born population - Other Northern America (%)
Place of birth for the foreign-born population - Other (%)
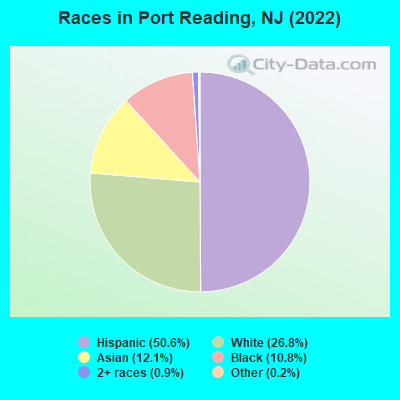
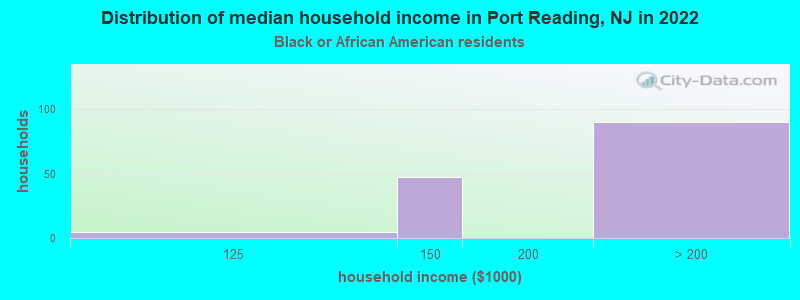
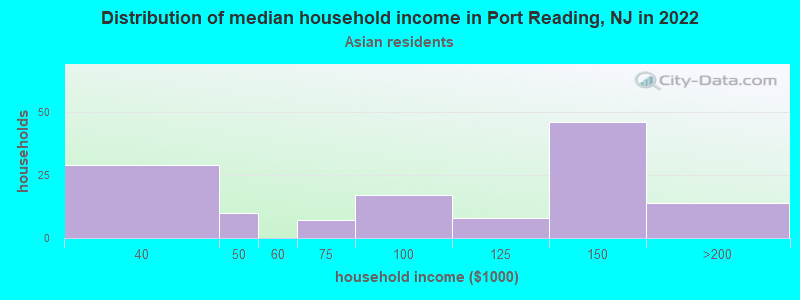
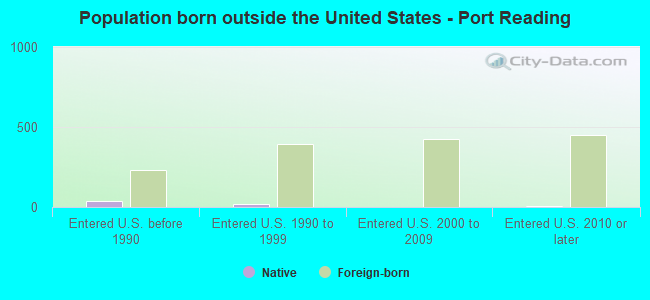
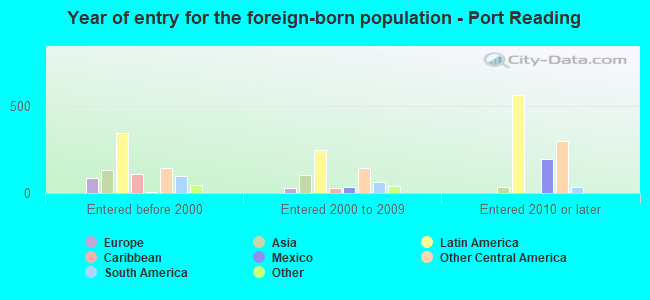
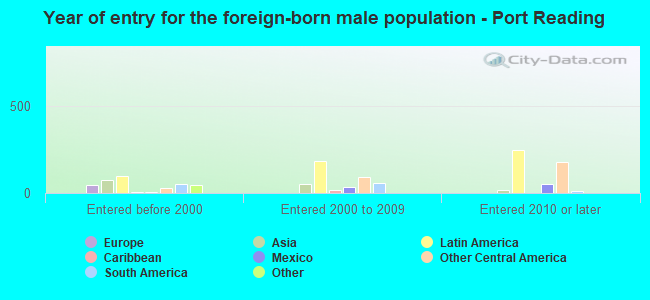
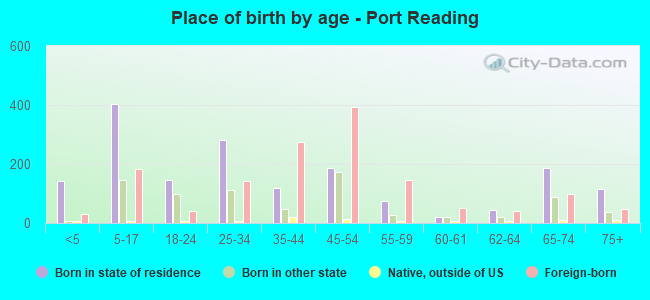
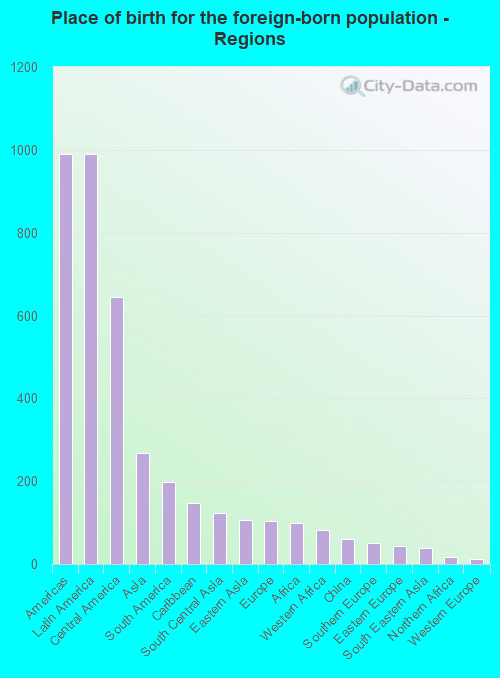
According to 2022 data, the most numerous races in Port Reading, NJ are White alone (1,085 residents), Hispanic (2,046 residents), and Black alone (438 residents). 51.7% of Port Reading residents speak English at home. 36.2% of Port Reading, NJ residents are foreign-born (24.1% born in Latin America, 6.5% born in Asia), which is 36.4% greater than the foreign-born rate of 23.0% across the entire state of New Jersey.
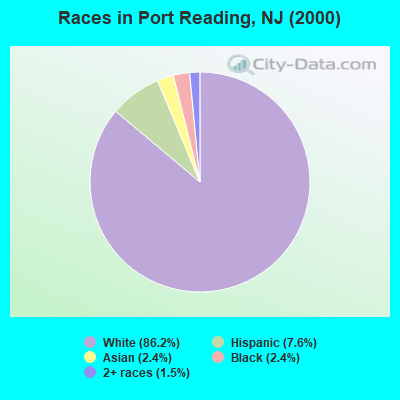
Race distribution in Port Reading
2000 2022
5,557,209 66.0% White alone 1,117,191 13.3% Hispanic 1,096,171 13.0% Black alone 477,012 5.7% Asian alone 133,689 1.6% Two or more races 19,565 0.2% Other race alone 11,338 0.1% American Indian alone 2,175 0.03% Native Hawaiian and Other
4,766,476 51.5% White alone 2,028,470 21.9% Hispanic 1,111,632 12.0% Black alone 923,546 10.0% Asian alone 332,237 3.6% Two or more races 89,847 1.0% Other race alone 8,557 0.09% American Indian alone 934 0.01% Native Hawaiian and Other
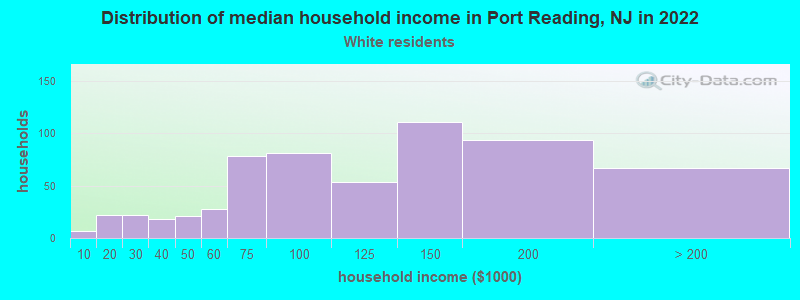
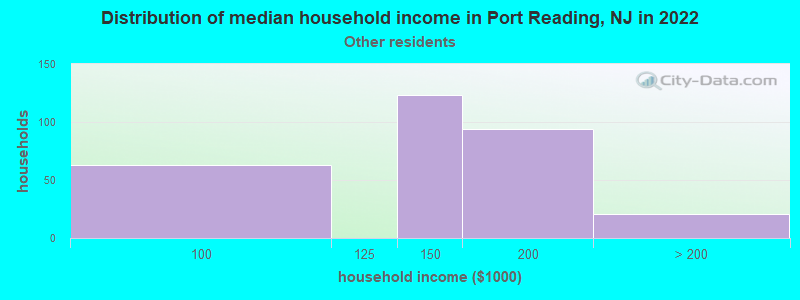
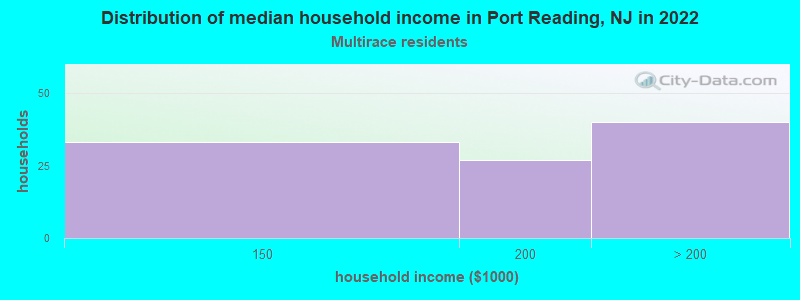
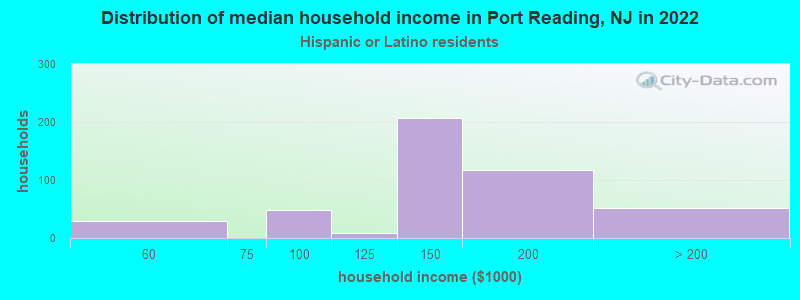
Income and house value in Port Reading Median household income in 2022 $92,879 White non-Hispanic householders$194,433 Black householders$95,149 Asian householders$136,387 Some other race householders$162,853 Two or more races householders$143,568 Hispanic or Latino race householdersMedian 2022 house value $425,760 White Non-Hispanic householders$502,199 Black or African American householders $616,447 Asian householders$513,706 Some other race householders$374,252 Two or more races householders$435,349 Hispanic or Latino householders
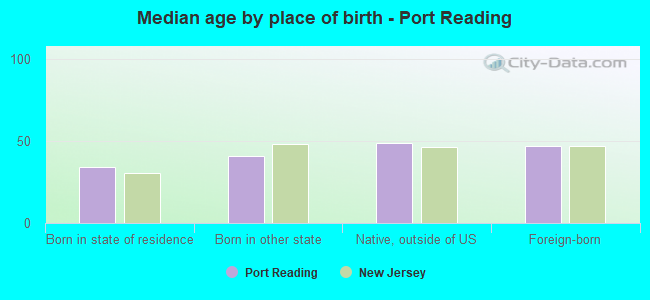
Median age by race in Port Reading
50.3 Median age for White residents44.6 54.4 47.3 Median age for Black or African American residents48.3 47.7 -673,036,092.7 Median age for American Indian / Alaska Native residents-624,624,624.0 -739,999,999.3 41.0 Median age for Asian residents34.5 41.2 -939,393,938.5 Median age for Native Hawaiian / Pacific Islander residents-860,335,194.7 -713,070,378.3 34.3 Median age for Other race residents24.6 38.8 49.8 Median age for Two or more races residents50.1 47.3 58.7 Median age for White alone residents56.4 61.3 32.4 Median age for Hispanic or Latino residents20.2 37.7
Owner/renter occupied households by race in Port Reading
House owners and renters - White residents 559 89.6% Owner occupied65 10.4% Renter occupiedHouse owners and renters - Black or African American residents 126 100.0% Owner occupiedHouse owners and renters - Asian residents 132 96.5% Owner occupied5 3.5% Renter occupiedHouse owners and renters - Other race residents 331 100.0% Owner occupiedHouse owners and renters - Two or more races residents 109 100.0% Owner occupiedHouse owners and renters - White alone residents 471 89.4% Owner occupied56 10.6% Renter occupiedHouse owners and renters - Hispanic or Latino residents 464 95.4% Owner occupied22 4.6% Renter occupied
Language usage in Port Reading
English speakers - Total 51.7% of residents of Port Reading speak English at home.
33.6% of residents speak Spanish at home 649 50.3% Speak English very well642 49.7% Speak English less than very well14.7% of residents speak other language at home 327 57.9% Speak English very well238 42.1% Speak English less than very well
English speakers - Born in the United States 79.2% of residents of Port Reading speak English at home.
6.8% of residents speak Spanish at home 52 100.0% Speak English very well13.4% of residents speak other language at home 97 95.1% Speak English very well5 4.9% Speak English less than very well
English speakers - Native, born elsewhere 0.0% of residents of Port Reading speak English at home.
95.5% of residents speak Spanish at home 37 58.7% Speak English very well26 41.3% Speak English less than very well
English speakers - Foreign-born 14.8% of residents of Port Reading speak English at home.
62.4% of residents speak Spanish at home 299 33.1% Speak English very well605 66.9% Speak English less than very well26.5% of residents speak other language at home 159 41.4% Speak English very well225 58.6% Speak English less than very well
White (Caucasian) - Speak only English Native:
90.9% (1,109)Foreign-born:
21.9% (32)
White (Caucasian) - Speak another language Native:
8.7% (106)Foreign-born:
78.5% (116)
Black or African American - Speak only English Native:
99.9% (282)Foreign-born:
71.1% (130)
Black or African American - Speak another language Native:
1.0% (3)Foreign-born:
15.8% (29)
Asian - Speak another language Native:
54.1% (122)Foreign-born:
99.2% (265)
Other race - Speak another language Native:
46.8% (213)Foreign-born:
97.4% (1,066)
Two or more races - Speak only English Native:
26.8% (75)Foreign-born:
41.4% (35)
Two or more races - Speak another language Native:
74.6% (208)Foreign-born:
57.5% (48)
White alone - Speak only English Native:
93.3% (887)Foreign-born:
28.6% (35)
White alone - Speak another language Native:
6.4% (61)Foreign-born:
72.0% (88)
Hispanic or Latino - Speak only English Native:
54.2% (489)Foreign-born:
2.1% (21)
Hispanic or Latino - Speak another language Native:
47.6% (430)Foreign-born:
96.0% (925)
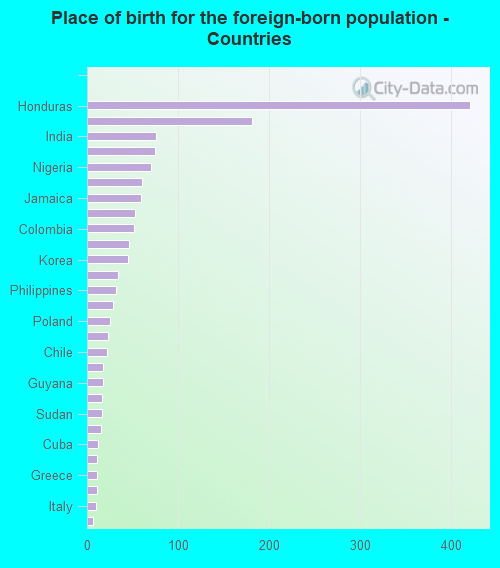
Foreign-born residents in Port Reading 1,464 residents are foreign born (24.1% Latin America , 6.5% Asia ).
This city:
36.2%New Jersey:
23.2%
Marital status for residents in Port Reading Marital status - White (Caucasian) population 15 years and over
Males 30.1% Never married56.9% Now married1.4% Separated3.9% Widowed7.6% DivorcedFemales 27.7% Never married47.6% Now married0.0% Separated12.2% Widowed12.5% DivorcedWomen who gave birth in the past 12 months Now married:
100.0% (28)Unmarried:
0.0% (0)
Women who did not give birth in the past 12 months Now married:
43.8% (98)Unmarried:
56.2% (126)
Marital status - Black or African American population 15 years and over
Males 74.0% Never married18.3% Now married0.0% Separated0.0% Widowed7.7% DivorcedFemales 17.4% Never married26.5% Now married0.0% Separated3.0% Widowed53.0% DivorcedWomen who did not give birth in the past 12 months Now married:
74.5% (37)Unmarried:
25.5% (13)
Marital status - Asian population 15 years and over
Males 28.4% Never married71.6% Now married0.0% Separated0.0% Widowed0.0% DivorcedFemales 25.3% Never married71.7% Now married3.0% Separated0.0% Widowed0.0% DivorcedWomen who gave birth in the past 12 months Now married:
100.0% (5)Unmarried:
0.0% (0)
Women who did not give birth in the past 12 months Now married:
60.4% (65)Unmarried:
39.6% (43)
Marital status - Other race population 15 years and over
Males 54.6% Never married40.0% Now married0.0% Separated5.4% Widowed0.0% DivorcedFemales 49.1% Never married30.4% Now married0.0% Separated8.7% Widowed11.8% DivorcedWomen who gave birth in the past 12 months Now married:
45.2% (53)Unmarried:
54.8% (65)
Women who did not give birth in the past 12 months Now married:
28.3% (98)Unmarried:
71.7% (249)
Marital status - Two or more races population 15 years and over
Males 25.5% Never married74.5% Now married0.0% Separated0.0% Widowed0.0% DivorcedFemales 0.0% Never married90.1% Now married0.0% Separated9.9% Widowed0.0% DivorcedWomen who did not give birth in the past 12 months Now married:
100.0% (113)Unmarried:
0.0% (0)
Marital status - White alone, not Hispanic / Latino population 15 years and over
Males 30.5% Never married55.8% Now married0.0% Separated5.6% Widowed8.1% DivorcedFemales 26.1% Never married44.7% Now married0.0% Separated15.1% Widowed14.1% DivorcedWomen who did not give birth in the past 12 months Now married:
42.7% (76)Unmarried:
57.3% (102)
Marital status - Hispanic or Latino population 15 years and over
Males 44.0% Never married49.4% Now married1.4% Separated3.2% Widowed1.9% DivorcedFemales 36.5% Never married47.9% Now married0.0% Separated7.3% Widowed8.3% DivorcedWomen who gave birth in the past 12 months Now married:
61.0% (75)Unmarried:
39.0% (48)
Women who did not give birth in the past 12 months Now married:
47.2% (211)Unmarried:
52.8% (236)
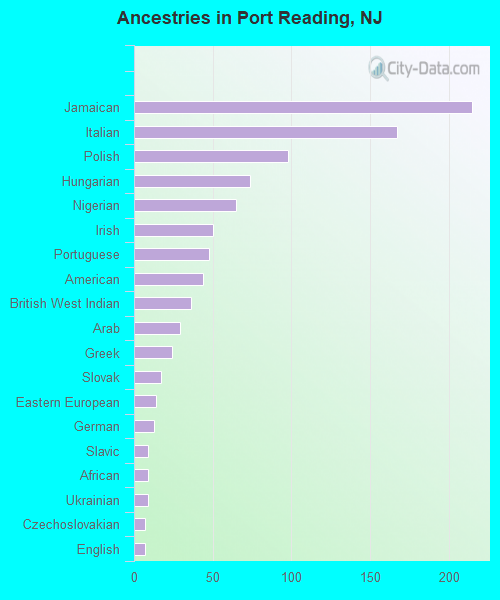
Ancestries in Port Reading
215 10.1% Jamaican167 7.8% Italian98 4.6% Polish74 3.5% Hungarian65 3.1% Nigerian50 2.3% Irish48 2.3% Portuguese44 2.1% American36 1.7% British West Indian29 1.4% Arab24 1.1% Greek17 0.8% Slovak14 0.7% Eastern European13 0.6% German9 0.4% Slavic9 0.4% African9 0.4% Ukrainian7 0.3% Czechoslovakian7 0.3% English
Children Nativity (place of birth) in Port Reading
Children under 6 years - Living with two parents Both parents native 175 100.0% NativeBoth parents foreign-born 13 100.0% NativeChildren under 6 years - Living with one parent Native parent 4 100.0% NativeChildren 6 to 17 years - Living with two parents Both parents native 40 100.0% NativeBoth parents foreign-born 247 77.1% Native73 22.9% Foreign-bornOne native, one foreign-born parent 72 100.0% NativeChildren 6 to 17 years - Living with one parent Native parent 76 100.0% NativeForeign-born parent 6 52.6% Native6 47.4% Foreign-born