Races in Portage, Wisconsin (WI) Detailed Stats
Data:
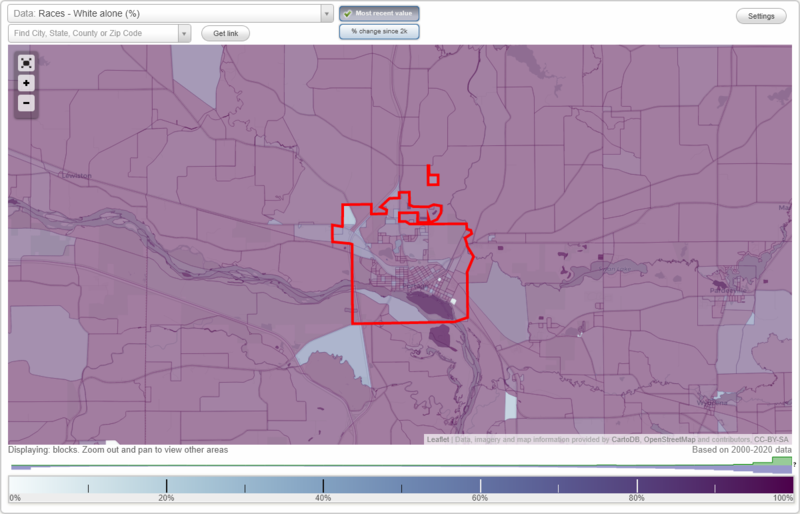
Races - White alone (%)
Races - White alone (% change since 2000)
Races - Black alone (%)
Races - Black alone (% change since 2000)
Races - American Indian alone (%)
Races - American Indian alone (% change since 2000)
Races - Asian alone (%)
Races - Asian alone (% change since 2000)
Races - Hispanic (%)
Races - Hispanic (% change since 2000)
Races - Native Hawaiian and Other Pacific Islander alone (%)
Races - Native Hawaiian and Other Pacific Islander alone (% change since 2000)
Races - Two or more races(%)
Races - Two or more races(% change since 2000)
Races - Other race alone (%)
Races - Other race alone (% change since 2000)
Racial diversity
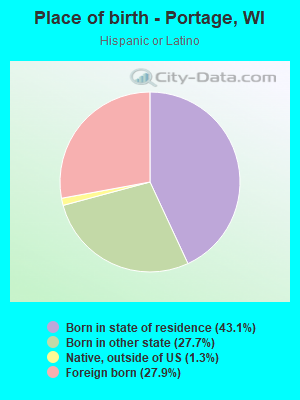
Place of birth - Born in state of residence (%)
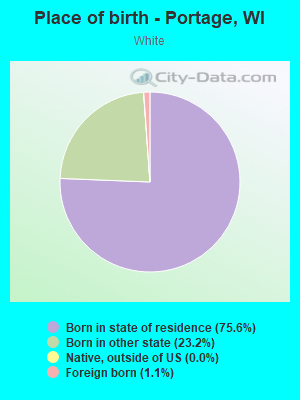
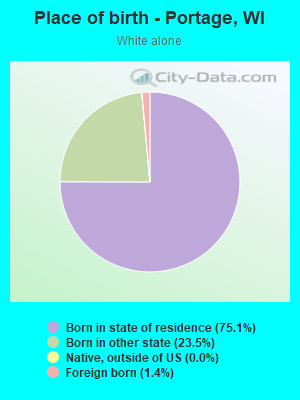
Place of birth - Born in state of residence (%) - White
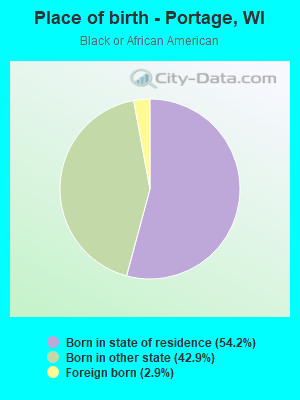
Place of birth - Born in state of residence (%) - Black or African American
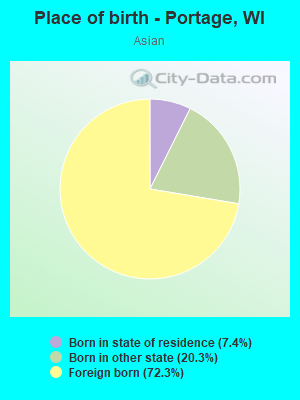
Place of birth - Born in state of residence (%) - Asian
Place of birth - Born in state of residence (%) - Hispanic or Latino
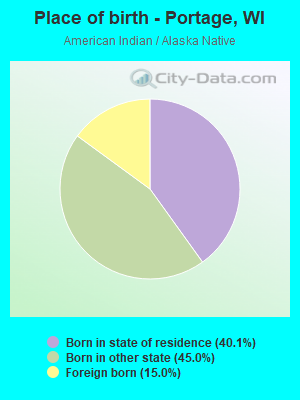
Place of birth - Born in state of residence (%) - American Indian and Alaska Native
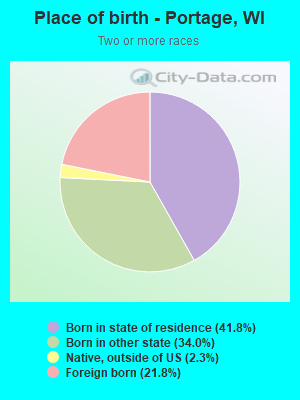
Place of birth - Born in state of residence (%) - Multirace
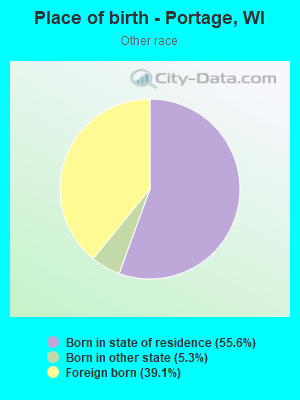
Place of birth - Born in state of residence (%) - Other Race
Place of birth - Born in other state (%)
Place of birth - Born in other state (%) - White
Place of birth - Born in other state (%) - Black or African American
Place of birth - Born in other state (%) - Asian
Place of birth - Born in other state (%) - Hispanic or Latino
Place of birth - Born in other state (%) - American Indian and Alaska Native
Place of birth - Born in other state (%) - Multirace
Place of birth - Born in other state (%) - Other Race
Place of birth - Native, outside of US (%)
Place of birth - Native, outside of US (%) - White
Place of birth - Native, outside of US (%) - Black or African American
Place of birth - Native, outside of US (%) - Asian
Place of birth - Native, outside of US (%) - Hispanic or Latino
Place of birth - Native, outside of US (%) - American Indian and Alaska Native
Place of birth - Native, outside of US (%) - Multirace
Place of birth - Native, outside of US (%) - Other Race
Place of birth - Foreign born (%)
Place of birth - Foreign born (%) - White
Place of birth - Foreign born (%) - Black or African American
Place of birth - Foreign born (%) - Asian
Place of birth - Foreign born (%) - Hispanic or Latino
Place of birth - Foreign born (%) - American Indian and Alaska Native
Place of birth - Foreign born (%) - Multirace
Place of birth - Foreign born (%) - Other Race
Residents speaking English at home (%)
Residents speaking English at home - Born in the United States (%)
Residents speaking English at home - Native, born elsewhere (%)
Residents speaking English at home - Foreign born (%)
Residents speaking Spanish at home (%)
Residents speaking Spanish at home - Born in the United States (%)
Residents speaking Spanish at home - Native, born elsewhere (%)
Residents speaking Spanish at home - Foreign born (%)
Residents speaking other language at home (%)
Residents speaking other language at home - Born in the United States (%)
Residents speaking other language at home - Native, born elsewhere (%)
Residents speaking other language at home - Foreign born (%)
Marital status - Never married (%)
Marital status - Now married (%)
Marital status - Separated (%)
Marital status - Widowed (%)
Marital status - Divorced (%)
Ancestries Reported - Arab (%)
Ancestries Reported - Czech (%)
Ancestries Reported - Danish (%)
Ancestries Reported - Dutch (%)
Ancestries Reported - English (%)
Ancestries Reported - French (%)
Ancestries Reported - French Canadian (%)
Ancestries Reported - German (%)
Ancestries Reported - Greek (%)
Ancestries Reported - Hungarian (%)
Ancestries Reported - Irish (%)
Ancestries Reported - Italian (%)
Ancestries Reported - Lithuanian (%)
Ancestries Reported - Norwegian (%)
Ancestries Reported - Polish (%)
Ancestries Reported - Portuguese (%)
Ancestries Reported - Russian (%)
Ancestries Reported - Scotch-Irish (%)
Ancestries Reported - Scottish (%)
Ancestries Reported - Slovak (%)
Ancestries Reported - Subsaharan African (%)
Ancestries Reported - Swedish (%)
Ancestries Reported - Swiss (%)
Ancestries Reported - Ukrainian (%)
Ancestries Reported - United States (%)
Ancestries Reported - Welsh (%)
Ancestries Reported - West Indian (%)
Ancestries Reported - Other (%)
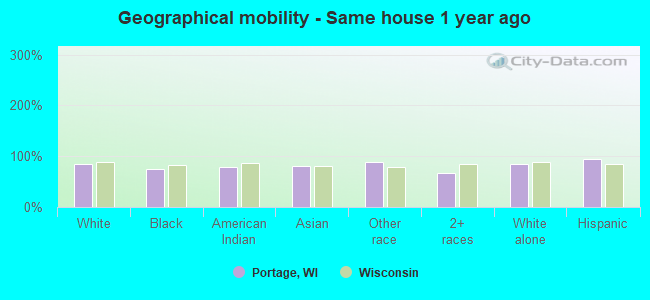
Geographical mobility - Same house 1 year ago (%)
Geographical mobility - Same house 1 year ago (%) - White
Geographical mobility - Same house 1 year ago (%) - Black or African American
Geographical mobility - Same house 1 year ago (%) - Asian
Geographical mobility - Same house 1 year ago (%) - Hispanic or Latino
Geographical mobility - Same house 1 year ago (%) - American Indian and Alaska Native
Geographical mobility - Same house 1 year ago (%) - Multirace
Geographical mobility - Same house 1 year ago (%) - Other Race
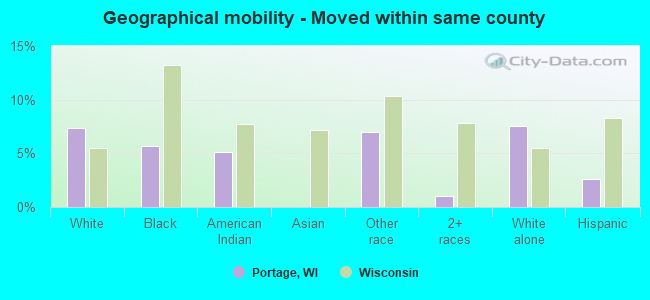
Geographical mobility - Moved within same county (%)
Geographical mobility - Moved within same county (%) - White
Geographical mobility - Moved within same county (%) - Black or African American
Geographical mobility - Moved within same county (%) - Asian
Geographical mobility - Moved within same county (%) - Hispanic or Latino
Geographical mobility - Moved within same county (%) - American Indian and Alaska Native
Geographical mobility - Moved within same county (%) - Multirace
Geographical mobility - Moved within same county (%) - Other Race
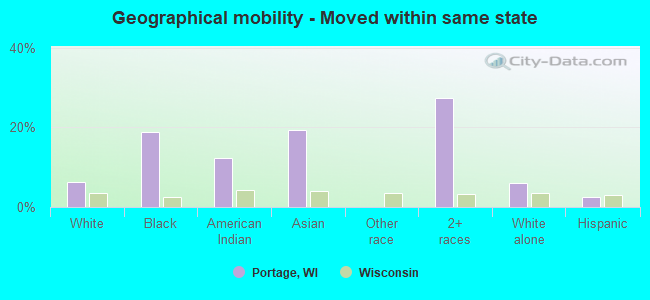
Geographical mobility - Moved from different county within same state (%)
Geographical mobility - Moved from different county within same state (%) - White
Geographical mobility - Moved from different county within same state (%) - Black or African American
Geographical mobility - Moved from different county within same state (%) - Asian
Geographical mobility - Moved from different county within same state (%) - Hispanic or Latino
Geographical mobility - Moved from different county within same state (%) - American Indian and Alaska Native
Geographical mobility - Moved from different county within same state (%) - Multirace
Geographical mobility - Moved from different county within same state (%) - Other Race
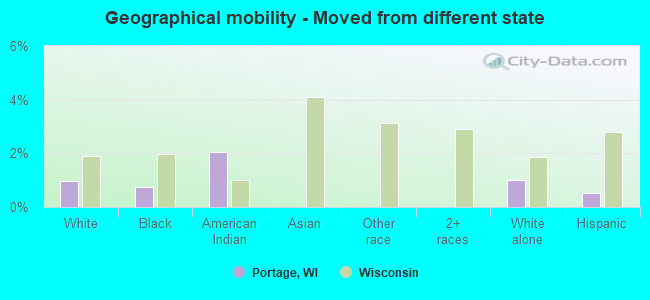
Geographical mobility - Moved from different state (%)
Geographical mobility - Moved from different state (%) - White
Geographical mobility - Moved from different state (%) - Black or African American
Geographical mobility - Moved from different state (%) - Asian
Geographical mobility - Moved from different state (%) - Hispanic or Latino
Geographical mobility - Moved from different state (%) - American Indian and Alaska Native
Geographical mobility - Moved from different state (%) - Multirace
Geographical mobility - Moved from different state (%) - Other Race
Geographical mobility - Moved from abroad (%)
Geographical mobility - Moved from abroad (%) - White
Geographical mobility - Moved from abroad (%) - Black or African American
Geographical mobility - Moved from abroad (%) - Asian
Geographical mobility - Moved from abroad (%) - Hispanic or Latino
Geographical mobility - Moved from abroad (%) - American Indian and Alaska Native
Geographical mobility - Moved from abroad (%) - Multirace
Geographical mobility - Moved from abroad (%) - Other Race
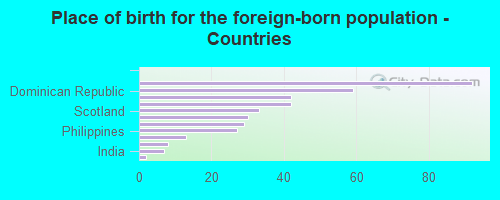
Place of birth for the foreign-born population - Ireland (%)
Place of birth for the foreign-born population - Denmark (%)
Place of birth for the foreign-born population - Norway (%)
Place of birth for the foreign-born population - Sweden (%)
Place of birth for the foreign-born population - United Kingdom (%)
Place of birth for the foreign-born population - England (%)
Place of birth for the foreign-born population - Scotland (%)
Place of birth for the foreign-born population - Other Northern Europe (%)
Place of birth for the foreign-born population - Austria (%)
Place of birth for the foreign-born population - Belgium (%)
Place of birth for the foreign-born population - France (%)
Place of birth for the foreign-born population - Germany (%)
Place of birth for the foreign-born population - Netherlands (%)
Place of birth for the foreign-born population - Switzerland (%)
Place of birth for the foreign-born population - Other Western Europe (%)
Place of birth for the foreign-born population - Greece (%)
Place of birth for the foreign-born population - Italy (%)
Place of birth for the foreign-born population - Portugal (%)
Place of birth for the foreign-born population - Spain (%)
Place of birth for the foreign-born population - Other Southern Europe (%)
Place of birth for the foreign-born population - Albania (%)
Place of birth for the foreign-born population - Belarus (%)
Place of birth for the foreign-born population - Bosnia and Herzegovina (%)
Place of birth for the foreign-born population - Bulgaria (%)
Place of birth for the foreign-born population - Croatia (%)
Place of birth for the foreign-born population - Czechoslovakia (%)
Place of birth for the foreign-born population - Hungary (%)
Place of birth for the foreign-born population - Latvia (%)
Place of birth for the foreign-born population - Lithuania (%)
Place of birth for the foreign-born population - North Macedonia (Macedonia) (%)
Place of birth for the foreign-born population - Moldova (%)
Place of birth for the foreign-born population - Poland (%)
Place of birth for the foreign-born population - Romania (%)
Place of birth for the foreign-born population - Russia (%)
Place of birth for the foreign-born population - Serbia (%)
Place of birth for the foreign-born population - Ukraine (%)
Place of birth for the foreign-born population - Other Eastern Europe (%)
Place of birth for the foreign-born population - China (%)
Place of birth for the foreign-born population - Hong Kong (%)
Place of birth for the foreign-born population - Taiwan (%)
Place of birth for the foreign-born population - Japan (%)
Place of birth for the foreign-born population - Korea (%)
Place of birth for the foreign-born population - Other Eastern Asia (%)
Place of birth for the foreign-born population - Afghanistan (%)
Place of birth for the foreign-born population - Bangladesh (%)
Place of birth for the foreign-born population - India (%)
Place of birth for the foreign-born population - Iran (%)
Place of birth for the foreign-born population - Kazakhstan (%)
Place of birth for the foreign-born population - Nepal (%)
Place of birth for the foreign-born population - Pakistan (%)
Place of birth for the foreign-born population - Sri Lanka (%)
Place of birth for the foreign-born population - Uzbekistan (%)
Place of birth for the foreign-born population - Other South Central Asia (%)
Place of birth for the foreign-born population - Burma (%)
Place of birth for the foreign-born population - Cambodia (%)
Place of birth for the foreign-born population - Indonesia (%)
Place of birth for the foreign-born population - Laos (%)
Place of birth for the foreign-born population - Malaysia (%)
Place of birth for the foreign-born population - Philippines (%)
Place of birth for the foreign-born population - Singapore (%)
Place of birth for the foreign-born population - Thailand (%)
Place of birth for the foreign-born population - Vietnam (%)
Place of birth for the foreign-born population - Other South Eastern Asia (%)
Place of birth for the foreign-born population - Armenia (%)
Place of birth for the foreign-born population - Iraq (%)
Place of birth for the foreign-born population - Israel (%)
Place of birth for the foreign-born population - Jordan (%)
Place of birth for the foreign-born population - Kuwait (%)
Place of birth for the foreign-born population - Lebanon (%)
Place of birth for the foreign-born population - Saudi Arabia (%)
Place of birth for the foreign-born population - Syria (%)
Place of birth for the foreign-born population - Turkey (%)
Place of birth for the foreign-born population - Yemen (%)
Place of birth for the foreign-born population - Other Western Asia (%)
Place of birth for the foreign-born population - Eritrea (%)
Place of birth for the foreign-born population - Ethiopia (%)
Place of birth for the foreign-born population - Kenya (%)
Place of birth for the foreign-born population - Somalia (%)
Place of birth for the foreign-born population - Uganda (%)
Place of birth for the foreign-born population - Zimbabwe (%)
Place of birth for the foreign-born population - Other Eastern Africa (%)
Place of birth for the foreign-born population - Cameroon (%)
Place of birth for the foreign-born population - Congo (%)
Place of birth for the foreign-born population - Democratic Republic of Congo (Zaire) (%)
Place of birth for the foreign-born population - Other Middle Africa (%)
Place of birth for the foreign-born population - Egypt (%)
Place of birth for the foreign-born population - Morocco (%)
Place of birth for the foreign-born population - Sudan (%)
Place of birth for the foreign-born population - Other Northern Africa (%)
Place of birth for the foreign-born population - South Africa (%)
Place of birth for the foreign-born population - Other Southern Africa (%)
Place of birth for the foreign-born population - Cabo Verde (%)
Place of birth for the foreign-born population - Ghana (%)
Place of birth for the foreign-born population - Liberia (%)
Place of birth for the foreign-born population - Nigeria (%)
Place of birth for the foreign-born population - Senegal (%)
Place of birth for the foreign-born population - Sierra Leone (%)
Place of birth for the foreign-born population - Other Western Africa (%)
Place of birth for the foreign-born population - Australia (%)
Place of birth for the foreign-born population - New Zealand (%)
Place of birth for the foreign-born population - Fiji (%)
Place of birth for the foreign-born population - Micronesia (%)
Place of birth for the foreign-born population - Bahamas (%)
Place of birth for the foreign-born population - Barbados (%)
Place of birth for the foreign-born population - Cuba (%)
Place of birth for the foreign-born population - Dominica (%)
Place of birth for the foreign-born population - Dominican Republic (%)
Place of birth for the foreign-born population - Grenada (%)
Place of birth for the foreign-born population - Haiti (%)
Place of birth for the foreign-born population - Jamaica (%)
Place of birth for the foreign-born population - St. Vincent and the Grenadines (%)
Place of birth for the foreign-born population - Trinidad and Tobago (%)
Place of birth for the foreign-born population - West Indies (%)
Place of birth for the foreign-born population - Other Caribbean (%)
Place of birth for the foreign-born population - Belize (%)
Place of birth for the foreign-born population - Costa Rica (%)
Place of birth for the foreign-born population - El Salvador (%)
Place of birth for the foreign-born population - Guatemala (%)
Place of birth for the foreign-born population - Honduras (%)
Place of birth for the foreign-born population - Mexico (%)
Place of birth for the foreign-born population - Nicaragua (%)
Place of birth for the foreign-born population - Panama (%)
Place of birth for the foreign-born population - Other Central America (%)
Place of birth for the foreign-born population - Argentina (%)
Place of birth for the foreign-born population - Bolivia (%)
Place of birth for the foreign-born population - Brazil (%)
Place of birth for the foreign-born population - Chile (%)
Place of birth for the foreign-born population - Colombia (%)
Place of birth for the foreign-born population - Ecuador (%)
Place of birth for the foreign-born population - Guyana (%)
Place of birth for the foreign-born population - Peru (%)
Place of birth for the foreign-born population - Uruguay (%)
Place of birth for the foreign-born population - Venezuela (%)
Place of birth for the foreign-born population - Other South America (%)
Place of birth for the foreign-born population - Canada (%)
Place of birth for the foreign-born population - Other Northern America (%)
Place of birth for the foreign-born population - Other (%)
Latest news about races in Portage, WI collected exclusively by city-data.com from local newspapers, TV, and radio stations
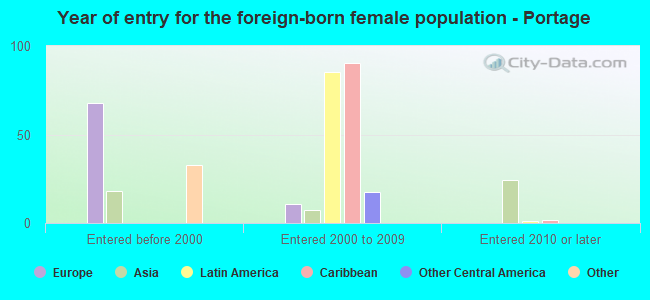
According to 2022 data, the most numerous races in Portage, WI are White alone (8,791 residents), Hispanic (713 residents), and Black alone (465 residents). 96.4% of Portage residents speak English at home. 3.8% of Portage, WI residents are foreign-born (1.9% born in Latin America, 1.1% born in Europe, 0.5% born in Asia), which is 31.8% less than the foreign-born rate of 5.0% across the entire state of Wisconsin.
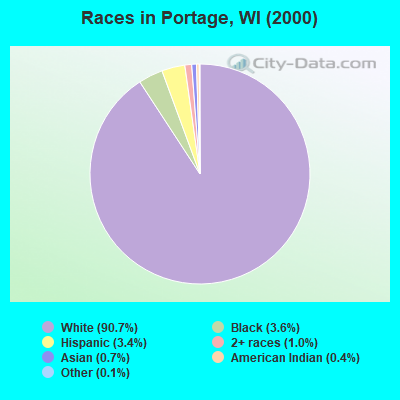
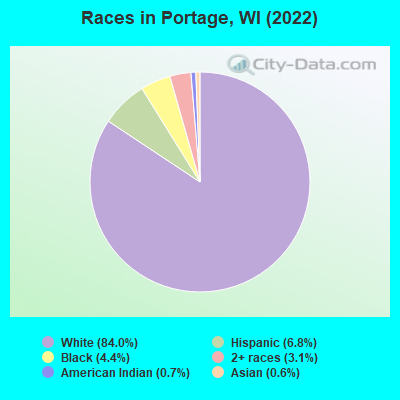
Race distribution in Portage
2000 2022
4,681,630 87.3% White alone 300,245 5.6% Black alone 192,921 3.6% Hispanic 87,995 1.6% Asian alone 51,921 1.0% Two or more races 43,980 0.8% American Indian alone 3,637 0.07% Other race alone 1,346 0.03% Native Hawaiian and Other
4,654,031 79.0% White alone 447,022 7.6% Hispanic 345,678 5.9% Black alone 217,532 3.7% Two or more races 172,242 2.9% Asian alone 33,762 0.6% American Indian alone 19,680 0.3% Other race alone 2,592 0.04% Native Hawaiian and Other
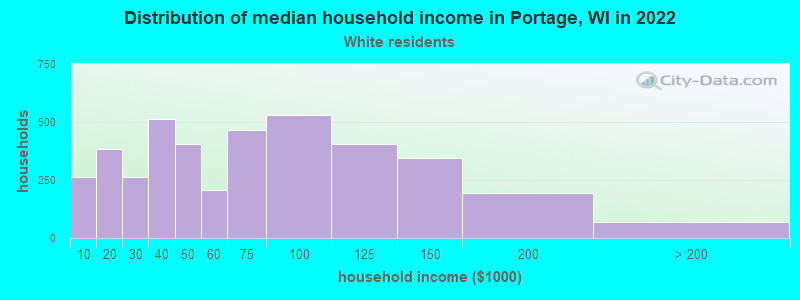
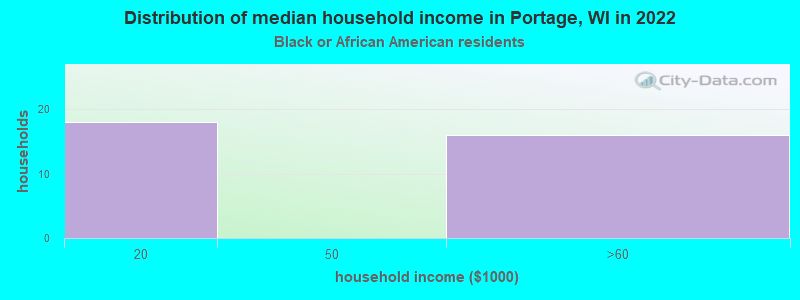
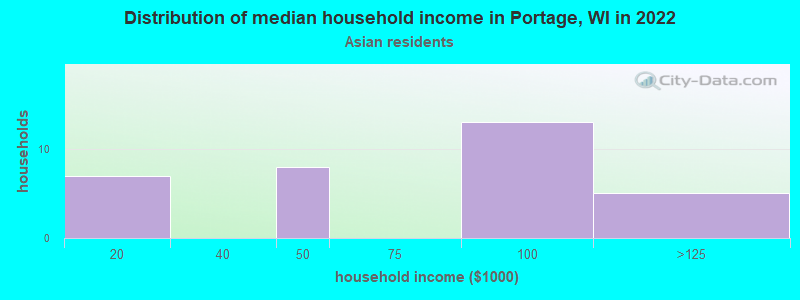
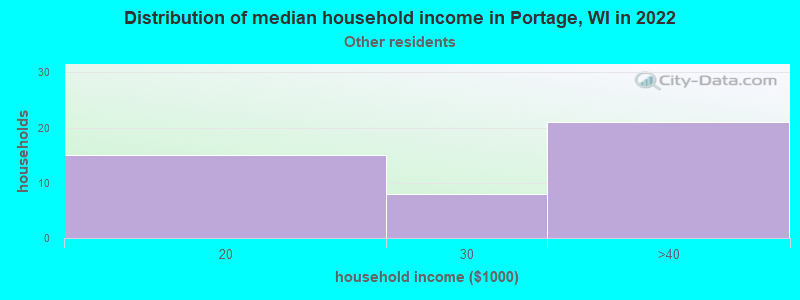
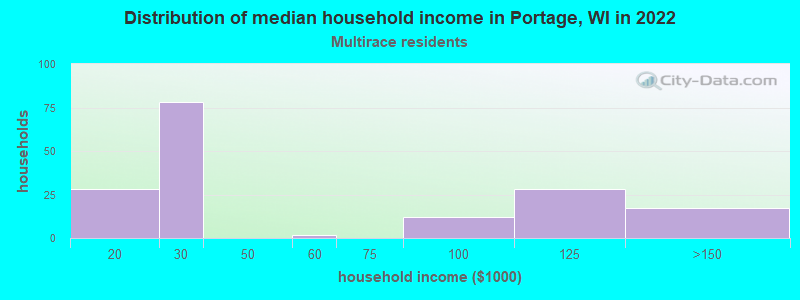
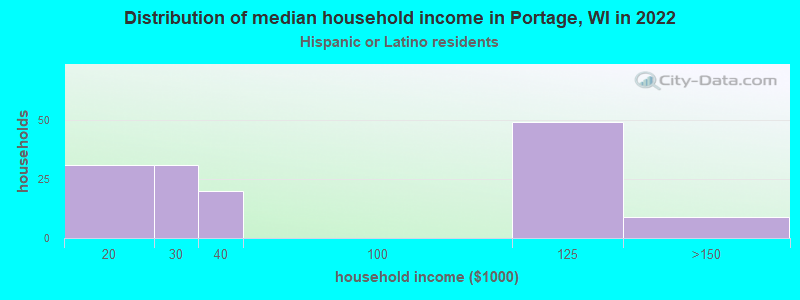
Income and house value in Portage Median household income in 2022 $59,382 White non-Hispanic householders$97,937 Asian householders$28,967 Some other race householdersMedian 2022 house value $188,056 White Non-Hispanic householders$176,044 Black or African American householders$182,257 American Indian or Alaska Native householders $280,428 Asian householders$139,799 Two or more races householders$176,044 Hispanic or Latino householders
Median age by race in Portage
38.4 Median age for White residents36.6 41.7 39.8 Median age for Black or African American residents39.5 27.8 56.4 Median age for American Indian / Alaska Native residents48.2 -689,393,938.7 61.3 Median age for Asian residents-694,063,926.2 66.4 -825,688,072.6 Median age for Native Hawaiian / Pacific Islander residents-862,745,097.2 -732,444,443.7 34.5 Median age for Other race residents9.8 38.5 28.3 Median age for Two or more races residents35.0 18.1 39.3 Median age for White alone residents37.5 41.6 27.7 Median age for Hispanic or Latino residents27.2 28.4
Owner/renter occupied households by race in Portage
House owners and renters - White residents 2,192 55.1% Owner occupied1,787 44.9% Renter occupiedHouse owners and renters - Black or African American residents 30 100.0% Owner occupiedHouse owners and renters - Asian residents 38 100.0% Owner occupiedHouse owners and renters - Other race residents 22 43.3% Owner occupied29 56.7% Renter occupiedHouse owners and renters - Two or more races residents 49 30.5% Owner occupied111 69.5% Renter occupiedHouse owners and renters - White alone residents 2,175 54.9% Owner occupied1,787 45.1% Renter occupiedHouse owners and renters - Hispanic or Latino residents 62 40.9% Owner occupied89 59.1% Renter occupied
Language usage in Portage
English speakers - Total 96.4% of residents of Portage speak English at home.
2.5% of residents speak Spanish at home 185 74.9% Speak English very well62 25.1% Speak English less than very well1.0% of residents speak other language at home 69 71.9% Speak English very well27 28.1% Speak English less than very well
English speakers - Born in the United States 97.4% of residents of Portage speak English at home.
2.3% of residents speak Spanish at home 35 59.3% Speak English very well24 40.7% Speak English less than very well0.1% of residents speak other language at home 3 100.0% Speak English very well
English speakers - Native, born elsewhere 23.1% of residents of Portage speak English at home.
69.2% of residents speak Spanish at home 9 100.0% Speak English less than very well
English speakers - Foreign-born 52.6% of residents of Portage speak English at home.
21.4% of residents speak Spanish at home 61 71.8% Speak English very well24 28.2% Speak English less than very well19.1% of residents speak other language at home 49 64.5% Speak English very well27 35.5% Speak English less than very well
White (Caucasian) - Speak only English Native:
99.8% (8,234)Foreign-born:
100.0% (99)
White (Caucasian) - Speak another language Native:
0.6% (46)Foreign-born:
8.2% (8)
Black or African American - Speak another language Native:
0.3% (1)Foreign-born:
100.0% (13)
American Indian / Alaska Native - Speak another language Native:
9.3% (7)Foreign-born:
100.0% (14)
Other race - Speak another language Native:
73.5% (48)Foreign-born:
98.8% (71)
Two or more races - Speak only English Native:
81.6% (415)Foreign-born:
72.4% (123)
Two or more races - Speak another language Native:
15.5% (79)Foreign-born:
2.2% (4)
White alone - Speak only English Native:
99.8% (8,164)Foreign-born:
90.0% (113)
White alone - Speak another language Native:
0.2% (20)Foreign-born:
9.9% (13)
Hispanic or Latino - Speak only English Native:
60.8% (243)Foreign-born:
45.9% (92)
Hispanic or Latino - Speak another language Native:
39.5% (158)Foreign-born:
48.1% (96)
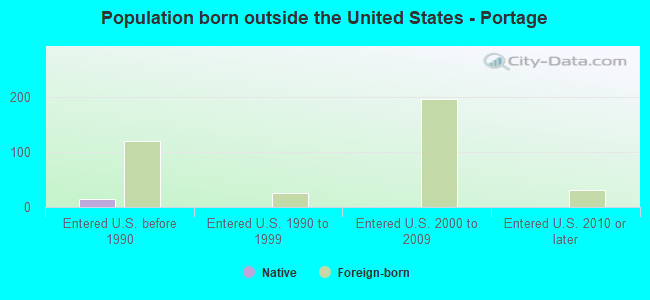
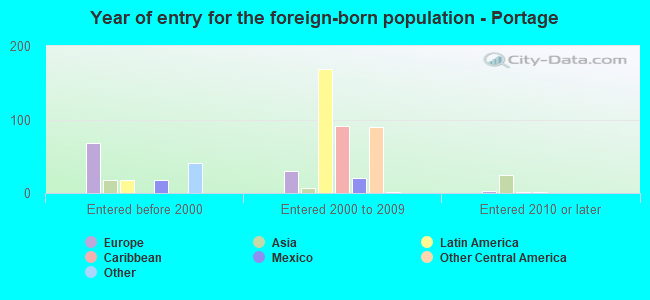
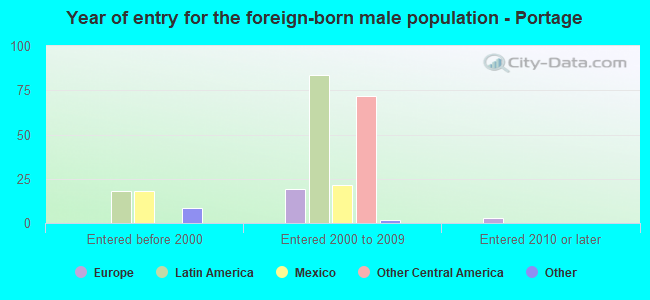
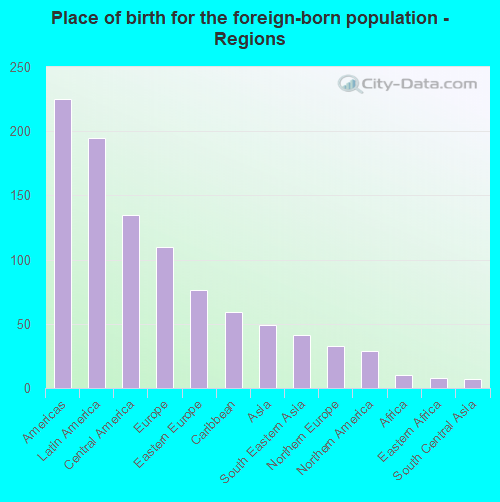
Foreign-born residents in Portage 397 residents are foreign born (1.9% Latin America , 1.1% Europe , 0.5% Asia ).
This city:
3.8%Wisconsin:
5.0%
Marital status for residents in Portage Marital status - White (Caucasian) population 15 years and over
Males 41.7% Never married38.7% Now married0.3% Separated3.3% Widowed16.0% DivorcedFemales 28.0% Never married37.9% Now married4.4% Separated8.2% Widowed21.5% DivorcedWomen who gave birth in the past 12 months Now married:
65.1% (108)Unmarried:
34.9% (58)
Women who did not give birth in the past 12 months Now married:
31.4% (570)Unmarried:
68.6% (1,243)
Marital status - Black or African American population 15 years and over
Males 78.5% Never married4.4% Now married3.7% Separated0.0% Widowed13.3% DivorcedFemales 33.3% Never married50.7% Now married0.0% Separated16.0% Widowed0.0% DivorcedWomen who gave birth in the past 12 months Now married:
100.0% (28)Unmarried:
0.0% (0)
Women who did not give birth in the past 12 months Now married:
26.5% (9)Unmarried:
73.5% (24)
Marital status - American Indian / Alaska Native population 15 years and over
Males 43.2% Never married28.4% Now married0.0% Separated13.5% Widowed14.9% DivorcedFemales 0.0% Never married0.0% Now married0.0% Separated0.0% Widowed100.0% DivorcedMarital status - Asian population 15 years and over
Males 100.0% Never married0.0% Now married0.0% Separated0.0% Widowed0.0% DivorcedFemales 0.0% Never married44.0% Now married0.0% Separated46.0% Widowed10.0% DivorcedWomen who did not give birth in the past 12 months Now married:
100.0% (8)Unmarried:
0.0% (0)
Marital status - Other race population 15 years and over
Males 0.0% Never married67.7% Now married0.0% Separated0.0% Widowed32.3% DivorcedFemales 13.8% Never married62.8% Now married22.3% Separated0.0% Widowed1.1% DivorcedWomen who did not give birth in the past 12 months Now married:
86.0% (73)Unmarried:
14.0% (12)
Marital status - Two or more races population 15 years and over
Males 82.2% Never married12.4% Now married0.0% Separated0.0% Widowed5.4% DivorcedFemales 44.4% Never married40.1% Now married7.0% Separated0.0% Widowed8.5% DivorcedWomen who did not give birth in the past 12 months Now married:
47.5% (83)Unmarried:
52.5% (92)
Marital status - White alone, not Hispanic / Latino population 15 years and over
Males 41.4% Never married38.6% Now married0.3% Separated3.4% Widowed16.3% DivorcedFemales 28.1% Never married37.4% Now married4.5% Separated8.3% Widowed21.7% DivorcedWomen who gave birth in the past 12 months Now married:
66.3% (110)Unmarried:
33.7% (56)
Women who did not give birth in the past 12 months Now married:
30.4% (553)Unmarried:
69.6% (1,267)
Marital status - Hispanic or Latino population 15 years and over
Males 70.1% Never married23.6% Now married0.0% Separated3.2% Widowed3.2% DivorcedFemales 37.4% Never married44.4% Now married15.7% Separated0.0% Widowed2.5% DivorcedWomen who gave birth in the past 12 months Now married:
0.0% (0)Unmarried:
100.0% (3)
Women who did not give birth in the past 12 months Now married:
59.2% (114)Unmarried:
40.8% (78)
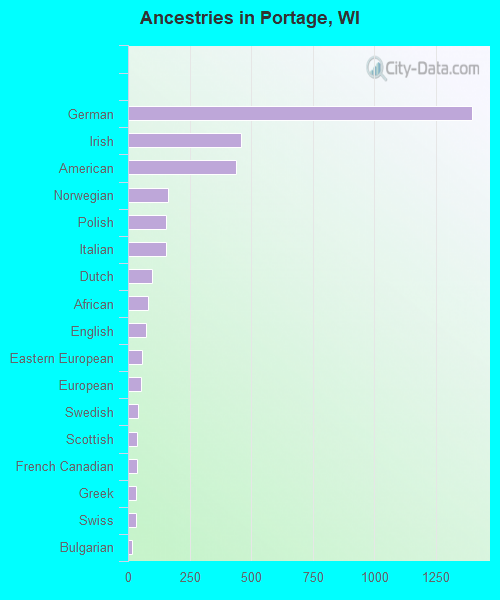
Ancestries in Portage
1,397 31.8% German458 10.4% Irish440 10.0% American161 3.7% Norwegian155 3.5% Polish153 3.5% Italian98 2.2% Dutch80 1.8% African73 1.7% English55 1.3% Eastern European53 1.2% European39 0.9% Swedish38 0.9% Scottish37 0.8% French Canadian33 0.8% Greek33 0.8% Swiss16 0.4% Bulgarian11 0.3% Danish4 0.09% Belgian2 0.05% Russian
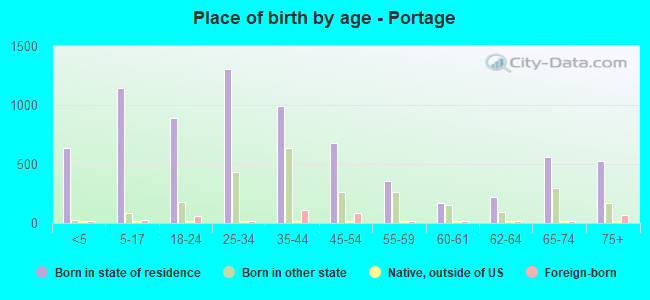
Children Nativity (place of birth) in Portage
Children under 6 years - Living with two parents Both parents native 425 100.0% NativeChildren under 6 years - Living with one parent Native parent 345 100.0% NativeChildren 6 to 17 years - Living with two parents Both parents native 488 94.2% Native30 5.8% Foreign-bornBoth parents foreign-born 20 100.0% NativeOne native, one foreign-born parent 67 100.0% NativeChildren 6 to 17 years - Living with one parent Native parent 486 100.0% Native
Grandparents responsible for own grandchildren in Portage
Grandparents (30 to 59 years) White / Caucasian 6 11.9% Responsible for grandchildren42 88.1% Not responsible for grandchildrenWhite alone, not Hispanic / Latino 6 12.0% Responsible for grandchildren43 88.0% Not responsible for grandchildrenGrandparents (60 years and over) White / Caucasian 16 40.4% Responsible for grandchildren24 59.6% Not responsible for grandchildrenWhite alone, not Hispanic / Latino 17 39.7% Responsible for grandchildren25 60.3% Not responsible for grandchildren