Races in Portland, Maine (ME) Detailed Stats
Data:
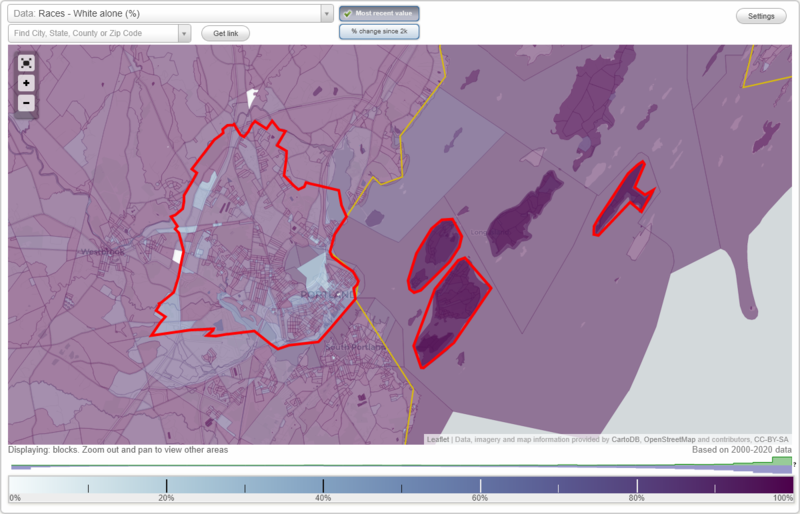
Races - White alone (%)
Races - White alone (% change since 2000)
Races - Black alone (%)
Races - Black alone (% change since 2000)
Races - American Indian alone (%)
Races - American Indian alone (% change since 2000)
Races - Asian alone (%)
Races - Asian alone (% change since 2000)
Races - Hispanic (%)
Races - Hispanic (% change since 2000)
Races - Native Hawaiian and Other Pacific Islander alone (%)
Races - Native Hawaiian and Other Pacific Islander alone (% change since 2000)
Races - Two or more races(%)
Races - Two or more races(% change since 2000)
Races - Other race alone (%)
Races - Other race alone (% change since 2000)
Racial diversity
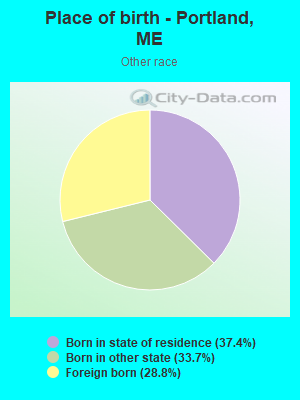
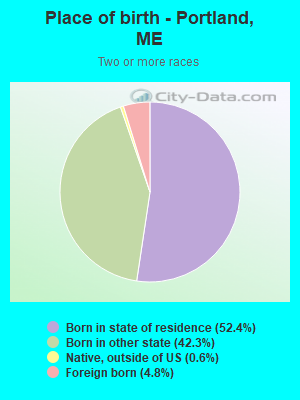
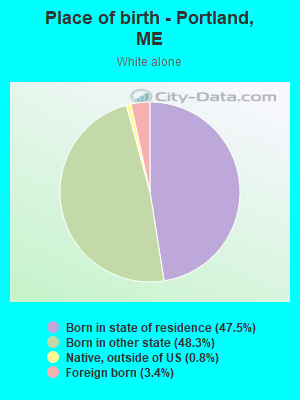
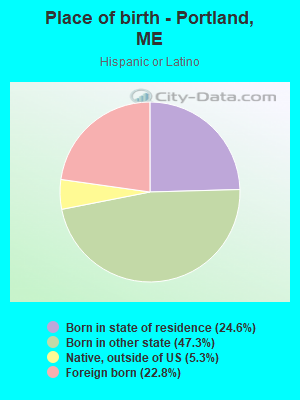
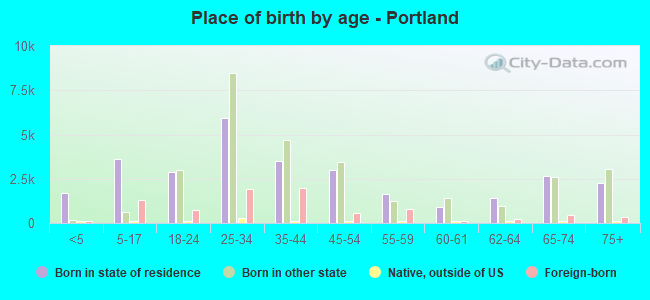
Place of birth - Born in state of residence (%)
Place of birth - Born in state of residence (%) - White
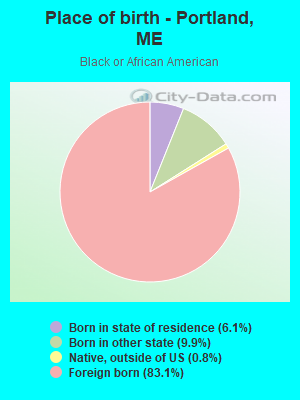
Place of birth - Born in state of residence (%) - Black or African American
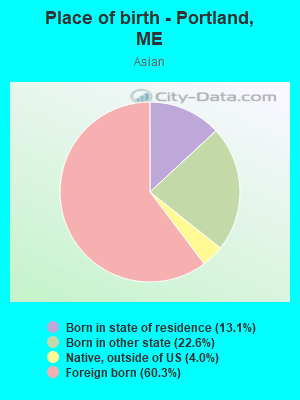
Place of birth - Born in state of residence (%) - Asian
Place of birth - Born in state of residence (%) - Hispanic or Latino
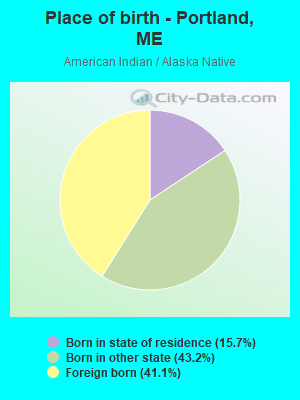
Place of birth - Born in state of residence (%) - American Indian and Alaska Native
Place of birth - Born in state of residence (%) - Multirace
Place of birth - Born in state of residence (%) - Other Race
Place of birth - Born in other state (%)
Place of birth - Born in other state (%) - White
Place of birth - Born in other state (%) - Black or African American
Place of birth - Born in other state (%) - Asian
Place of birth - Born in other state (%) - Hispanic or Latino
Place of birth - Born in other state (%) - American Indian and Alaska Native
Place of birth - Born in other state (%) - Multirace
Place of birth - Born in other state (%) - Other Race
Place of birth - Native, outside of US (%)
Place of birth - Native, outside of US (%) - White
Place of birth - Native, outside of US (%) - Black or African American
Place of birth - Native, outside of US (%) - Asian
Place of birth - Native, outside of US (%) - Hispanic or Latino
Place of birth - Native, outside of US (%) - American Indian and Alaska Native
Place of birth - Native, outside of US (%) - Multirace
Place of birth - Native, outside of US (%) - Other Race
Place of birth - Foreign born (%)
Place of birth - Foreign born (%) - White
Place of birth - Foreign born (%) - Black or African American
Place of birth - Foreign born (%) - Asian
Place of birth - Foreign born (%) - Hispanic or Latino
Place of birth - Foreign born (%) - American Indian and Alaska Native
Place of birth - Foreign born (%) - Multirace
Place of birth - Foreign born (%) - Other Race
Residents speaking English at home (%)
Residents speaking English at home - Born in the United States (%)
Residents speaking English at home - Native, born elsewhere (%)
Residents speaking English at home - Foreign born (%)
Residents speaking Spanish at home (%)
Residents speaking Spanish at home - Born in the United States (%)
Residents speaking Spanish at home - Native, born elsewhere (%)
Residents speaking Spanish at home - Foreign born (%)
Residents speaking other language at home (%)
Residents speaking other language at home - Born in the United States (%)
Residents speaking other language at home - Native, born elsewhere (%)
Residents speaking other language at home - Foreign born (%)
Marital status - Never married (%)
Marital status - Now married (%)
Marital status - Separated (%)
Marital status - Widowed (%)
Marital status - Divorced (%)
Ancestries Reported - Arab (%)
Ancestries Reported - Czech (%)
Ancestries Reported - Danish (%)
Ancestries Reported - Dutch (%)
Ancestries Reported - English (%)
Ancestries Reported - French (%)
Ancestries Reported - French Canadian (%)
Ancestries Reported - German (%)
Ancestries Reported - Greek (%)
Ancestries Reported - Hungarian (%)
Ancestries Reported - Irish (%)
Ancestries Reported - Italian (%)
Ancestries Reported - Lithuanian (%)
Ancestries Reported - Norwegian (%)
Ancestries Reported - Polish (%)
Ancestries Reported - Portuguese (%)
Ancestries Reported - Russian (%)
Ancestries Reported - Scotch-Irish (%)
Ancestries Reported - Scottish (%)
Ancestries Reported - Slovak (%)
Ancestries Reported - Subsaharan African (%)
Ancestries Reported - Swedish (%)
Ancestries Reported - Swiss (%)
Ancestries Reported - Ukrainian (%)
Ancestries Reported - United States (%)
Ancestries Reported - Welsh (%)
Ancestries Reported - West Indian (%)
Ancestries Reported - Other (%)
Geographical mobility - Same house 1 year ago (%)
Geographical mobility - Same house 1 year ago (%) - White
Geographical mobility - Same house 1 year ago (%) - Black or African American
Geographical mobility - Same house 1 year ago (%) - Asian
Geographical mobility - Same house 1 year ago (%) - Hispanic or Latino
Geographical mobility - Same house 1 year ago (%) - American Indian and Alaska Native
Geographical mobility - Same house 1 year ago (%) - Multirace
Geographical mobility - Same house 1 year ago (%) - Other Race
Geographical mobility - Moved within same county (%)
Geographical mobility - Moved within same county (%) - White
Geographical mobility - Moved within same county (%) - Black or African American
Geographical mobility - Moved within same county (%) - Asian
Geographical mobility - Moved within same county (%) - Hispanic or Latino
Geographical mobility - Moved within same county (%) - American Indian and Alaska Native
Geographical mobility - Moved within same county (%) - Multirace
Geographical mobility - Moved within same county (%) - Other Race
Geographical mobility - Moved from different county within same state (%)
Geographical mobility - Moved from different county within same state (%) - White
Geographical mobility - Moved from different county within same state (%) - Black or African American
Geographical mobility - Moved from different county within same state (%) - Asian
Geographical mobility - Moved from different county within same state (%) - Hispanic or Latino
Geographical mobility - Moved from different county within same state (%) - American Indian and Alaska Native
Geographical mobility - Moved from different county within same state (%) - Multirace
Geographical mobility - Moved from different county within same state (%) - Other Race
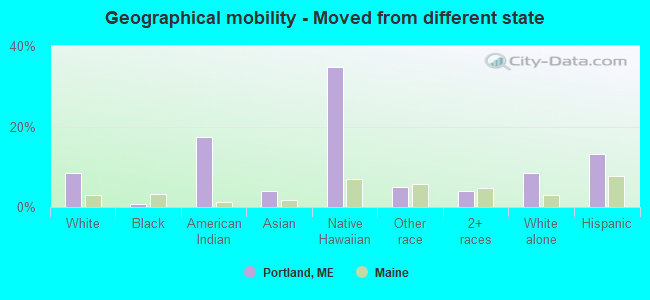
Geographical mobility - Moved from different state (%)
Geographical mobility - Moved from different state (%) - White
Geographical mobility - Moved from different state (%) - Black or African American
Geographical mobility - Moved from different state (%) - Asian
Geographical mobility - Moved from different state (%) - Hispanic or Latino
Geographical mobility - Moved from different state (%) - American Indian and Alaska Native
Geographical mobility - Moved from different state (%) - Multirace
Geographical mobility - Moved from different state (%) - Other Race
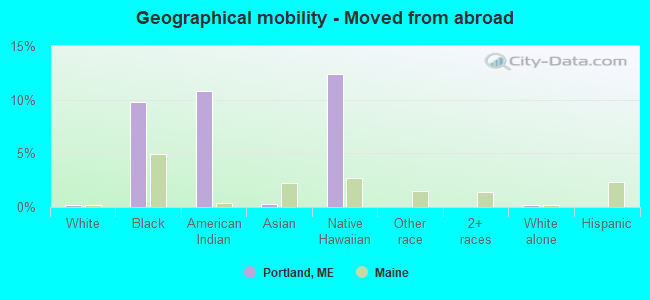
Geographical mobility - Moved from abroad (%)
Geographical mobility - Moved from abroad (%) - White
Geographical mobility - Moved from abroad (%) - Black or African American
Geographical mobility - Moved from abroad (%) - Asian
Geographical mobility - Moved from abroad (%) - Hispanic or Latino
Geographical mobility - Moved from abroad (%) - American Indian and Alaska Native
Geographical mobility - Moved from abroad (%) - Multirace
Geographical mobility - Moved from abroad (%) - Other Race
Place of birth for the foreign-born population - Ireland (%)
Place of birth for the foreign-born population - Denmark (%)
Place of birth for the foreign-born population - Norway (%)
Place of birth for the foreign-born population - Sweden (%)
Place of birth for the foreign-born population - United Kingdom (%)
Place of birth for the foreign-born population - England (%)
Place of birth for the foreign-born population - Scotland (%)
Place of birth for the foreign-born population - Other Northern Europe (%)
Place of birth for the foreign-born population - Austria (%)
Place of birth for the foreign-born population - Belgium (%)
Place of birth for the foreign-born population - France (%)
Place of birth for the foreign-born population - Germany (%)
Place of birth for the foreign-born population - Netherlands (%)
Place of birth for the foreign-born population - Switzerland (%)
Place of birth for the foreign-born population - Other Western Europe (%)
Place of birth for the foreign-born population - Greece (%)
Place of birth for the foreign-born population - Italy (%)
Place of birth for the foreign-born population - Portugal (%)
Place of birth for the foreign-born population - Spain (%)
Place of birth for the foreign-born population - Other Southern Europe (%)
Place of birth for the foreign-born population - Albania (%)
Place of birth for the foreign-born population - Belarus (%)
Place of birth for the foreign-born population - Bosnia and Herzegovina (%)
Place of birth for the foreign-born population - Bulgaria (%)
Place of birth for the foreign-born population - Croatia (%)
Place of birth for the foreign-born population - Czechoslovakia (%)
Place of birth for the foreign-born population - Hungary (%)
Place of birth for the foreign-born population - Latvia (%)
Place of birth for the foreign-born population - Lithuania (%)
Place of birth for the foreign-born population - North Macedonia (Macedonia) (%)
Place of birth for the foreign-born population - Moldova (%)
Place of birth for the foreign-born population - Poland (%)
Place of birth for the foreign-born population - Romania (%)
Place of birth for the foreign-born population - Russia (%)
Place of birth for the foreign-born population - Serbia (%)
Place of birth for the foreign-born population - Ukraine (%)
Place of birth for the foreign-born population - Other Eastern Europe (%)
Place of birth for the foreign-born population - China (%)
Place of birth for the foreign-born population - Hong Kong (%)
Place of birth for the foreign-born population - Taiwan (%)
Place of birth for the foreign-born population - Japan (%)
Place of birth for the foreign-born population - Korea (%)
Place of birth for the foreign-born population - Other Eastern Asia (%)
Place of birth for the foreign-born population - Afghanistan (%)
Place of birth for the foreign-born population - Bangladesh (%)
Place of birth for the foreign-born population - India (%)
Place of birth for the foreign-born population - Iran (%)
Place of birth for the foreign-born population - Kazakhstan (%)
Place of birth for the foreign-born population - Nepal (%)
Place of birth for the foreign-born population - Pakistan (%)
Place of birth for the foreign-born population - Sri Lanka (%)
Place of birth for the foreign-born population - Uzbekistan (%)
Place of birth for the foreign-born population - Other South Central Asia (%)
Place of birth for the foreign-born population - Burma (%)
Place of birth for the foreign-born population - Cambodia (%)
Place of birth for the foreign-born population - Indonesia (%)
Place of birth for the foreign-born population - Laos (%)
Place of birth for the foreign-born population - Malaysia (%)
Place of birth for the foreign-born population - Philippines (%)
Place of birth for the foreign-born population - Singapore (%)
Place of birth for the foreign-born population - Thailand (%)
Place of birth for the foreign-born population - Vietnam (%)
Place of birth for the foreign-born population - Other South Eastern Asia (%)
Place of birth for the foreign-born population - Armenia (%)
Place of birth for the foreign-born population - Iraq (%)
Place of birth for the foreign-born population - Israel (%)
Place of birth for the foreign-born population - Jordan (%)
Place of birth for the foreign-born population - Kuwait (%)
Place of birth for the foreign-born population - Lebanon (%)
Place of birth for the foreign-born population - Saudi Arabia (%)
Place of birth for the foreign-born population - Syria (%)
Place of birth for the foreign-born population - Turkey (%)
Place of birth for the foreign-born population - Yemen (%)
Place of birth for the foreign-born population - Other Western Asia (%)
Place of birth for the foreign-born population - Eritrea (%)
Place of birth for the foreign-born population - Ethiopia (%)
Place of birth for the foreign-born population - Kenya (%)
Place of birth for the foreign-born population - Somalia (%)
Place of birth for the foreign-born population - Uganda (%)
Place of birth for the foreign-born population - Zimbabwe (%)
Place of birth for the foreign-born population - Other Eastern Africa (%)
Place of birth for the foreign-born population - Cameroon (%)
Place of birth for the foreign-born population - Congo (%)
Place of birth for the foreign-born population - Democratic Republic of Congo (Zaire) (%)
Place of birth for the foreign-born population - Other Middle Africa (%)
Place of birth for the foreign-born population - Egypt (%)
Place of birth for the foreign-born population - Morocco (%)
Place of birth for the foreign-born population - Sudan (%)
Place of birth for the foreign-born population - Other Northern Africa (%)
Place of birth for the foreign-born population - South Africa (%)
Place of birth for the foreign-born population - Other Southern Africa (%)
Place of birth for the foreign-born population - Cabo Verde (%)
Place of birth for the foreign-born population - Ghana (%)
Place of birth for the foreign-born population - Liberia (%)
Place of birth for the foreign-born population - Nigeria (%)
Place of birth for the foreign-born population - Senegal (%)
Place of birth for the foreign-born population - Sierra Leone (%)
Place of birth for the foreign-born population - Other Western Africa (%)
Place of birth for the foreign-born population - Australia (%)
Place of birth for the foreign-born population - New Zealand (%)
Place of birth for the foreign-born population - Fiji (%)
Place of birth for the foreign-born population - Micronesia (%)
Place of birth for the foreign-born population - Bahamas (%)
Place of birth for the foreign-born population - Barbados (%)
Place of birth for the foreign-born population - Cuba (%)
Place of birth for the foreign-born population - Dominica (%)
Place of birth for the foreign-born population - Dominican Republic (%)
Place of birth for the foreign-born population - Grenada (%)
Place of birth for the foreign-born population - Haiti (%)
Place of birth for the foreign-born population - Jamaica (%)
Place of birth for the foreign-born population - St. Vincent and the Grenadines (%)
Place of birth for the foreign-born population - Trinidad and Tobago (%)
Place of birth for the foreign-born population - West Indies (%)
Place of birth for the foreign-born population - Other Caribbean (%)
Place of birth for the foreign-born population - Belize (%)
Place of birth for the foreign-born population - Costa Rica (%)
Place of birth for the foreign-born population - El Salvador (%)
Place of birth for the foreign-born population - Guatemala (%)
Place of birth for the foreign-born population - Honduras (%)
Place of birth for the foreign-born population - Mexico (%)
Place of birth for the foreign-born population - Nicaragua (%)
Place of birth for the foreign-born population - Panama (%)
Place of birth for the foreign-born population - Other Central America (%)
Place of birth for the foreign-born population - Argentina (%)
Place of birth for the foreign-born population - Bolivia (%)
Place of birth for the foreign-born population - Brazil (%)
Place of birth for the foreign-born population - Chile (%)
Place of birth for the foreign-born population - Colombia (%)
Place of birth for the foreign-born population - Ecuador (%)
Place of birth for the foreign-born population - Guyana (%)
Place of birth for the foreign-born population - Peru (%)
Place of birth for the foreign-born population - Uruguay (%)
Place of birth for the foreign-born population - Venezuela (%)
Place of birth for the foreign-born population - Other South America (%)
Place of birth for the foreign-born population - Canada (%)
Place of birth for the foreign-born population - Other Northern America (%)
Place of birth for the foreign-born population - Other (%)
Latest news about races in Portland, ME collected exclusively by city-data.com from local newspapers, TV, and radio stations
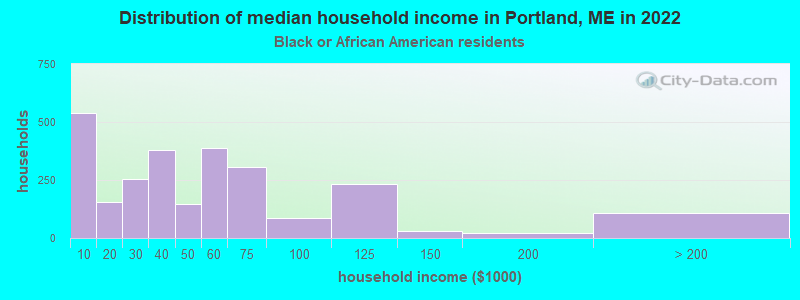
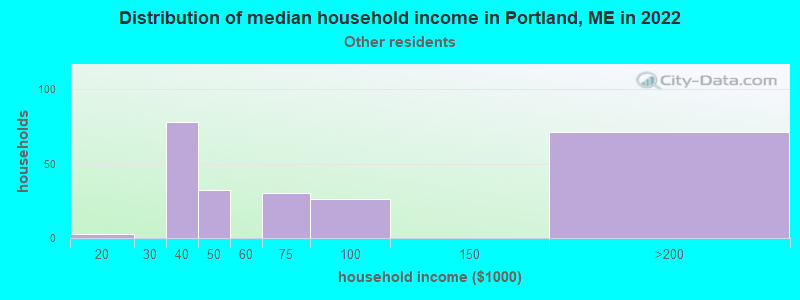
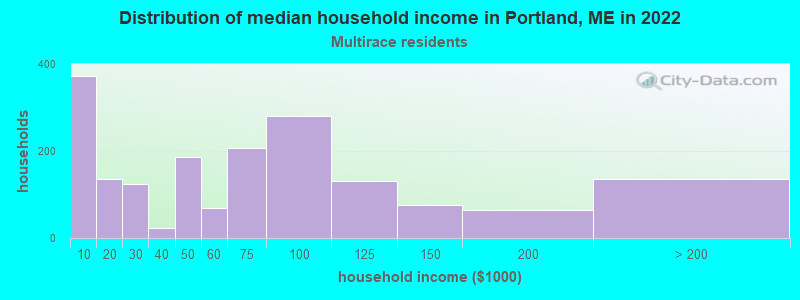
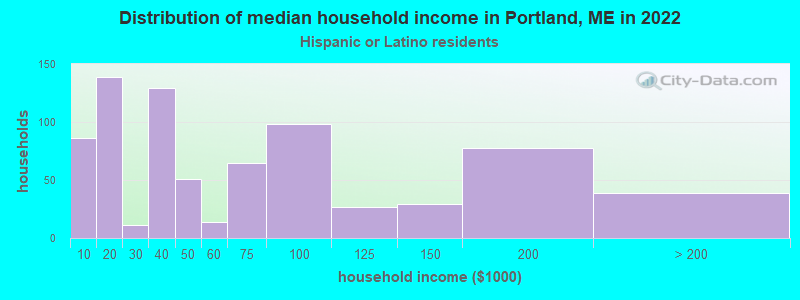
According to 2022 data, the most numerous races in Portland, ME are White alone (53,303 residents), Two or more races (4,428 residents), and Hispanic (2,108 residents). 87.6% of Portland residents speak English at home. 10.9% of Portland, ME residents are foreign-born (5.5% born in Africa, 2.9% born in Asia, 1.5% born in Europe), which is 72.5% greater than the foreign-born rate of 3.0% across the entire state of Maine.
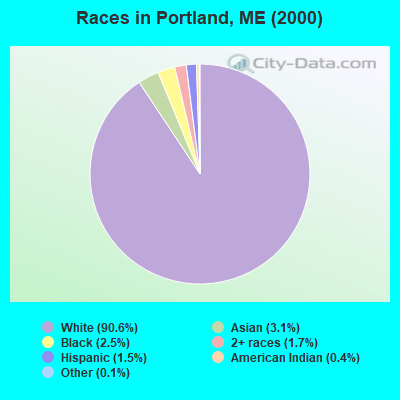
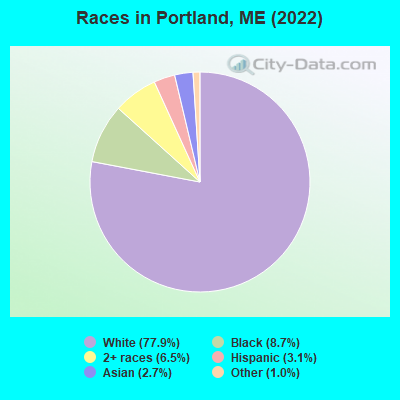
Race distribution in Portland
2000 2022
1,230,297 96.5% White alone 11,731 0.9% Two or more races 9,360 0.7% Hispanic 9,014 0.7% Asian alone 6,440 0.5% Black alone 6,911 0.5% American Indian alone 836 0.07% Other race alone 334 0.03% Native Hawaiian and Other
1,249,233 90.2% White alone 58,357 4.2% Two or more races 28,717 2.1% Hispanic 21,583 1.6% Black alone 16,151 1.2% Asian alone 5,873 0.4% Other race alone 5,205 0.4% American Indian alone 221 0.02% Native Hawaiian and Other
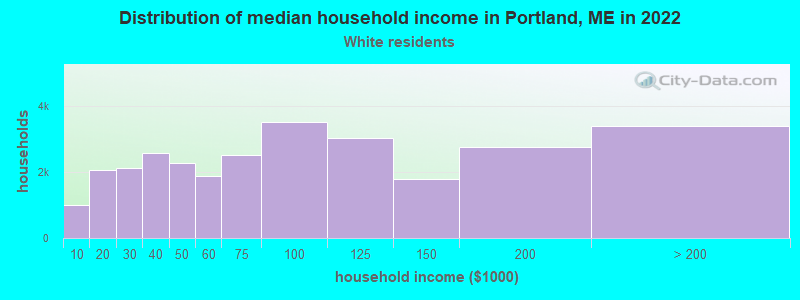
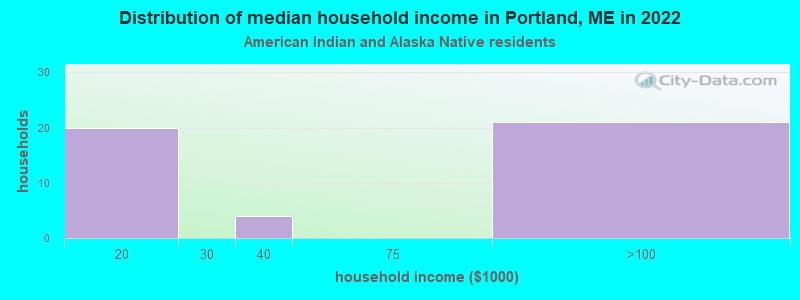
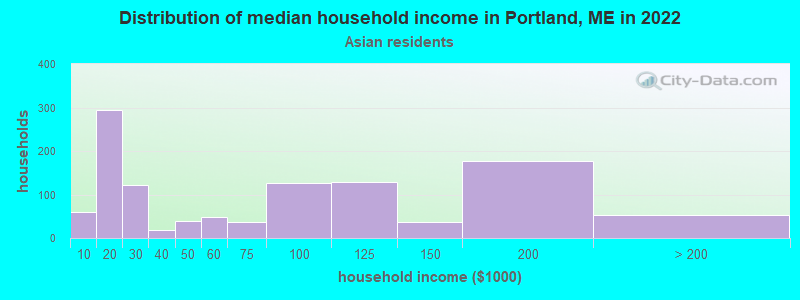
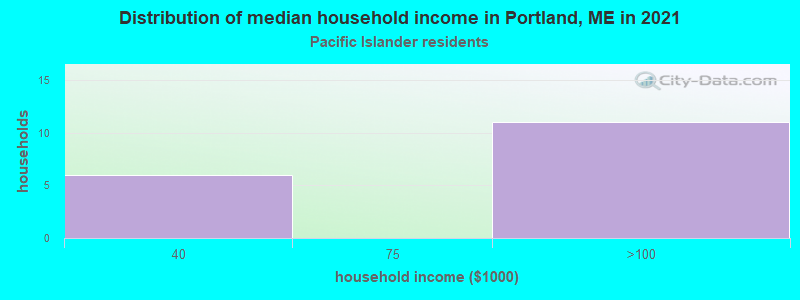
Income and house value in Portland Median household income in 2022 $75,428 White non-Hispanic householders$53,268 Black householders$110,758 Asian householders$146,393 Some other race householders$48,869 Two or more races householders$61,528 Hispanic or Latino race householdersMedian 2022 house value $448,188 White Non-Hispanic householders$379,378 Black or African American householdersover $1,000,000 American Indian or Alaska Native householders $376,802 Asian householders$137,989 Some other race householders$382,690 Two or more races householdersover $1,000,000 Hispanic or Latino householders
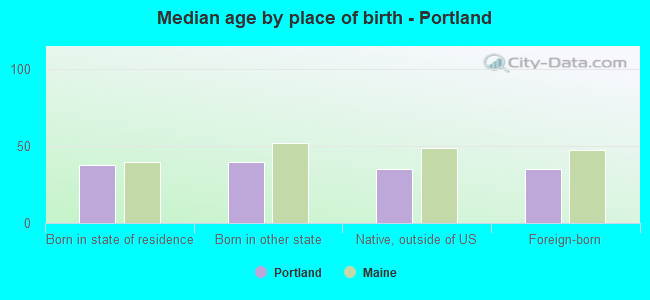
Median age by race in Portland
39.5 Median age for White residents38.3 41.7 28.8 Median age for Black or African American residents34.2 27.3 -666,666,666.0 Median age for American Indian / Alaska Native residents-666,666,666.0 -666,666,666.0 40.2 Median age for Asian residents40.1 47.1 -666,666,666.0 Median age for Native Hawaiian / Pacific Islander residents-666,666,666.0 -666,666,666.0 23.5 Median age for Other race residents22.4 24.3 41.1 Median age for Two or more races residents41.5 37.5 39.5 Median age for White alone residents37.9 41.6 36.9 Median age for Hispanic or Latino residents38.6 36.4
Owner/renter occupied households by race in Portland
House owners and renters - White residents 13,747 47.4% Owner occupied15,262 52.6% Renter occupiedHouse owners and renters - Black or African American residents 191 7.1% Owner occupied2,483 92.9% Renter occupiedHouse owners and renters - American Indian / Alaska Native residents 12 25.6% Owner occupied34 74.4% Renter occupiedHouse owners and renters - Asian residents 375 47.6% Owner occupied412 52.4% Renter occupiedHouse owners and renters - Native Hawaiian / Pacific Islander residents 21 72.9% Owner occupied8 27.1% Renter occupiedHouse owners and renters - Other race residents 72 29.7% Owner occupied172 70.3% Renter occupiedHouse owners and renters - Two or more races residents 521 19.8% Owner occupied2,110 80.2% Renter occupiedHouse owners and renters - White alone residents 13,747 48.0% Owner occupied14,886 52.0% Renter occupiedHouse owners and renters - Hispanic or Latino residents 331 32.0% Owner occupied702 68.0% Renter occupied
Language usage in Portland
English speakers - Total 87.6% of residents of Portland speak English at home.
1.0% of residents speak Spanish at home 558 83.7% Speak English very well109 16.3% Speak English less than very well11.6% of residents speak other language at home 4,479 58.0% Speak English very well3,242 42.0% Speak English less than very well
English speakers - Born in the United States 96.6% of residents of Portland speak English at home.
1.0% of residents speak Spanish at home 234 82.4% Speak English very well50 17.6% Speak English less than very well2.2% of residents speak other language at home 577 91.4% Speak English very well54 8.6% Speak English less than very well
English speakers - Native, born elsewhere 55.4% of residents of Portland speak English at home.
4.3% of residents speak Spanish at home 40 100.0% Speak English very well49.5% of residents speak other language at home 258 55.8% Speak English very well204 44.2% Speak English less than very well
English speakers - Foreign-born 27.1% of residents of Portland speak English at home.
2.5% of residents speak Spanish at home 145 67.1% Speak English very well71 32.9% Speak English less than very well69.2% of residents speak other language at home 3,290 54.1% Speak English very well2,787 45.9% Speak English less than very well
White (Caucasian) - Speak only English Native:
97.1% (49,318)Foreign-born:
56.8% (1,024)
White (Caucasian) - Speak another language Native:
2.9% (1,483)Foreign-born:
43.2% (779)
Black or African American - Speak only English Native:
99.9% (788)Foreign-born:
12.2% (607)
Black or African American - Speak another language Native:
0.1% (1)Foreign-born:
87.8% (4,354)
American Indian / Alaska Native - Speak only English Native:
83.5% (59)Foreign-born:
13.0% (5)
American Indian / Alaska Native - Speak another language Native:
13.8% (10)Foreign-born:
85.8% (34)
Asian - Speak only English Native:
72.4% (531)Foreign-born:
22.2% (247)
Asian - Speak another language Native:
27.6% (202)Foreign-born:
77.8% (865)
Other race - Speak only English Native:
66.5% (331)Foreign-born:
39.2% (103)
Other race - Speak another language Native:
31.2% (156)Foreign-born:
60.8% (160)
Two or more races - Speak only English Native:
94.8% (2,686)Foreign-born:
80.0% (210)
Two or more races - Speak another language Native:
5.0% (143)Foreign-born:
29.5% (78)
White alone - Speak only English Native:
97.2% (48,904)Foreign-born:
56.8% (1,024)
White alone - Speak another language Native:
2.8% (1,418)Foreign-born:
43.2% (779)
Hispanic or Latino - Speak only English Native:
85.0% (1,348)Foreign-born:
45.0% (216)
Hispanic or Latino - Speak another language Native:
15.0% (238)Foreign-born:
55.0% (264)
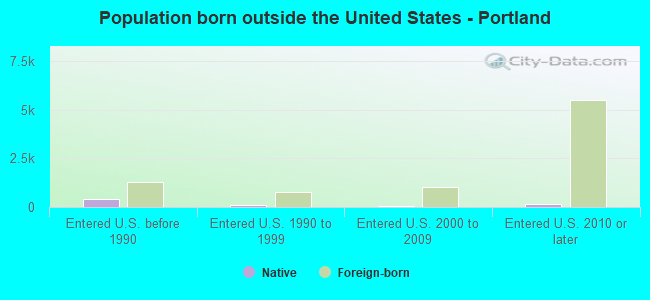
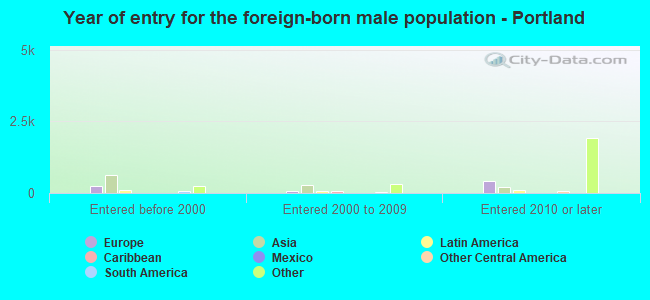
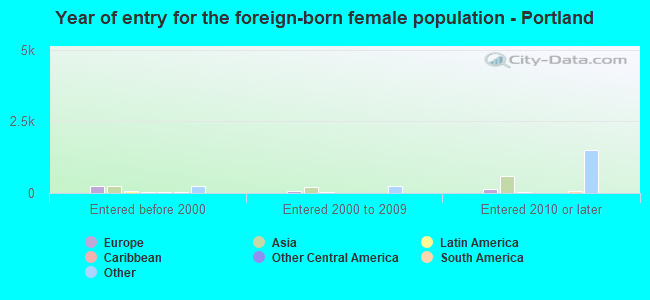
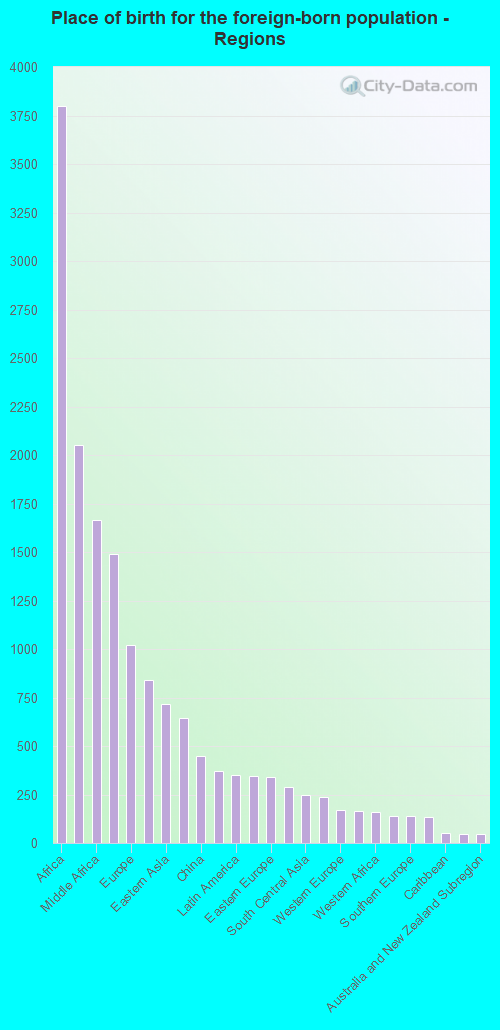
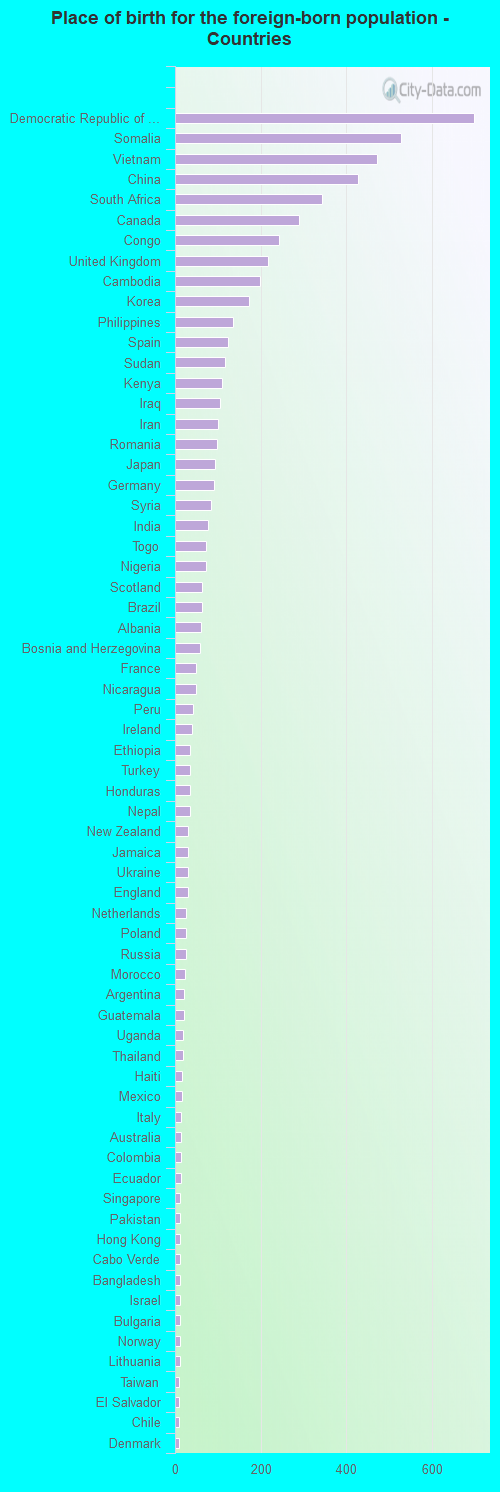
Foreign-born residents in Portland 7,561 residents are foreign born (5.5% Africa , 2.9% Asia , 1.5% Europe ).
This city:
10.9%Maine:
3.8%
Marital status for residents in Portland Marital status - White (Caucasian) population 15 years and over
Males 53.1% Never married37.9% Now married0.4% Separated1.2% Widowed7.4% DivorcedFemales 44.2% Never married35.8% Now married0.5% Separated9.2% Widowed10.2% DivorcedWomen who gave birth in the past 12 months Now married:
76.3% (641)Unmarried:
23.7% (199)
Women who did not give birth in the past 12 months Now married:
24.0% (3,158)Unmarried:
76.0% (9,998)
Marital status - Black or African American population 15 years and over
Males 50.9% Never married40.5% Now married0.5% Separated1.0% Widowed7.1% DivorcedFemales 32.8% Never married37.6% Now married1.9% Separated9.3% Widowed18.5% DivorcedWomen who gave birth in the past 12 months Now married:
100.0% (321)Unmarried:
0.0% (0)
Women who did not give birth in the past 12 months Now married:
46.3% (732)Unmarried:
53.7% (849)
Marital status - American Indian / Alaska Native population 15 years and over
Males 59.4% Never married21.9% Now married0.0% Separated0.0% Widowed18.8% DivorcedFemales 0.0% Never married56.0% Now married0.0% Separated0.0% Widowed44.0% DivorcedWomen who did not give birth in the past 12 months Now married:
100.0% (8)Unmarried:
0.0% (0)
Marital status - Asian population 15 years and over
Males 52.4% Never married31.1% Now married0.0% Separated0.4% Widowed16.0% DivorcedFemales 34.5% Never married48.9% Now married5.6% Separated5.5% Widowed5.4% DivorcedWomen who did not give birth in the past 12 months Now married:
53.7% (389)Unmarried:
46.3% (336)
Marital status - Native Hawaiian / Pacific Islander population 15 years and over
Males 26.9% Never married73.1% Now married0.0% Separated0.0% Widowed0.0% DivorcedFemales 0.0% Never married100.0% Now married0.0% Separated0.0% Widowed0.0% DivorcedWomen who did not give birth in the past 12 months Now married:
100.0% (15)Unmarried:
0.0% (0)
Marital status - Other race population 15 years and over
Males 29.5% Never married55.6% Now married0.0% Separated12.3% Widowed2.6% DivorcedFemales 46.1% Never married29.3% Now married0.0% Separated3.5% Widowed21.1% DivorcedWomen who gave birth in the past 12 months Now married:
85.7% (16)Unmarried:
14.3% (3)
Women who did not give birth in the past 12 months Now married:
23.0% (83)Unmarried:
77.0% (280)
Marital status - Two or more races population 15 years and over
Males 67.3% Never married24.5% Now married0.0% Separated2.5% Widowed5.7% DivorcedFemales 51.1% Never married28.5% Now married2.2% Separated1.2% Widowed17.0% DivorcedWomen who did not give birth in the past 12 months Now married:
28.0% (309)Unmarried:
72.0% (794)
Marital status - White alone, not Hispanic / Latino population 15 years and over
Males 53.3% Never married37.9% Now married0.4% Separated1.2% Widowed7.2% DivorcedFemales 43.8% Never married36.3% Now married0.5% Separated9.3% Widowed10.0% DivorcedWomen who gave birth in the past 12 months Now married:
76.3% (641)Unmarried:
23.7% (199)
Women who did not give birth in the past 12 months Now married:
24.3% (3,158)Unmarried:
75.7% (9,857)
Marital status - Hispanic or Latino population 15 years and over
Males 48.8% Never married44.3% Now married0.0% Separated0.0% Widowed6.8% DivorcedFemales 48.0% Never married27.1% Now married0.0% Separated1.1% Widowed23.8% DivorcedWomen who gave birth in the past 12 months Now married:
85.7% (13)Unmarried:
14.3% (2)
Women who did not give birth in the past 12 months Now married:
22.1% (110)Unmarried:
77.9% (388)
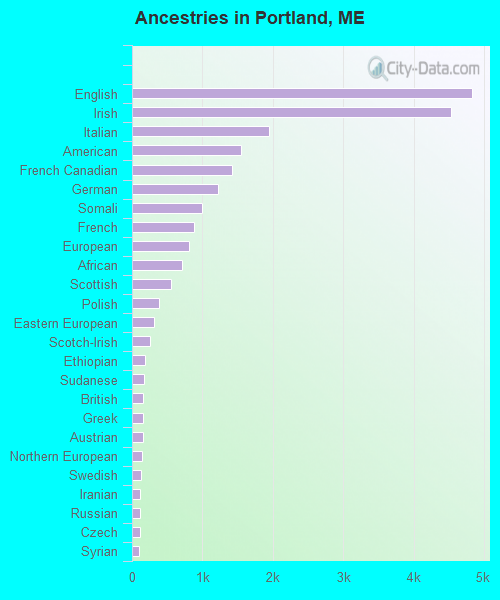
Ancestries in Portland
4,825 16.1% English4,529 15.1% Irish1,948 6.5% Italian1,550 5.2% American1,422 4.8% French Canadian1,225 4.1% German994 3.3% Somali884 3.0% French804 2.7% European716 2.4% African555 1.9% Scottish387 1.3% Polish314 1.0% Eastern European259 0.9% Scotch-Irish178 0.6% Ethiopian174 0.6% Sudanese163 0.5% British161 0.5% Greek156 0.5% Austrian149 0.5% Northern European133 0.4% Swedish115 0.4% Iranian115 0.4% Russian108 0.4% Czech105 0.4% Syrian99 0.3% Iraqi97 0.3% Danish97 0.3% Welsh94 0.3% Scandinavian92 0.3% South African90 0.3% Finnish88 0.3% Dutch87 0.3% Lithuanian83 0.3% Romanian77 0.3% Brazilian75 0.3% Portuguese67 0.2% Canadian64 0.2% Norwegian60 0.2% Albanian57 0.2% Ukrainian48 0.2% Swiss46 0.2% Jamaican37 0.1% Lebanese28 0.09% Turkish27 0.09% Ugandan27 0.09% Estonian23 0.08% Haitian22 0.07% Yugoslavian21 0.07% Australian19 0.06% Cajun15 0.05% Hungarian14 0.05% Nigerian14 0.05% Serbian12 0.04% U.S. Virgin Islander11 0.04% Cape Verdean10 0.03% Bulgarian10 0.03% Israeli10 0.03% Arab9 0.03% Celtic8 0.03% Czechoslovakian7 0.02% Armenian3 0.01% Trinidadian and Tobagonian
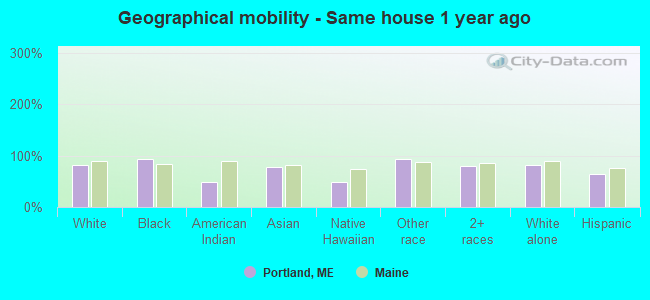
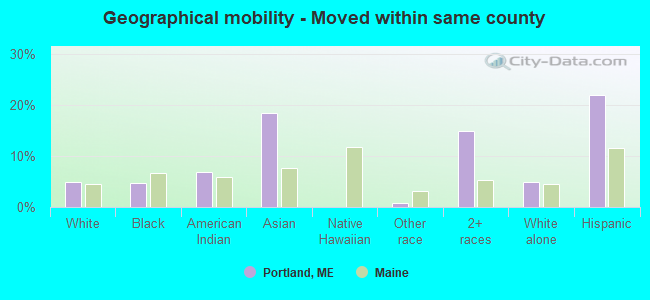
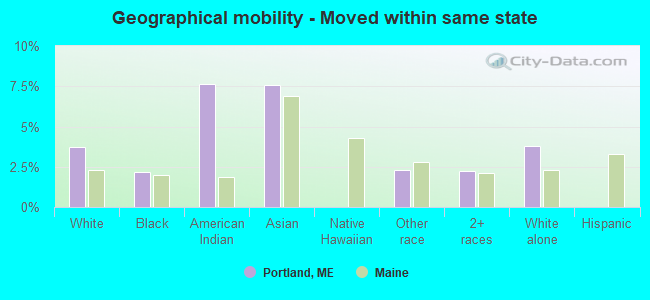
Geographical mobility in Portland Same house 1 year ago 44,035 82.6% White (Caucasian)5,608 93.5% Black or African American46 47.9% American Indian / Alaska Native1,941 78.7% Asian20 48.0% Native Hawaiian / Pacific Islander758 93.5% Other race2,700 79.9% Two or more races43,697 82.7% White alone, not Hispanic / Latino1,370 65.0% Hispanic or LatinoMoved within same county 2,603 4.9% White / Caucasian283 4.7% Black or African American7 6.9% American Indian / Alaska Native452 18.3% Asian7 0.8% Other race503 14.9% Two or more races2,560 4.8% White alone, not Hispanic / Latino461 21.9% Hispanic or LatinoMoved within same state 1,992 3.7% White / Caucasian132 2.2% Black or African American7 7.6% American Indian / Alaska Native187 7.6% Asian18 2.3% Other race75 2.2% Two or more races1,992 3.8% White alone, not Hispanic / LatinoMoved from different state 4,559 8.6% White / Caucasian49 0.8% Black or African American17 17.5% American Indian / Alaska Native96 3.9% Asian15 34.8% Native Hawaiian / Pacific Islander40 4.9% Other race134 4.0% Two or more races4,461 8.4% White alone, not Hispanic / Latino277 13.1% Hispanic or LatinoMoved from abroad 104 0.2% White589 9.8% Black or African American10 10.8% American Indian / Alaska Native7 0.3% Asian5 12.4% Native Hawaiian / Pacific Islander104 0.2% White alone, not Hispanic / Latino
Children Nativity (place of birth) in Portland
Children under 6 years - Living with two parents Both parents native 1,991 100.0% NativeBoth parents foreign-born 286 77.5% Native83 22.5% Foreign-bornOne native, one foreign-born parent 280 88.9% Native35 11.1% Foreign-bornChildren under 6 years - Living with one parent Native parent 608 100.0% NativeForeign-born parent 261 65.7% Native136 34.3% Foreign-bornChildren 6 to 17 years - Living with two parents Both parents native 2,845 96.5% Native103 3.5% Foreign-bornBoth parents foreign-born 272 23.5% Native888 76.5% Foreign-bornOne native, one foreign-born parent 342 100.0% NativeChildren 6 to 17 years - Living with one parent Native parent 747 56.2% Native583 43.8% Foreign-bornForeign-born parent 736 79.3% Native192 20.7% Foreign-born
Grandparents responsible for own grandchildren in Portland
Grandparents (30 to 59 years) White / Caucasian 274 90.7% Responsible for grandchildren28 9.3% Not responsible for grandchildrenWhite alone, not Hispanic / Latino 274 90.7% Responsible for grandchildren28 9.3% Not responsible for grandchildren
Grandparents (60 years and over) White / Caucasian 235 100.0% Not responsible for grandchildrenWhite alone, not Hispanic / Latino 237 100.0% Not responsible for grandchildren