Races in Post Falls, Idaho (ID) Detailed Stats
Data:
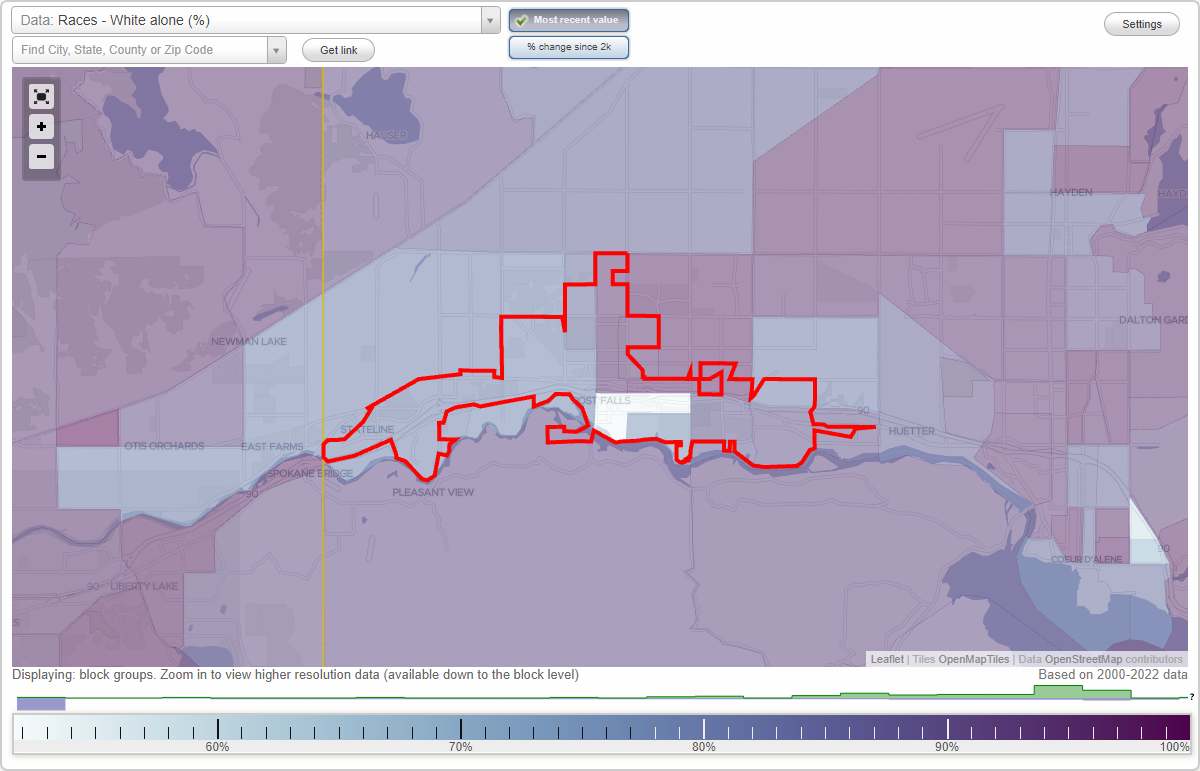
Races - White alone (%)
Races - White alone (% change since 2000)
Races - Black alone (%)
Races - Black alone (% change since 2000)
Races - American Indian alone (%)
Races - American Indian alone (% change since 2000)
Races - Asian alone (%)
Races - Asian alone (% change since 2000)
Races - Hispanic (%)
Races - Hispanic (% change since 2000)
Races - Native Hawaiian and Other Pacific Islander alone (%)
Races - Native Hawaiian and Other Pacific Islander alone (% change since 2000)
Races - Two or more races(%)
Races - Two or more races(% change since 2000)
Races - Other race alone (%)
Races - Other race alone (% change since 2000)
Racial diversity
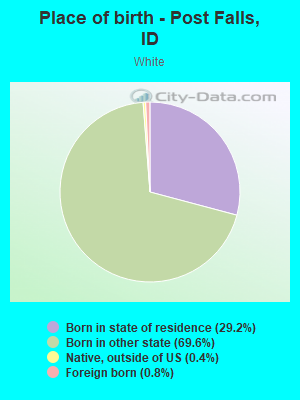
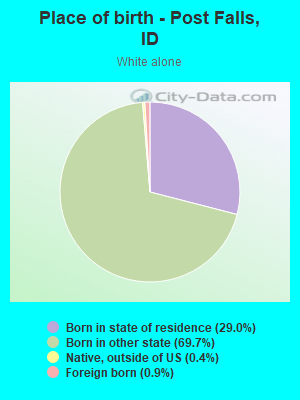
Place of birth - Born in state of residence (%)
Place of birth - Born in state of residence (%) - White
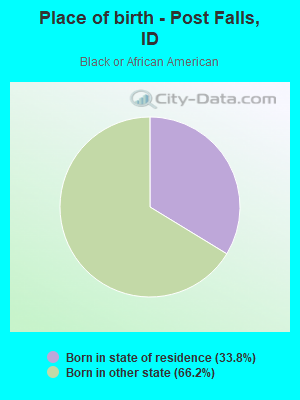
Place of birth - Born in state of residence (%) - Black or African American
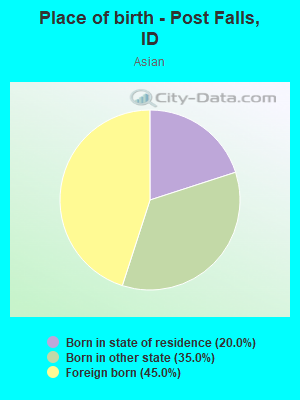
Place of birth - Born in state of residence (%) - Asian
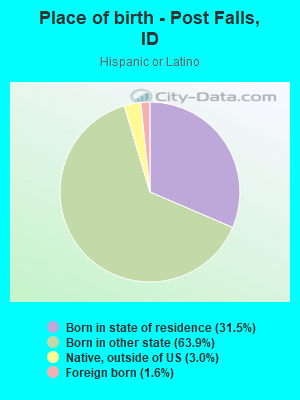
Place of birth - Born in state of residence (%) - Hispanic or Latino
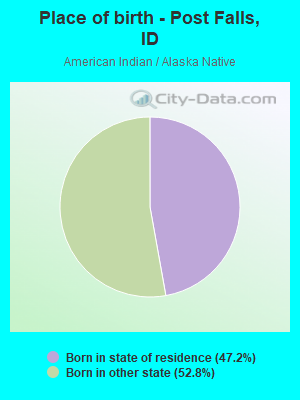
Place of birth - Born in state of residence (%) - American Indian and Alaska Native
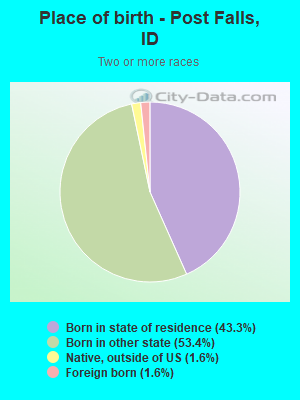
Place of birth - Born in state of residence (%) - Multirace
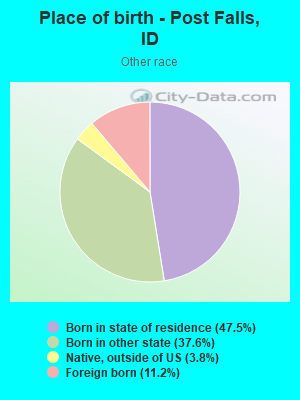
Place of birth - Born in state of residence (%) - Other Race
Place of birth - Born in other state (%)
Place of birth - Born in other state (%) - White
Place of birth - Born in other state (%) - Black or African American
Place of birth - Born in other state (%) - Asian
Place of birth - Born in other state (%) - Hispanic or Latino
Place of birth - Born in other state (%) - American Indian and Alaska Native
Place of birth - Born in other state (%) - Multirace
Place of birth - Born in other state (%) - Other Race
Place of birth - Native, outside of US (%)
Place of birth - Native, outside of US (%) - White
Place of birth - Native, outside of US (%) - Black or African American
Place of birth - Native, outside of US (%) - Asian
Place of birth - Native, outside of US (%) - Hispanic or Latino
Place of birth - Native, outside of US (%) - American Indian and Alaska Native
Place of birth - Native, outside of US (%) - Multirace
Place of birth - Native, outside of US (%) - Other Race
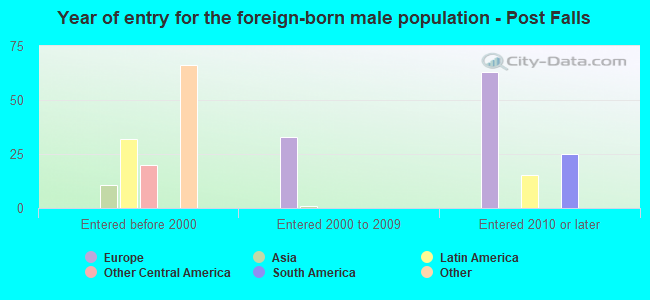
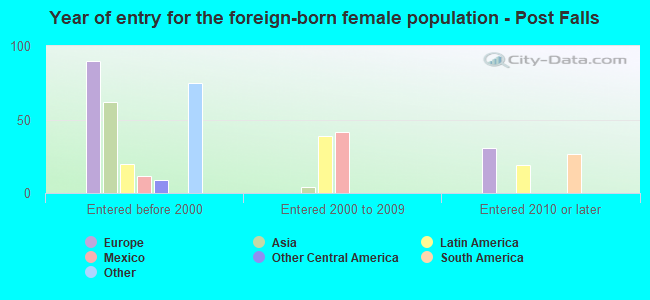
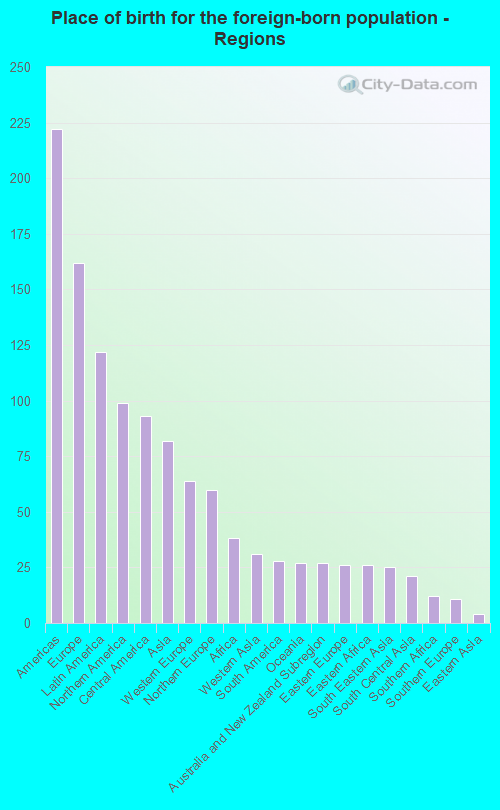
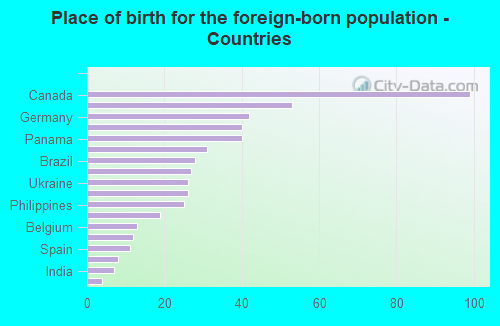
Place of birth - Foreign born (%)
Place of birth - Foreign born (%) - White
Place of birth - Foreign born (%) - Black or African American
Place of birth - Foreign born (%) - Asian
Place of birth - Foreign born (%) - Hispanic or Latino
Place of birth - Foreign born (%) - American Indian and Alaska Native
Place of birth - Foreign born (%) - Multirace
Place of birth - Foreign born (%) - Other Race
Residents speaking English at home (%)
Residents speaking English at home - Born in the United States (%)
Residents speaking English at home - Native, born elsewhere (%)
Residents speaking English at home - Foreign born (%)
Residents speaking Spanish at home (%)
Residents speaking Spanish at home - Born in the United States (%)
Residents speaking Spanish at home - Native, born elsewhere (%)
Residents speaking Spanish at home - Foreign born (%)
Residents speaking other language at home (%)
Residents speaking other language at home - Born in the United States (%)
Residents speaking other language at home - Native, born elsewhere (%)
Residents speaking other language at home - Foreign born (%)
Marital status - Never married (%)
Marital status - Now married (%)
Marital status - Separated (%)
Marital status - Widowed (%)
Marital status - Divorced (%)
Ancestries Reported - Arab (%)
Ancestries Reported - Czech (%)
Ancestries Reported - Danish (%)
Ancestries Reported - Dutch (%)
Ancestries Reported - English (%)
Ancestries Reported - French (%)
Ancestries Reported - French Canadian (%)
Ancestries Reported - German (%)
Ancestries Reported - Greek (%)
Ancestries Reported - Hungarian (%)
Ancestries Reported - Irish (%)
Ancestries Reported - Italian (%)
Ancestries Reported - Lithuanian (%)
Ancestries Reported - Norwegian (%)
Ancestries Reported - Polish (%)
Ancestries Reported - Portuguese (%)
Ancestries Reported - Russian (%)
Ancestries Reported - Scotch-Irish (%)
Ancestries Reported - Scottish (%)
Ancestries Reported - Slovak (%)
Ancestries Reported - Subsaharan African (%)
Ancestries Reported - Swedish (%)
Ancestries Reported - Swiss (%)
Ancestries Reported - Ukrainian (%)
Ancestries Reported - United States (%)
Ancestries Reported - Welsh (%)
Ancestries Reported - West Indian (%)
Ancestries Reported - Other (%)
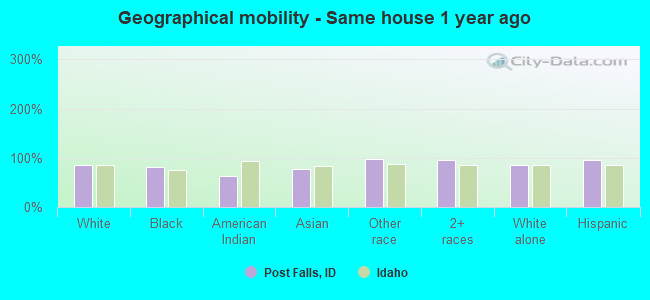
Geographical mobility - Same house 1 year ago (%)
Geographical mobility - Same house 1 year ago (%) - White
Geographical mobility - Same house 1 year ago (%) - Black or African American
Geographical mobility - Same house 1 year ago (%) - Asian
Geographical mobility - Same house 1 year ago (%) - Hispanic or Latino
Geographical mobility - Same house 1 year ago (%) - American Indian and Alaska Native
Geographical mobility - Same house 1 year ago (%) - Multirace
Geographical mobility - Same house 1 year ago (%) - Other Race
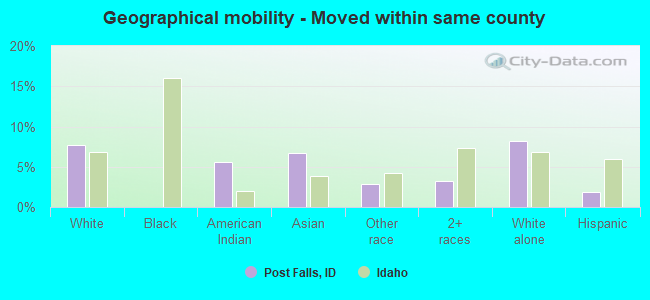
Geographical mobility - Moved within same county (%)
Geographical mobility - Moved within same county (%) - White
Geographical mobility - Moved within same county (%) - Black or African American
Geographical mobility - Moved within same county (%) - Asian
Geographical mobility - Moved within same county (%) - Hispanic or Latino
Geographical mobility - Moved within same county (%) - American Indian and Alaska Native
Geographical mobility - Moved within same county (%) - Multirace
Geographical mobility - Moved within same county (%) - Other Race
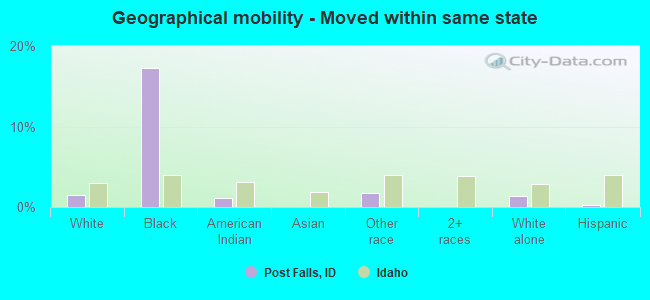
Geographical mobility - Moved from different county within same state (%)
Geographical mobility - Moved from different county within same state (%) - White
Geographical mobility - Moved from different county within same state (%) - Black or African American
Geographical mobility - Moved from different county within same state (%) - Asian
Geographical mobility - Moved from different county within same state (%) - Hispanic or Latino
Geographical mobility - Moved from different county within same state (%) - American Indian and Alaska Native
Geographical mobility - Moved from different county within same state (%) - Multirace
Geographical mobility - Moved from different county within same state (%) - Other Race
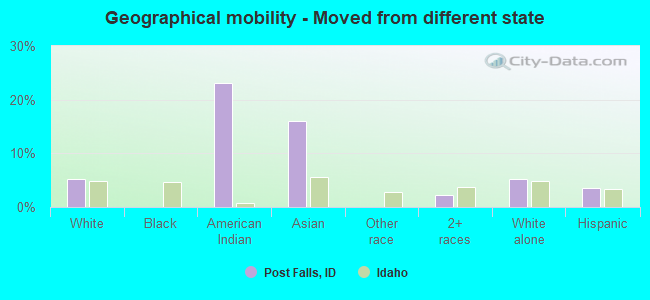
Geographical mobility - Moved from different state (%)
Geographical mobility - Moved from different state (%) - White
Geographical mobility - Moved from different state (%) - Black or African American
Geographical mobility - Moved from different state (%) - Asian
Geographical mobility - Moved from different state (%) - Hispanic or Latino
Geographical mobility - Moved from different state (%) - American Indian and Alaska Native
Geographical mobility - Moved from different state (%) - Multirace
Geographical mobility - Moved from different state (%) - Other Race
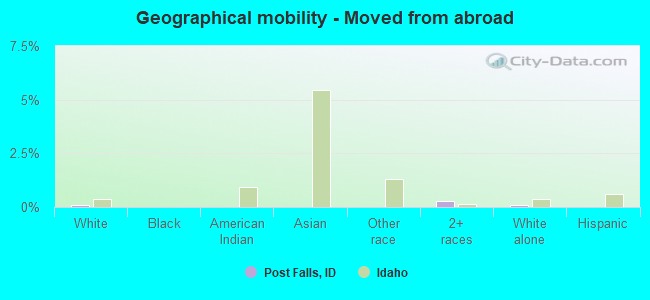
Geographical mobility - Moved from abroad (%)
Geographical mobility - Moved from abroad (%) - White
Geographical mobility - Moved from abroad (%) - Black or African American
Geographical mobility - Moved from abroad (%) - Asian
Geographical mobility - Moved from abroad (%) - Hispanic or Latino
Geographical mobility - Moved from abroad (%) - American Indian and Alaska Native
Geographical mobility - Moved from abroad (%) - Multirace
Geographical mobility - Moved from abroad (%) - Other Race
Place of birth for the foreign-born population - Ireland (%)
Place of birth for the foreign-born population - Denmark (%)
Place of birth for the foreign-born population - Norway (%)
Place of birth for the foreign-born population - Sweden (%)
Place of birth for the foreign-born population - United Kingdom (%)
Place of birth for the foreign-born population - England (%)
Place of birth for the foreign-born population - Scotland (%)
Place of birth for the foreign-born population - Other Northern Europe (%)
Place of birth for the foreign-born population - Austria (%)
Place of birth for the foreign-born population - Belgium (%)
Place of birth for the foreign-born population - France (%)
Place of birth for the foreign-born population - Germany (%)
Place of birth for the foreign-born population - Netherlands (%)
Place of birth for the foreign-born population - Switzerland (%)
Place of birth for the foreign-born population - Other Western Europe (%)
Place of birth for the foreign-born population - Greece (%)
Place of birth for the foreign-born population - Italy (%)
Place of birth for the foreign-born population - Portugal (%)
Place of birth for the foreign-born population - Spain (%)
Place of birth for the foreign-born population - Other Southern Europe (%)
Place of birth for the foreign-born population - Albania (%)
Place of birth for the foreign-born population - Belarus (%)
Place of birth for the foreign-born population - Bosnia and Herzegovina (%)
Place of birth for the foreign-born population - Bulgaria (%)
Place of birth for the foreign-born population - Croatia (%)
Place of birth for the foreign-born population - Czechoslovakia (%)
Place of birth for the foreign-born population - Hungary (%)
Place of birth for the foreign-born population - Latvia (%)
Place of birth for the foreign-born population - Lithuania (%)
Place of birth for the foreign-born population - North Macedonia (Macedonia) (%)
Place of birth for the foreign-born population - Moldova (%)
Place of birth for the foreign-born population - Poland (%)
Place of birth for the foreign-born population - Romania (%)
Place of birth for the foreign-born population - Russia (%)
Place of birth for the foreign-born population - Serbia (%)
Place of birth for the foreign-born population - Ukraine (%)
Place of birth for the foreign-born population - Other Eastern Europe (%)
Place of birth for the foreign-born population - China (%)
Place of birth for the foreign-born population - Hong Kong (%)
Place of birth for the foreign-born population - Taiwan (%)
Place of birth for the foreign-born population - Japan (%)
Place of birth for the foreign-born population - Korea (%)
Place of birth for the foreign-born population - Other Eastern Asia (%)
Place of birth for the foreign-born population - Afghanistan (%)
Place of birth for the foreign-born population - Bangladesh (%)
Place of birth for the foreign-born population - India (%)
Place of birth for the foreign-born population - Iran (%)
Place of birth for the foreign-born population - Kazakhstan (%)
Place of birth for the foreign-born population - Nepal (%)
Place of birth for the foreign-born population - Pakistan (%)
Place of birth for the foreign-born population - Sri Lanka (%)
Place of birth for the foreign-born population - Uzbekistan (%)
Place of birth for the foreign-born population - Other South Central Asia (%)
Place of birth for the foreign-born population - Burma (%)
Place of birth for the foreign-born population - Cambodia (%)
Place of birth for the foreign-born population - Indonesia (%)
Place of birth for the foreign-born population - Laos (%)
Place of birth for the foreign-born population - Malaysia (%)
Place of birth for the foreign-born population - Philippines (%)
Place of birth for the foreign-born population - Singapore (%)
Place of birth for the foreign-born population - Thailand (%)
Place of birth for the foreign-born population - Vietnam (%)
Place of birth for the foreign-born population - Other South Eastern Asia (%)
Place of birth for the foreign-born population - Armenia (%)
Place of birth for the foreign-born population - Iraq (%)
Place of birth for the foreign-born population - Israel (%)
Place of birth for the foreign-born population - Jordan (%)
Place of birth for the foreign-born population - Kuwait (%)
Place of birth for the foreign-born population - Lebanon (%)
Place of birth for the foreign-born population - Saudi Arabia (%)
Place of birth for the foreign-born population - Syria (%)
Place of birth for the foreign-born population - Turkey (%)
Place of birth for the foreign-born population - Yemen (%)
Place of birth for the foreign-born population - Other Western Asia (%)
Place of birth for the foreign-born population - Eritrea (%)
Place of birth for the foreign-born population - Ethiopia (%)
Place of birth for the foreign-born population - Kenya (%)
Place of birth for the foreign-born population - Somalia (%)
Place of birth for the foreign-born population - Uganda (%)
Place of birth for the foreign-born population - Zimbabwe (%)
Place of birth for the foreign-born population - Other Eastern Africa (%)
Place of birth for the foreign-born population - Cameroon (%)
Place of birth for the foreign-born population - Congo (%)
Place of birth for the foreign-born population - Democratic Republic of Congo (Zaire) (%)
Place of birth for the foreign-born population - Other Middle Africa (%)
Place of birth for the foreign-born population - Egypt (%)
Place of birth for the foreign-born population - Morocco (%)
Place of birth for the foreign-born population - Sudan (%)
Place of birth for the foreign-born population - Other Northern Africa (%)
Place of birth for the foreign-born population - South Africa (%)
Place of birth for the foreign-born population - Other Southern Africa (%)
Place of birth for the foreign-born population - Cabo Verde (%)
Place of birth for the foreign-born population - Ghana (%)
Place of birth for the foreign-born population - Liberia (%)
Place of birth for the foreign-born population - Nigeria (%)
Place of birth for the foreign-born population - Senegal (%)
Place of birth for the foreign-born population - Sierra Leone (%)
Place of birth for the foreign-born population - Other Western Africa (%)
Place of birth for the foreign-born population - Australia (%)
Place of birth for the foreign-born population - New Zealand (%)
Place of birth for the foreign-born population - Fiji (%)
Place of birth for the foreign-born population - Micronesia (%)
Place of birth for the foreign-born population - Bahamas (%)
Place of birth for the foreign-born population - Barbados (%)
Place of birth for the foreign-born population - Cuba (%)
Place of birth for the foreign-born population - Dominica (%)
Place of birth for the foreign-born population - Dominican Republic (%)
Place of birth for the foreign-born population - Grenada (%)
Place of birth for the foreign-born population - Haiti (%)
Place of birth for the foreign-born population - Jamaica (%)
Place of birth for the foreign-born population - St. Vincent and the Grenadines (%)
Place of birth for the foreign-born population - Trinidad and Tobago (%)
Place of birth for the foreign-born population - West Indies (%)
Place of birth for the foreign-born population - Other Caribbean (%)
Place of birth for the foreign-born population - Belize (%)
Place of birth for the foreign-born population - Costa Rica (%)
Place of birth for the foreign-born population - El Salvador (%)
Place of birth for the foreign-born population - Guatemala (%)
Place of birth for the foreign-born population - Honduras (%)
Place of birth for the foreign-born population - Mexico (%)
Place of birth for the foreign-born population - Nicaragua (%)
Place of birth for the foreign-born population - Panama (%)
Place of birth for the foreign-born population - Other Central America (%)
Place of birth for the foreign-born population - Argentina (%)
Place of birth for the foreign-born population - Bolivia (%)
Place of birth for the foreign-born population - Brazil (%)
Place of birth for the foreign-born population - Chile (%)
Place of birth for the foreign-born population - Colombia (%)
Place of birth for the foreign-born population - Ecuador (%)
Place of birth for the foreign-born population - Guyana (%)
Place of birth for the foreign-born population - Peru (%)
Place of birth for the foreign-born population - Uruguay (%)
Place of birth for the foreign-born population - Venezuela (%)
Place of birth for the foreign-born population - Other South America (%)
Place of birth for the foreign-born population - Canada (%)
Place of birth for the foreign-born population - Other Northern America (%)
Place of birth for the foreign-born population - Other (%)
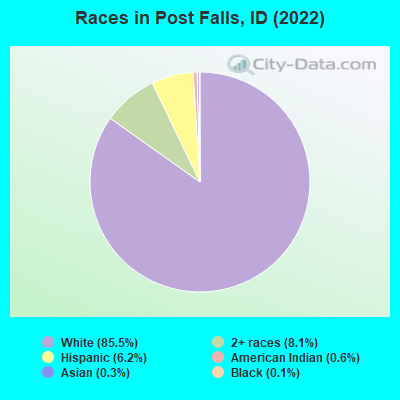
According to 2022 data, the most numerous races in Post Falls, ID are White alone (36,223 residents), Hispanic (2,646 residents), and Two or more races (3,425 residents). 96.8% of Post Falls residents speak English at home. 1.3% of Post Falls, ID residents are foreign-born , which is 297.3% less than the foreign-born rate of 5.0% across the entire state of Idaho.
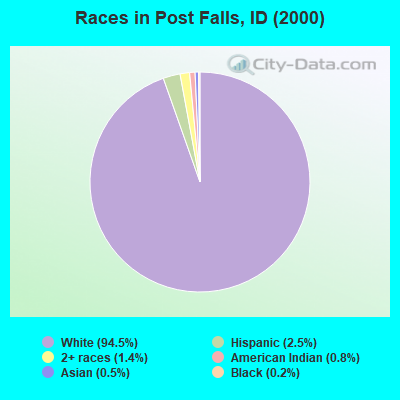
Race distribution in Post Falls
2000 2022
1,139,291 88.0% White alone 101,690 7.9% Hispanic 18,261 1.4% Two or more races 15,789 1.2% American Indian alone 11,641 0.9% Asian alone 4,889 0.4% Black alone 1,192 0.09% Other race alone 1,200 0.09% Native Hawaiian and Other
1,531,219 79.0% White alone 261,921 13.5% Hispanic 81,112 4.2% Two or more races 25,174 1.3% Asian alone 15,825 0.8% American Indian alone 11,868 0.6% Black alone 8,752 0.5% Other race alone 3,162 0.2% Native Hawaiian and Other
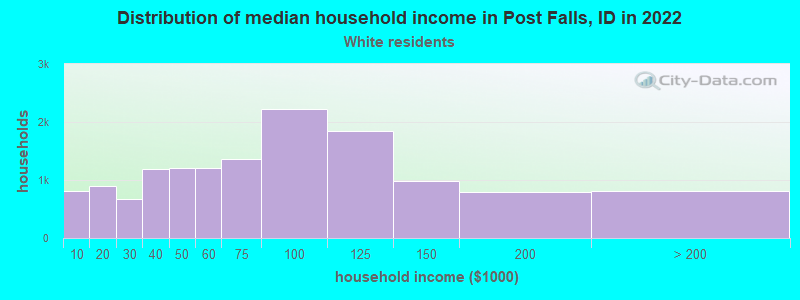
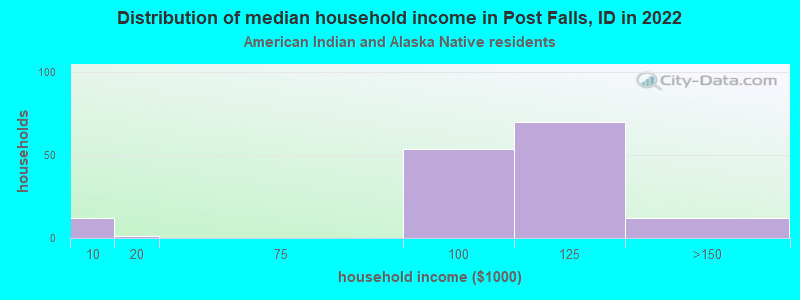
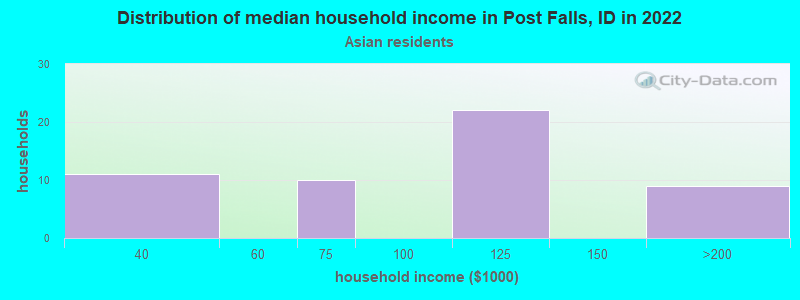
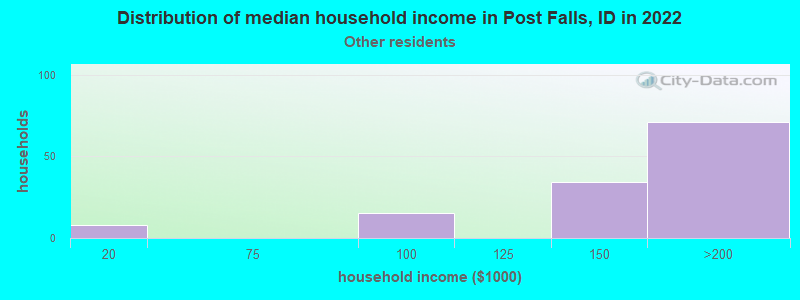
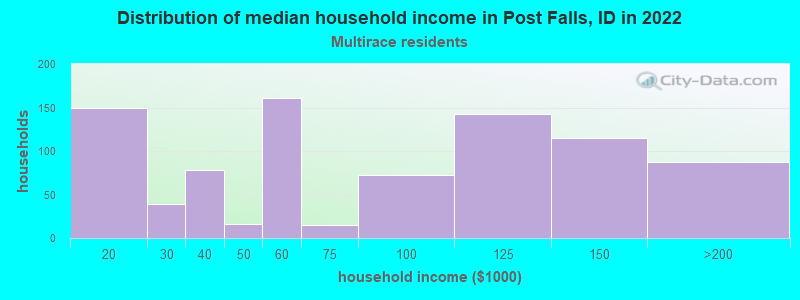
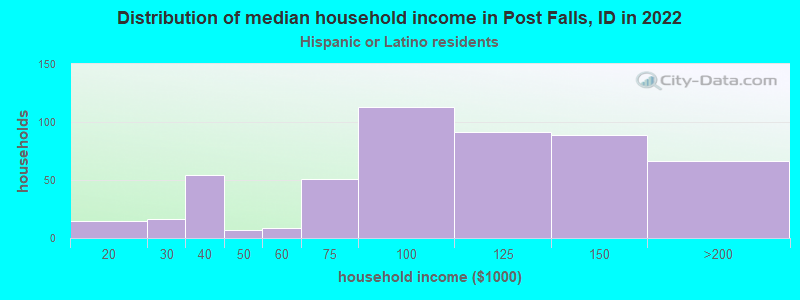
Income and house value in Post Falls Median household income in 2022 $74,392 White non-Hispanic householders$187,847 American Indian and Alaska Native householders$143,230 Some other race householders$53,957 Two or more races householders$95,613 Hispanic or Latino race householdersMedian 2022 house value $520,024 White Non-Hispanic householders$436,802 American Indian or Alaska Native householders$264,380 Some other race householders$517,266 Two or more races householders$340,705 Hispanic or Latino householders
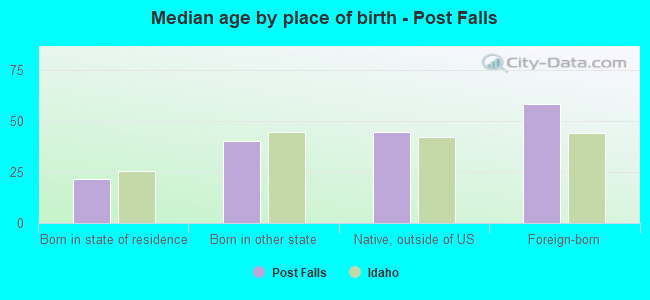
Median age by race in Post Falls
35.9 Median age for White residents36.8 35.9 70.9 Median age for Black or African American residents72.7 -869,696,968.8 42.8 Median age for American Indian / Alaska Native residents45.9 31.3 47.3 Median age for Asian residents45.4 44.1 -393,939,393.5 Median age for Native Hawaiian / Pacific Islander residents-355,119,825.4 -679,245,282.3 44.6 Median age for Other race residents38.8 67.5 18.4 Median age for Two or more races residents19.4 14.5 35.7 Median age for White alone residents36.8 36.0 30.3 Median age for Hispanic or Latino residents30.0 30.6
Owner/renter occupied households by race in Post Falls
House owners and renters - White residents 9,557 67.4% Owner occupied4,622 32.6% Renter occupiedHouse owners and renters - Black or African American residents 18 100.0% Owner occupiedHouse owners and renters - American Indian / Alaska Native residents 142 95.9% Owner occupied6 4.1% Renter occupiedHouse owners and renters - Asian residents 39 79.8% Owner occupied10 20.2% Renter occupiedHouse owners and renters - Other race residents 52 72.9% Owner occupied19 27.1% Renter occupiedHouse owners and renters - Two or more races residents 439 47.7% Owner occupied481 52.3% Renter occupiedHouse owners and renters - White alone residents 9,432 67.5% Owner occupied4,541 32.5% Renter occupiedHouse owners and renters - Hispanic or Latino residents 325 63.8% Owner occupied184 36.2% Renter occupied
Language usage in Post Falls
English speakers - Total 96.8% of residents of Post Falls speak English at home.
1.4% of residents speak Spanish at home 458 84.3% Speak English very well85 15.7% Speak English less than very well2.0% of residents speak other language at home 471 59.3% Speak English very well323 40.7% Speak English less than very well
English speakers - Born in the United States 97.7% of residents of Post Falls speak English at home.
1.7% of residents speak Spanish at home 437 95.2% Speak English very well22 4.8% Speak English less than very well0.5% of residents speak other language at home 123 96.9% Speak English very well4 3.1% Speak English less than very well
English speakers - Native, born elsewhere 48.2% of residents of Post Falls speak English at home.
21.9% of residents speak Spanish at home 50 63.3% Speak English very well29 36.7% Speak English less than very well5.8% of residents speak other language at home 21 100.0% Speak English very well
English speakers - Foreign-born 57.6% of residents of Post Falls speak English at home.
11.8% of residents speak Spanish at home 25 41.0% Speak English very well36 59.0% Speak English less than very well38.5% of residents speak other language at home 19 9.5% Speak English very well181 90.5% Speak English less than very well
White (Caucasian) - Speak only English Native:
98.1% (33,340)Foreign-born:
86.8% (248)
White (Caucasian) - Speak another language Native:
1.8% (624)Foreign-born:
17.4% (50)
Asian - Speak only English Native:
42.9% (18)Foreign-born:
21.2% (21)
Asian - Speak another language Native:
100.0% (42)Foreign-born:
79.9% (80)
Other race - Speak another language Native:
32.4% (76)Foreign-born:
99.1% (58)
Two or more races - Speak only English Native:
90.4% (3,423)Foreign-born:
71.1% (92)
Two or more races - Speak another language Native:
7.1% (269)Foreign-born:
45.1% (59)
White alone - Speak only English Native:
98.6% (32,801)Foreign-born:
70.4% (229)
White alone - Speak another language Native:
1.2% (398)Foreign-born:
30.3% (99)
Hispanic or Latino - Speak only English Native:
77.9% (1,706)Foreign-born:
44.3% (48)
Hispanic or Latino - Speak another language Native:
22.6% (496)Foreign-born:
60.4% (66)
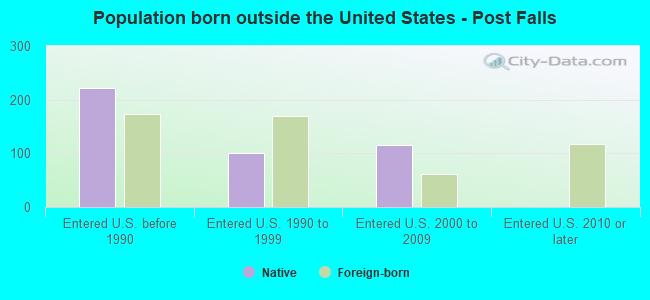
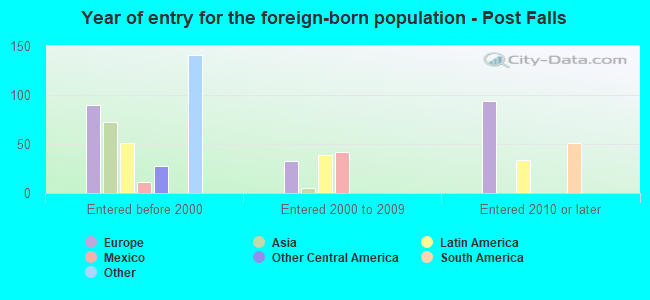
Foreign-born residents in Post Falls 533 residents are foreign born
Marital status for residents in Post Falls Marital status - White (Caucasian) population 15 years and over
Males 29.6% Never married53.4% Now married1.2% Separated2.0% Widowed13.8% DivorcedFemales 24.0% Never married47.2% Now married2.8% Separated10.6% Widowed15.4% DivorcedWomen who gave birth in the past 12 months Now married:
74.2% (439)Unmarried:
25.8% (152)
Women who did not give birth in the past 12 months Now married:
47.3% (3,976)Unmarried:
52.7% (4,434)
Marital status - Black or African American population 15 years and over
Males 0.0% Never married100.0% Now married0.0% Separated0.0% Widowed0.0% DivorcedFemales 100.0% Never married0.0% Now married0.0% Separated0.0% Widowed0.0% DivorcedWomen who did not give birth in the past 12 months Now married:
0.0% (0)Unmarried:
100.0% (25)
Marital status - American Indian / Alaska Native population 15 years and over
Males 81.0% Never married19.0% Now married0.0% Separated0.0% Widowed0.0% DivorcedFemales 30.3% Never married69.1% Now married0.0% Separated0.0% Widowed0.7% DivorcedWomen who did not give birth in the past 12 months Now married:
69.5% (120)Unmarried:
30.5% (53)
Marital status - Asian population 15 years and over
Males 53.7% Never married46.3% Now married0.0% Separated0.0% Widowed0.0% DivorcedFemales 0.0% Never married65.5% Now married27.6% Separated6.9% Widowed0.0% DivorcedWomen who did not give birth in the past 12 months Now married:
100.0% (26)Unmarried:
0.0% (0)
Marital status - Other race population 15 years and over
Males 50.4% Never married35.4% Now married0.0% Separated0.0% Widowed14.2% DivorcedFemales 28.4% Never married71.6% Now married0.0% Separated0.0% Widowed0.0% DivorcedWomen who gave birth in the past 12 months Now married:
100.0% (11)Unmarried:
0.0% (0)
Women who did not give birth in the past 12 months Now married:
64.7% (83)Unmarried:
35.3% (45)
Marital status - Two or more races population 15 years and over
Males 57.6% Never married24.7% Now married6.4% Separated1.0% Widowed10.3% DivorcedFemales 25.6% Never married44.3% Now married8.1% Separated1.5% Widowed20.5% DivorcedWomen who gave birth in the past 12 months Now married:
61.4% (152)Unmarried:
38.6% (96)
Women who did not give birth in the past 12 months Now married:
56.2% (510)Unmarried:
43.8% (397)
Marital status - White alone, not Hispanic / Latino population 15 years and over
Males 30.0% Never married52.6% Now married1.2% Separated2.1% Widowed14.0% DivorcedFemales 23.6% Never married47.1% Now married2.9% Separated10.7% Widowed15.6% DivorcedWomen who gave birth in the past 12 months Now married:
74.2% (447)Unmarried:
25.8% (155)
Women who did not give birth in the past 12 months Now married:
47.5% (3,947)Unmarried:
52.5% (4,356)
Marital status - Hispanic or Latino population 15 years and over
Males 41.4% Never married54.0% Now married0.0% Separated0.0% Widowed4.5% DivorcedFemales 36.6% Never married49.6% Now married0.0% Separated3.8% Widowed10.0% DivorcedWomen who gave birth in the past 12 months Now married:
100.0% (11)Unmarried:
0.0% (0)
Women who did not give birth in the past 12 months Now married:
45.0% (238)Unmarried:
55.0% (290)
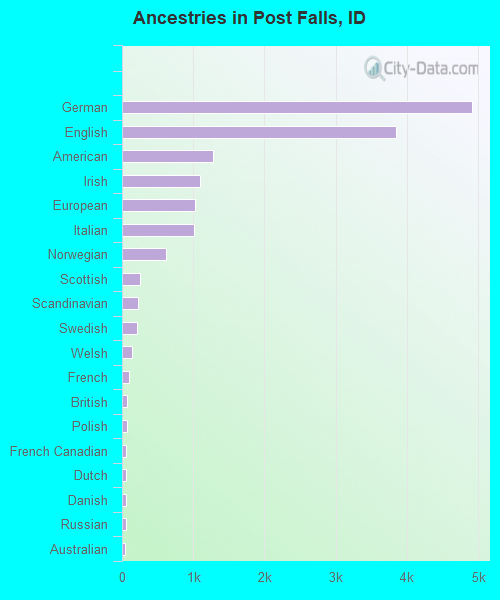
Ancestries in Post Falls
4,909 26.8% German3,847 21.0% English1,277 7.0% American1,099 6.0% Irish1,027 5.6% European1,013 5.5% Italian616 3.4% Norwegian247 1.3% Scottish227 1.2% Scandinavian217 1.2% Swedish143 0.8% Welsh101 0.6% French76 0.4% British74 0.4% Polish63 0.3% French Canadian61 0.3% Dutch60 0.3% Danish56 0.3% Russian46 0.3% Australian44 0.2% Bulgarian42 0.2% Lebanese40 0.2% Canadian38 0.2% Swiss30 0.2% Brazilian30 0.2% Greek29 0.2% Portuguese28 0.2% Belgian25 0.1% Finnish18 0.10% Slavic17 0.09% Czech16 0.09% Scotch-Irish16 0.09% Czechoslovakian14 0.08% Ukrainian12 0.07% Maltese11 0.06% Northern European10 0.05% Lithuanian
Geographical mobility in Post Falls Same house 1 year ago 31,006 85.5% White (Caucasian)65 81.7% Black or African American228 63.7% American Indian / Alaska Native122 76.7% Asian377 97.6% Other race4,397 94.9% Two or more races30,338 85.2% White alone, not Hispanic / Latino2,483 95.9% Hispanic or LatinoMoved within same county 2,796 7.7% White / Caucasian20 5.6% American Indian / Alaska Native11 6.8% Asian11 2.9% Other race147 3.2% Two or more races2,909 8.2% White alone, not Hispanic / Latino50 1.9% Hispanic or LatinoMoved within same state 532 1.5% White / Caucasian14 17.3% Black or African American4 1.2% American Indian / Alaska Native7 1.7% Other race471 1.3% White alone, not Hispanic / Latino7 0.3% Hispanic or LatinoMoved from different state 1,897 5.2% White / Caucasian83 23.1% American Indian / Alaska Native25 16.0% Asian106 2.3% Two or more races1,865 5.2% White alone, not Hispanic / Latino90 3.5% Hispanic or LatinoMoved from abroad 41 0.1% White13 0.3% Two or more races41 0.1% White alone, not Hispanic / Latino
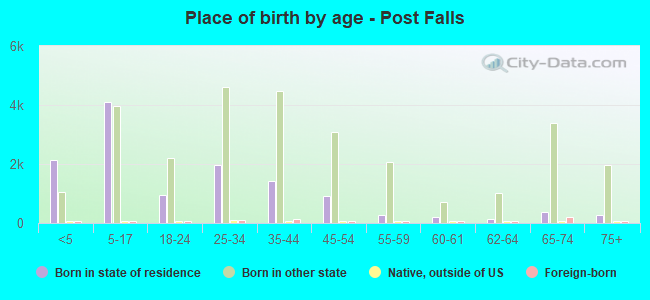
Children Nativity (place of birth) in Post Falls
Children under 6 years - Living with two parents Both parents native 2,438 100.0% NativeBoth parents foreign-born 19 100.0% NativeOne native, one foreign-born parent 34 100.0% NativeChildren under 6 years - Living with one parent Native parent 1,122 100.0% NativeChildren 6 to 17 years - Living with two parents Both parents native 4,608 100.0% NativeBoth parents foreign-born 42 100.0% NativeOne native, one foreign-born parent 29 100.0% NativeChildren 6 to 17 years - Living with one parent Native parent 1,830 100.0% NativeForeign-born parent 25 51.1% Native24 48.9% Foreign-born
Grandparents responsible for own grandchildren in Post Falls
Grandparents (30 to 59 years) White / Caucasian 31 24.2% Responsible for grandchildren97 75.8% Not responsible for grandchildrenTwo or more races 14 100.0% Not responsible for grandchildrenWhite alone, not Hispanic / Latino 33 25.5% Responsible for grandchildren98 74.5% Not responsible for grandchildrenGrandparents (60 years and over) White / Caucasian 154 46.3% Responsible for grandchildren178 53.7% Not responsible for grandchildrenWhite alone, not Hispanic / Latino 153 45.4% Responsible for grandchildren185 54.6% Not responsible for grandchildren