Races in Pupukea, Hawaii (HI) Detailed Stats
Data:
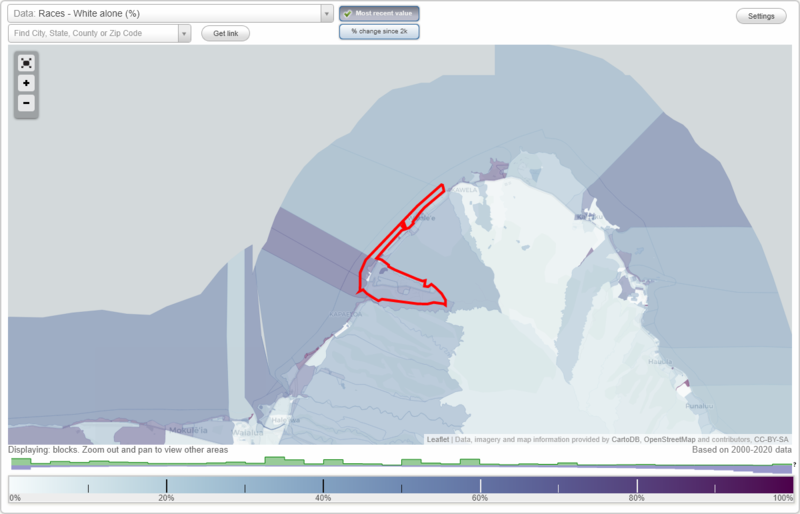
Races - White alone (%)
Races - White alone (% change since 2000)
Races - Black alone (%)
Races - Black alone (% change since 2000)
Races - American Indian alone (%)
Races - American Indian alone (% change since 2000)
Races - Asian alone (%)
Races - Asian alone (% change since 2000)
Races - Hispanic (%)
Races - Hispanic (% change since 2000)
Races - Native Hawaiian and Other Pacific Islander alone (%)
Races - Native Hawaiian and Other Pacific Islander alone (% change since 2000)
Races - Two or more races(%)
Races - Two or more races(% change since 2000)
Races - Other race alone (%)
Races - Other race alone (% change since 2000)
Racial diversity
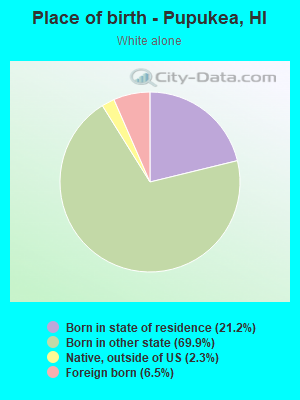
Place of birth - Born in state of residence (%)
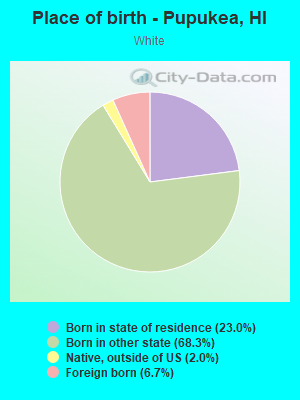
Place of birth - Born in state of residence (%) - White
Place of birth - Born in state of residence (%) - Black or African American
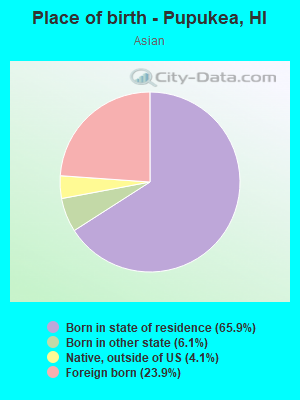
Place of birth - Born in state of residence (%) - Asian
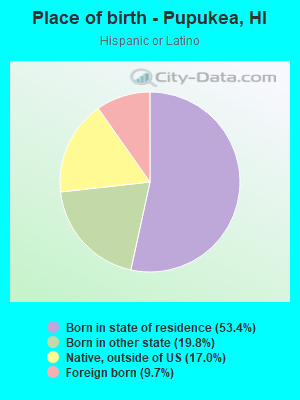
Place of birth - Born in state of residence (%) - Hispanic or Latino
Place of birth - Born in state of residence (%) - American Indian and Alaska Native
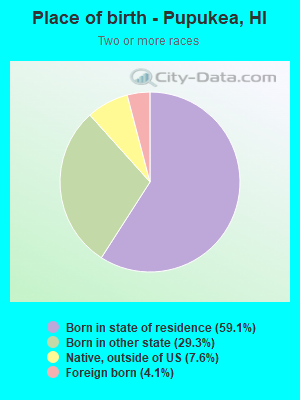
Place of birth - Born in state of residence (%) - Multirace
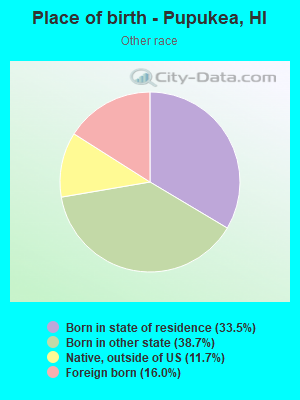
Place of birth - Born in state of residence (%) - Other Race
Place of birth - Born in other state (%)
Place of birth - Born in other state (%) - White
Place of birth - Born in other state (%) - Black or African American
Place of birth - Born in other state (%) - Asian
Place of birth - Born in other state (%) - Hispanic or Latino
Place of birth - Born in other state (%) - American Indian and Alaska Native
Place of birth - Born in other state (%) - Multirace
Place of birth - Born in other state (%) - Other Race
Place of birth - Native, outside of US (%)
Place of birth - Native, outside of US (%) - White
Place of birth - Native, outside of US (%) - Black or African American
Place of birth - Native, outside of US (%) - Asian
Place of birth - Native, outside of US (%) - Hispanic or Latino
Place of birth - Native, outside of US (%) - American Indian and Alaska Native
Place of birth - Native, outside of US (%) - Multirace
Place of birth - Native, outside of US (%) - Other Race
Place of birth - Foreign born (%)
Place of birth - Foreign born (%) - White
Place of birth - Foreign born (%) - Black or African American
Place of birth - Foreign born (%) - Asian
Place of birth - Foreign born (%) - Hispanic or Latino
Place of birth - Foreign born (%) - American Indian and Alaska Native
Place of birth - Foreign born (%) - Multirace
Place of birth - Foreign born (%) - Other Race
Residents speaking English at home (%)
Residents speaking English at home - Born in the United States (%)
Residents speaking English at home - Native, born elsewhere (%)
Residents speaking English at home - Foreign born (%)
Residents speaking Spanish at home (%)
Residents speaking Spanish at home - Born in the United States (%)
Residents speaking Spanish at home - Native, born elsewhere (%)
Residents speaking Spanish at home - Foreign born (%)
Residents speaking other language at home (%)
Residents speaking other language at home - Born in the United States (%)
Residents speaking other language at home - Native, born elsewhere (%)
Residents speaking other language at home - Foreign born (%)
Marital status - Never married (%)
Marital status - Now married (%)
Marital status - Separated (%)
Marital status - Widowed (%)
Marital status - Divorced (%)
Ancestries Reported - Arab (%)
Ancestries Reported - Czech (%)
Ancestries Reported - Danish (%)
Ancestries Reported - Dutch (%)
Ancestries Reported - English (%)
Ancestries Reported - French (%)
Ancestries Reported - French Canadian (%)
Ancestries Reported - German (%)
Ancestries Reported - Greek (%)
Ancestries Reported - Hungarian (%)
Ancestries Reported - Irish (%)
Ancestries Reported - Italian (%)
Ancestries Reported - Lithuanian (%)
Ancestries Reported - Norwegian (%)
Ancestries Reported - Polish (%)
Ancestries Reported - Portuguese (%)
Ancestries Reported - Russian (%)
Ancestries Reported - Scotch-Irish (%)
Ancestries Reported - Scottish (%)
Ancestries Reported - Slovak (%)
Ancestries Reported - Subsaharan African (%)
Ancestries Reported - Swedish (%)
Ancestries Reported - Swiss (%)
Ancestries Reported - Ukrainian (%)
Ancestries Reported - United States (%)
Ancestries Reported - Welsh (%)
Ancestries Reported - West Indian (%)
Ancestries Reported - Other (%)
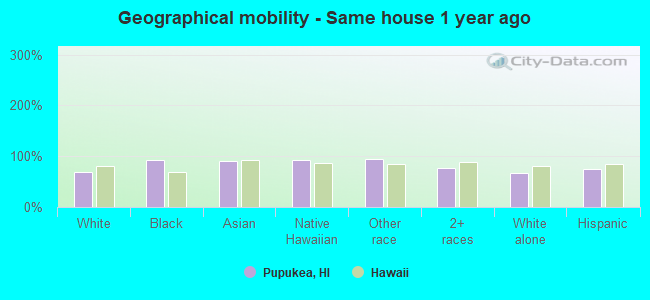
Geographical mobility - Same house 1 year ago (%)
Geographical mobility - Same house 1 year ago (%) - White
Geographical mobility - Same house 1 year ago (%) - Black or African American
Geographical mobility - Same house 1 year ago (%) - Asian
Geographical mobility - Same house 1 year ago (%) - Hispanic or Latino
Geographical mobility - Same house 1 year ago (%) - American Indian and Alaska Native
Geographical mobility - Same house 1 year ago (%) - Multirace
Geographical mobility - Same house 1 year ago (%) - Other Race
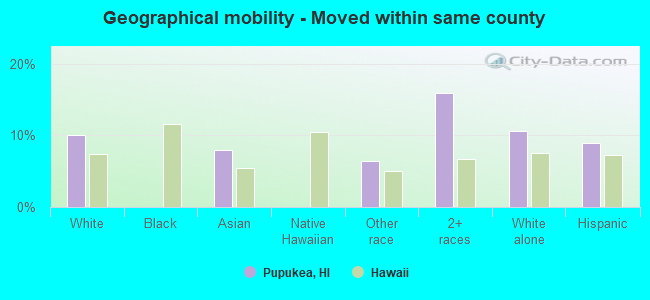
Geographical mobility - Moved within same county (%)
Geographical mobility - Moved within same county (%) - White
Geographical mobility - Moved within same county (%) - Black or African American
Geographical mobility - Moved within same county (%) - Asian
Geographical mobility - Moved within same county (%) - Hispanic or Latino
Geographical mobility - Moved within same county (%) - American Indian and Alaska Native
Geographical mobility - Moved within same county (%) - Multirace
Geographical mobility - Moved within same county (%) - Other Race
Geographical mobility - Moved from different county within same state (%)
Geographical mobility - Moved from different county within same state (%) - White
Geographical mobility - Moved from different county within same state (%) - Black or African American
Geographical mobility - Moved from different county within same state (%) - Asian
Geographical mobility - Moved from different county within same state (%) - Hispanic or Latino
Geographical mobility - Moved from different county within same state (%) - American Indian and Alaska Native
Geographical mobility - Moved from different county within same state (%) - Multirace
Geographical mobility - Moved from different county within same state (%) - Other Race
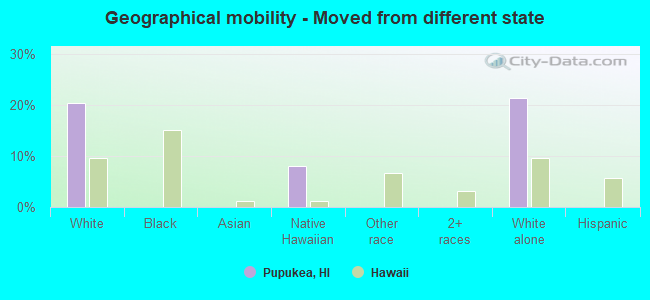
Geographical mobility - Moved from different state (%)
Geographical mobility - Moved from different state (%) - White
Geographical mobility - Moved from different state (%) - Black or African American
Geographical mobility - Moved from different state (%) - Asian
Geographical mobility - Moved from different state (%) - Hispanic or Latino
Geographical mobility - Moved from different state (%) - American Indian and Alaska Native
Geographical mobility - Moved from different state (%) - Multirace
Geographical mobility - Moved from different state (%) - Other Race
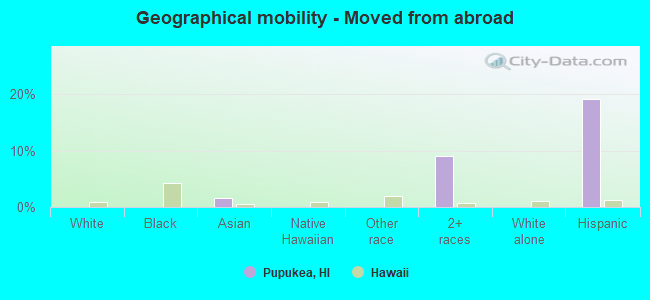
Geographical mobility - Moved from abroad (%)
Geographical mobility - Moved from abroad (%) - White
Geographical mobility - Moved from abroad (%) - Black or African American
Geographical mobility - Moved from abroad (%) - Asian
Geographical mobility - Moved from abroad (%) - Hispanic or Latino
Geographical mobility - Moved from abroad (%) - American Indian and Alaska Native
Geographical mobility - Moved from abroad (%) - Multirace
Geographical mobility - Moved from abroad (%) - Other Race
Place of birth for the foreign-born population - Ireland (%)
Place of birth for the foreign-born population - Denmark (%)
Place of birth for the foreign-born population - Norway (%)
Place of birth for the foreign-born population - Sweden (%)
Place of birth for the foreign-born population - United Kingdom (%)
Place of birth for the foreign-born population - England (%)
Place of birth for the foreign-born population - Scotland (%)
Place of birth for the foreign-born population - Other Northern Europe (%)
Place of birth for the foreign-born population - Austria (%)
Place of birth for the foreign-born population - Belgium (%)
Place of birth for the foreign-born population - France (%)
Place of birth for the foreign-born population - Germany (%)
Place of birth for the foreign-born population - Netherlands (%)
Place of birth for the foreign-born population - Switzerland (%)
Place of birth for the foreign-born population - Other Western Europe (%)
Place of birth for the foreign-born population - Greece (%)
Place of birth for the foreign-born population - Italy (%)
Place of birth for the foreign-born population - Portugal (%)
Place of birth for the foreign-born population - Spain (%)
Place of birth for the foreign-born population - Other Southern Europe (%)
Place of birth for the foreign-born population - Albania (%)
Place of birth for the foreign-born population - Belarus (%)
Place of birth for the foreign-born population - Bosnia and Herzegovina (%)
Place of birth for the foreign-born population - Bulgaria (%)
Place of birth for the foreign-born population - Croatia (%)
Place of birth for the foreign-born population - Czechoslovakia (%)
Place of birth for the foreign-born population - Hungary (%)
Place of birth for the foreign-born population - Latvia (%)
Place of birth for the foreign-born population - Lithuania (%)
Place of birth for the foreign-born population - North Macedonia (Macedonia) (%)
Place of birth for the foreign-born population - Moldova (%)
Place of birth for the foreign-born population - Poland (%)
Place of birth for the foreign-born population - Romania (%)
Place of birth for the foreign-born population - Russia (%)
Place of birth for the foreign-born population - Serbia (%)
Place of birth for the foreign-born population - Ukraine (%)
Place of birth for the foreign-born population - Other Eastern Europe (%)
Place of birth for the foreign-born population - China (%)
Place of birth for the foreign-born population - Hong Kong (%)
Place of birth for the foreign-born population - Taiwan (%)
Place of birth for the foreign-born population - Japan (%)
Place of birth for the foreign-born population - Korea (%)
Place of birth for the foreign-born population - Other Eastern Asia (%)
Place of birth for the foreign-born population - Afghanistan (%)
Place of birth for the foreign-born population - Bangladesh (%)
Place of birth for the foreign-born population - India (%)
Place of birth for the foreign-born population - Iran (%)
Place of birth for the foreign-born population - Kazakhstan (%)
Place of birth for the foreign-born population - Nepal (%)
Place of birth for the foreign-born population - Pakistan (%)
Place of birth for the foreign-born population - Sri Lanka (%)
Place of birth for the foreign-born population - Uzbekistan (%)
Place of birth for the foreign-born population - Other South Central Asia (%)
Place of birth for the foreign-born population - Burma (%)
Place of birth for the foreign-born population - Cambodia (%)
Place of birth for the foreign-born population - Indonesia (%)
Place of birth for the foreign-born population - Laos (%)
Place of birth for the foreign-born population - Malaysia (%)
Place of birth for the foreign-born population - Philippines (%)
Place of birth for the foreign-born population - Singapore (%)
Place of birth for the foreign-born population - Thailand (%)
Place of birth for the foreign-born population - Vietnam (%)
Place of birth for the foreign-born population - Other South Eastern Asia (%)
Place of birth for the foreign-born population - Armenia (%)
Place of birth for the foreign-born population - Iraq (%)
Place of birth for the foreign-born population - Israel (%)
Place of birth for the foreign-born population - Jordan (%)
Place of birth for the foreign-born population - Kuwait (%)
Place of birth for the foreign-born population - Lebanon (%)
Place of birth for the foreign-born population - Saudi Arabia (%)
Place of birth for the foreign-born population - Syria (%)
Place of birth for the foreign-born population - Turkey (%)
Place of birth for the foreign-born population - Yemen (%)
Place of birth for the foreign-born population - Other Western Asia (%)
Place of birth for the foreign-born population - Eritrea (%)
Place of birth for the foreign-born population - Ethiopia (%)
Place of birth for the foreign-born population - Kenya (%)
Place of birth for the foreign-born population - Somalia (%)
Place of birth for the foreign-born population - Uganda (%)
Place of birth for the foreign-born population - Zimbabwe (%)
Place of birth for the foreign-born population - Other Eastern Africa (%)
Place of birth for the foreign-born population - Cameroon (%)
Place of birth for the foreign-born population - Congo (%)
Place of birth for the foreign-born population - Democratic Republic of Congo (Zaire) (%)
Place of birth for the foreign-born population - Other Middle Africa (%)
Place of birth for the foreign-born population - Egypt (%)
Place of birth for the foreign-born population - Morocco (%)
Place of birth for the foreign-born population - Sudan (%)
Place of birth for the foreign-born population - Other Northern Africa (%)
Place of birth for the foreign-born population - South Africa (%)
Place of birth for the foreign-born population - Other Southern Africa (%)
Place of birth for the foreign-born population - Cabo Verde (%)
Place of birth for the foreign-born population - Ghana (%)
Place of birth for the foreign-born population - Liberia (%)
Place of birth for the foreign-born population - Nigeria (%)
Place of birth for the foreign-born population - Senegal (%)
Place of birth for the foreign-born population - Sierra Leone (%)
Place of birth for the foreign-born population - Other Western Africa (%)
Place of birth for the foreign-born population - Australia (%)
Place of birth for the foreign-born population - New Zealand (%)
Place of birth for the foreign-born population - Fiji (%)
Place of birth for the foreign-born population - Micronesia (%)
Place of birth for the foreign-born population - Bahamas (%)
Place of birth for the foreign-born population - Barbados (%)
Place of birth for the foreign-born population - Cuba (%)
Place of birth for the foreign-born population - Dominica (%)
Place of birth for the foreign-born population - Dominican Republic (%)
Place of birth for the foreign-born population - Grenada (%)
Place of birth for the foreign-born population - Haiti (%)
Place of birth for the foreign-born population - Jamaica (%)
Place of birth for the foreign-born population - St. Vincent and the Grenadines (%)
Place of birth for the foreign-born population - Trinidad and Tobago (%)
Place of birth for the foreign-born population - West Indies (%)
Place of birth for the foreign-born population - Other Caribbean (%)
Place of birth for the foreign-born population - Belize (%)
Place of birth for the foreign-born population - Costa Rica (%)
Place of birth for the foreign-born population - El Salvador (%)
Place of birth for the foreign-born population - Guatemala (%)
Place of birth for the foreign-born population - Honduras (%)
Place of birth for the foreign-born population - Mexico (%)
Place of birth for the foreign-born population - Nicaragua (%)
Place of birth for the foreign-born population - Panama (%)
Place of birth for the foreign-born population - Other Central America (%)
Place of birth for the foreign-born population - Argentina (%)
Place of birth for the foreign-born population - Bolivia (%)
Place of birth for the foreign-born population - Brazil (%)
Place of birth for the foreign-born population - Chile (%)
Place of birth for the foreign-born population - Colombia (%)
Place of birth for the foreign-born population - Ecuador (%)
Place of birth for the foreign-born population - Guyana (%)
Place of birth for the foreign-born population - Peru (%)
Place of birth for the foreign-born population - Uruguay (%)
Place of birth for the foreign-born population - Venezuela (%)
Place of birth for the foreign-born population - Other South America (%)
Place of birth for the foreign-born population - Canada (%)
Place of birth for the foreign-born population - Other Northern America (%)
Place of birth for the foreign-born population - Other (%)
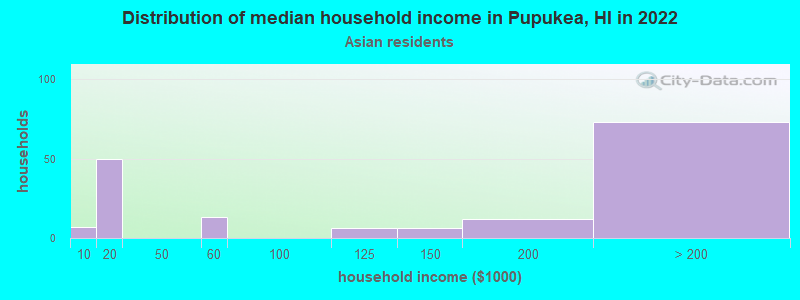
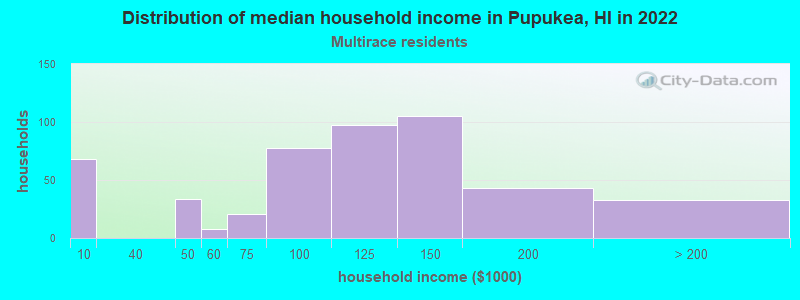
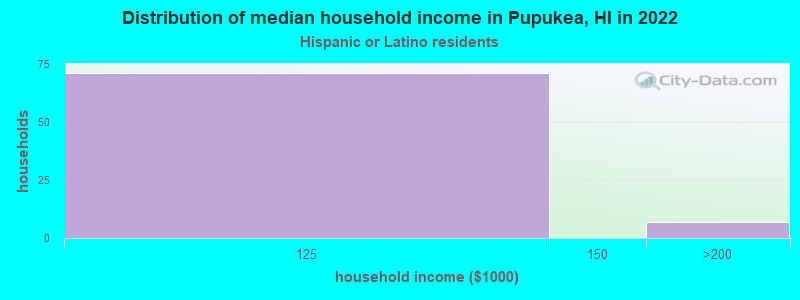
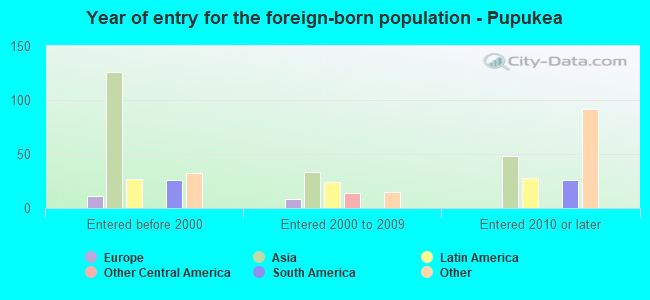
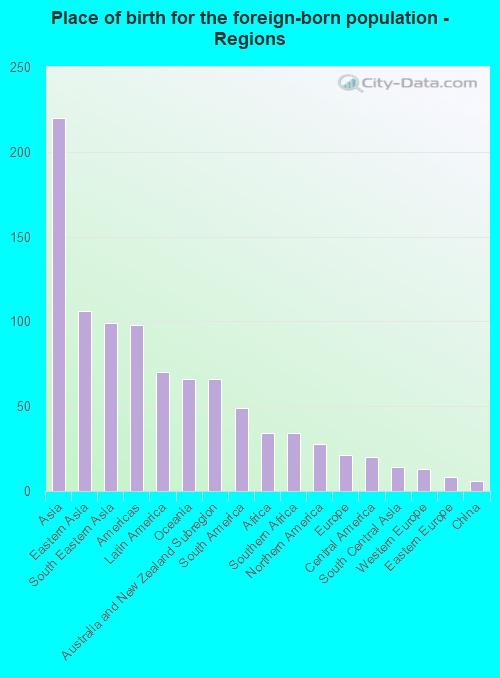
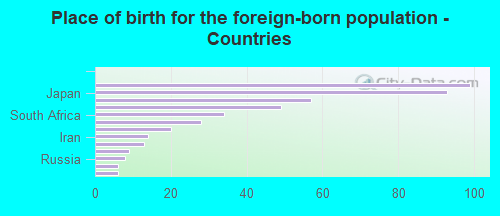
According to 2022 data, the most numerous races in Pupukea, HI are Asian alone (731 residents), Two or more races (1,291 residents), and White alone (2,365 residents). 78.8% of Pupukea residents speak English at home. 8.7% of Pupukea, HI residents are foreign-born (4.2% born in Asia, 1.3% born in Latin America, 1.3% born in Oceania), which is 106.4% less than the foreign-born rate of 18.0% across the entire state of Hawaii.
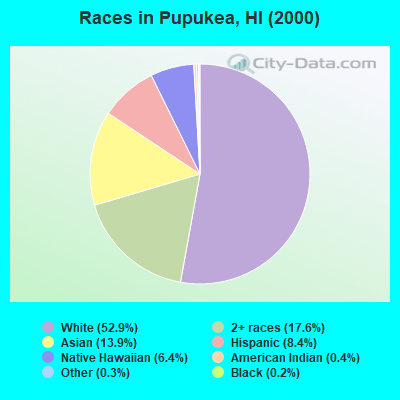
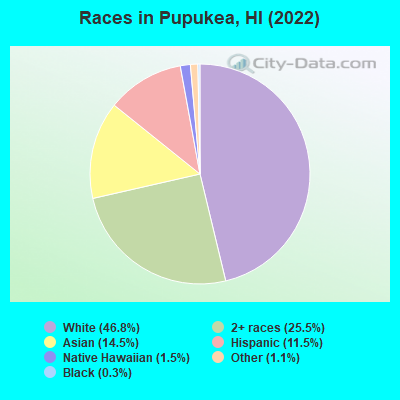
Race distribution in Pupukea
2000 2022
494,149 40.8% Asian alone 277,091 22.9% White alone 218,700 18.1% Two or more races 108,441 9.0% Native Hawaiian and Other 87,699 7.2% Hispanic 20,829 1.7% Black alone 2,089 0.2% Other race alone 2,539 0.2% American Indian alone
498,125 34.6% Asian alone 318,574 22.1% Two or more races 297,937 20.7% White alone 160,103 11.1% Hispanic 134,567 9.3% Native Hawaiian and Other 23,682 1.6% Black alone 5,378 0.4% Other race alone 1,830 0.1% American Indian alone
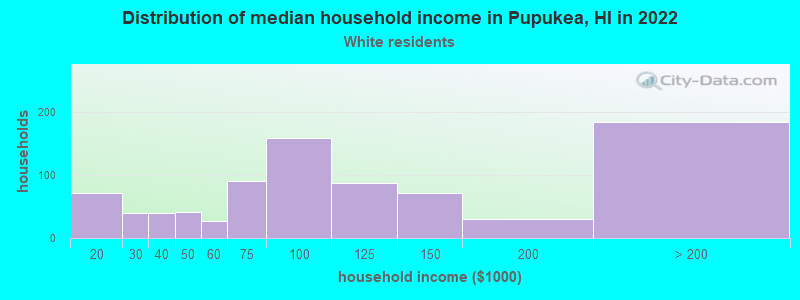
Income and house value in Pupukea Median household income in 2022 $93,520 White non-Hispanic householders$162,923 Asian householders$104,186 Two or more races householders$101,372 Hispanic or Latino race householdersMedian 2022 house value over $1,000,000 White Non-Hispanic householders over $1,000,000 Asian householders$993,492 Native Hawaiian and other Pacific Islander householdersover $1,000,000 Two or more races householdersover $1,000,000 Hispanic or Latino householders
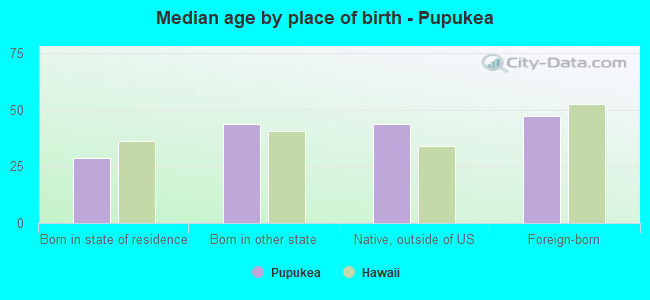
Median age by race in Pupukea
44.4 Median age for White residents42.3 45.1 -704,318,936.2 Median age for Black or African American residents-714,912,280.0 -709,604,519.1 -693,430,656.2 Median age for American Indian / Alaska Native residents-715,953,306.7 -629,508,196.1 56.7 Median age for Asian residents63.6 53.4 51.6 Median age for Native Hawaiian / Pacific Islander residents50.9 65.0 32.6 Median age for Other race residents12.6 36.5 22.6 Median age for Two or more races residents20.6 26.6 44.7 Median age for White alone residents42.8 45.3 22.5 Median age for Hispanic or Latino residents29.6 21.8
Owner/renter occupied households by race in Pupukea
House owners and renters - White residents 585 66.0% Owner occupied302 34.0% Renter occupiedHouse owners and renters - Asian residents 75 47.8% Owner occupied83 52.2% Renter occupiedHouse owners and renters - Native Hawaiian / Pacific Islander residents 16 100.0% Renter occupiedHouse owners and renters - Other race residents 23 100.0% Owner occupiedHouse owners and renters - Two or more races residents 205 43.2% Owner occupied270 56.8% Renter occupiedHouse owners and renters - White alone residents 579 65.6% Owner occupied304 34.4% Renter occupiedHouse owners and renters - Hispanic or Latino residents 7 8.1% Owner occupied75 91.9% Renter occupied
Language usage in Pupukea
English speakers - Total 78.8% of residents of Pupukea speak English at home.
6.4% of residents speak Spanish at home 262 85.9% Speak English very well43 14.1% Speak English less than very well15.3% of residents speak other language at home 530 72.9% Speak English very well197 27.1% Speak English less than very well
English speakers - Born in the United States 88.4% of residents of Pupukea speak English at home.
4.8% of residents speak Spanish at home 107 100.0% Speak English very well6.6% of residents speak other language at home 143 97.3% Speak English very well4 2.7% Speak English less than very well
English speakers - Native, born elsewhere 35.5% of residents of Pupukea speak English at home.
45.2% of residents speak Spanish at home 84 85.7% Speak English very well14 14.3% Speak English less than very well16.6% of residents speak other language at home 36 100.0% Speak English very well
English speakers - Foreign-born 37.3% of residents of Pupukea speak English at home.
10.6% of residents speak Spanish at home 16 36.4% Speak English very well28 63.6% Speak English less than very well53.5% of residents speak other language at home 43 19.4% Speak English very well179 80.6% Speak English less than very well
White (Caucasian) - Speak only English Native:
94.4% (2,067)Foreign-born:
70.7% (115)
White (Caucasian) - Speak another language Native:
5.5% (121)Foreign-born:
31.7% (51)
Asian - Speak only English Native:
85.0% (445)Foreign-born:
11.3% (20)
Asian - Speak another language Native:
14.9% (78)Foreign-born:
88.8% (156)
Other race - Speak another language Native:
27.9% (36)Foreign-born:
98.0% (23)
Two or more races - Speak only English Native:
62.2% (893)Foreign-born:
51.0% (37)
Two or more races - Speak another language Native:
38.5% (553)Foreign-born:
49.6% (36)
White alone - Speak only English Native:
93.3% (2,007)Foreign-born:
75.4% (116)
White alone - Speak another language Native:
6.5% (140)Foreign-born:
24.8% (38)
Hispanic or Latino - Speak another language Native:
38.8% (199)Foreign-born:
95.6% (52)
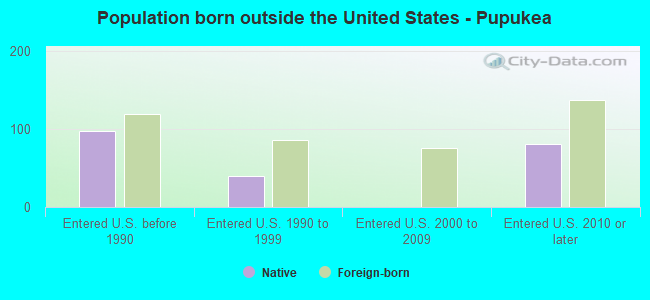
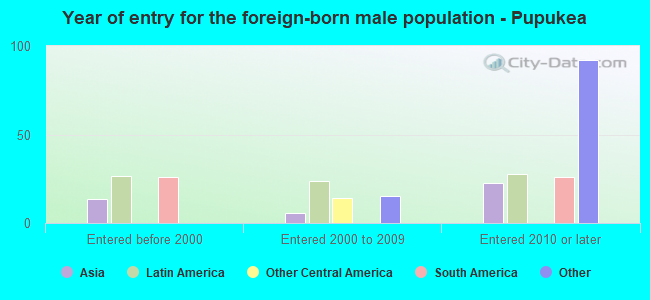
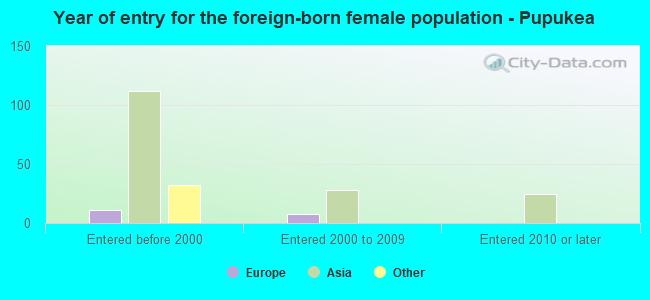
Foreign-born residents in Pupukea 441 residents are foreign born (4.2% Asia , 1.3% Latin America , 1.3% Oceania ).
This city:
8.7%Hawaii:
18.0%
Marital status for residents in Pupukea Marital status - White (Caucasian) population 15 years and over
Males 45.7% Never married44.0% Now married0.4% Separated1.1% Widowed8.8% DivorcedFemales 30.8% Never married45.8% Now married0.0% Separated3.0% Widowed20.4% DivorcedWomen who gave birth in the past 12 months Now married:
100.0% (31)Unmarried:
0.0% (0)
Women who did not give birth in the past 12 months Now married:
27.7% (129)Unmarried:
72.3% (337)
Marital status - Asian population 15 years and over
Males 31.6% Never married63.8% Now married0.0% Separated4.6% Widowed0.0% DivorcedFemales 15.8% Never married57.9% Now married5.0% Separated21.3% Widowed0.0% DivorcedWomen who did not give birth in the past 12 months Now married:
77.3% (94)Unmarried:
22.7% (28)
Marital status - Native Hawaiian / Pacific Islander population 15 years and over
Males 42.2% Never married40.0% Now married0.0% Separated0.0% Widowed17.8% DivorcedFemales 0.0% Never married57.9% Now married0.0% Separated0.0% Widowed42.1% DivorcedWomen who did not give birth in the past 12 months Now married:
0.0% (0)Unmarried:
100.0% (14)
Marital status - Other race population 15 years and over
Males 41.2% Never married0.0% Now married0.0% Separated0.0% Widowed58.8% DivorcedFemales 31.7% Never married17.5% Now married0.0% Separated0.0% Widowed50.8% DivorcedWomen who did not give birth in the past 12 months Now married:
22.9% (14)Unmarried:
77.1% (46)
Marital status - Two or more races population 15 years and over
Males 59.0% Never married33.0% Now married0.0% Separated0.0% Widowed8.0% DivorcedFemales 64.8% Never married29.0% Now married0.0% Separated3.1% Widowed3.1% DivorcedWomen who did not give birth in the past 12 months Now married:
23.5% (99)Unmarried:
76.5% (322)
Marital status - White alone, not Hispanic / Latino population 15 years and over
Males 45.1% Never married46.1% Now married0.4% Separated1.1% Widowed7.4% DivorcedFemales 29.9% Never married46.0% Now married0.0% Separated3.1% Widowed21.0% DivorcedWomen who gave birth in the past 12 months Now married:
100.0% (32)Unmarried:
0.0% (0)
Women who did not give birth in the past 12 months Now married:
28.8% (133)Unmarried:
71.2% (328)
Marital status - Hispanic or Latino population 15 years and over
Males 57.3% Never married20.2% Now married0.0% Separated0.0% Widowed22.5% DivorcedFemales 53.3% Never married46.7% Now married0.0% Separated0.0% Widowed0.0% DivorcedWomen who did not give birth in the past 12 months Now married:
36.2% (50)Unmarried:
63.8% (88)
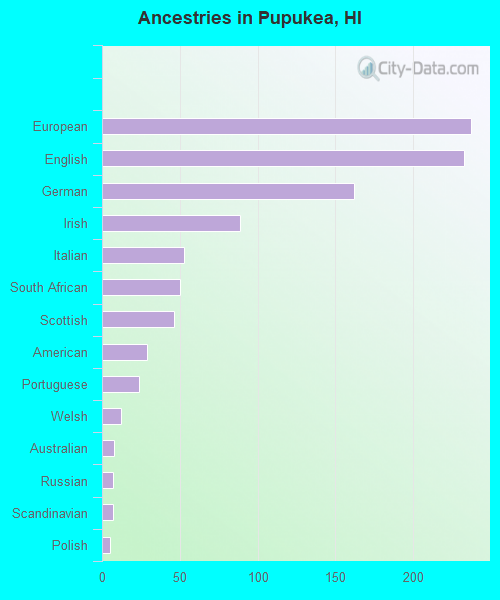
Ancestries in Pupukea
237 11.0% European233 10.8% English162 7.5% German89 4.1% Irish53 2.5% Italian50 2.3% South African46 2.1% Scottish29 1.3% American24 1.1% Portuguese12 0.6% Welsh8 0.4% Australian7 0.3% Russian7 0.3% Scandinavian5 0.2% Polish
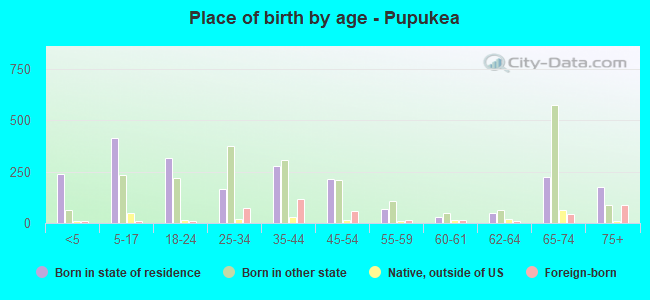
Children Nativity (place of birth) in Pupukea
Children under 6 years - Living with two parents Both parents native 85 100.0% NativeBoth parents foreign-born 48 100.0% NativeOne native, one foreign-born parent 18 100.0% NativeChildren under 6 years - Living with one parent Native parent 75 100.0% Native
Children 6 to 17 years - Living with two parents Both parents native 442 100.0% NativeOne native, one foreign-born parent 43 100.0% NativeChildren 6 to 17 years - Living with one parent Native parent 152 100.0% Native
Grandparents responsible for own grandchildren in Pupukea
Grandparents (30 to 59 years) White / Caucasian 20 100.0% Not responsible for grandchildrenWhite alone, not Hispanic / Latino 23 100.0% Not responsible for grandchildren
Grandparents (60 years and over) White / Caucasian 76 100.0% Not responsible for grandchildrenWhite alone, not Hispanic / Latino 74 100.0% Not responsible for grandchildren