Races in Radcliff, Kentucky (KY) Detailed Stats
Data:
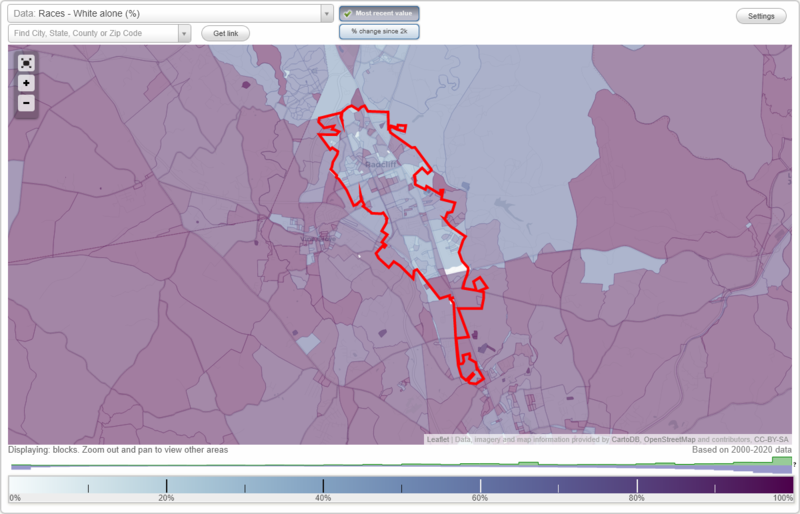
Races - White alone (%)
Races - White alone (% change since 2000)
Races - Black alone (%)
Races - Black alone (% change since 2000)
Races - American Indian alone (%)
Races - American Indian alone (% change since 2000)
Races - Asian alone (%)
Races - Asian alone (% change since 2000)
Races - Hispanic (%)
Races - Hispanic (% change since 2000)
Races - Native Hawaiian and Other Pacific Islander alone (%)
Races - Native Hawaiian and Other Pacific Islander alone (% change since 2000)
Races - Two or more races(%)
Races - Two or more races(% change since 2000)
Races - Other race alone (%)
Races - Other race alone (% change since 2000)
Racial diversity
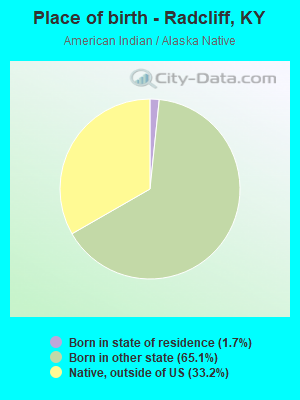
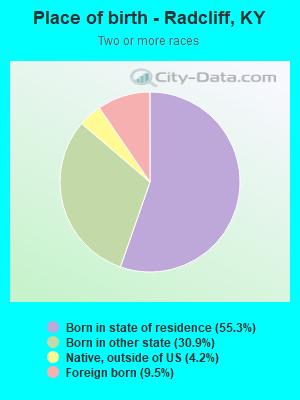
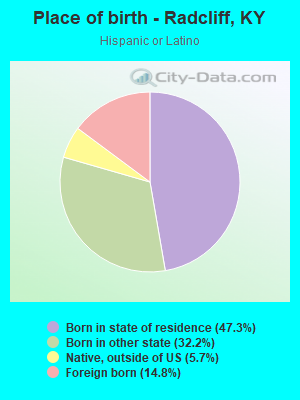
Place of birth - Born in state of residence (%)
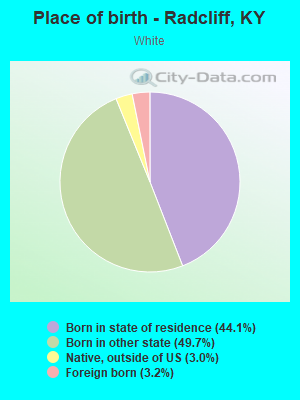
Place of birth - Born in state of residence (%) - White
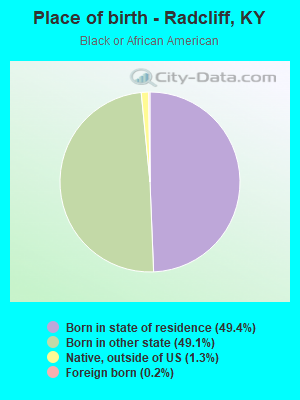
Place of birth - Born in state of residence (%) - Black or African American
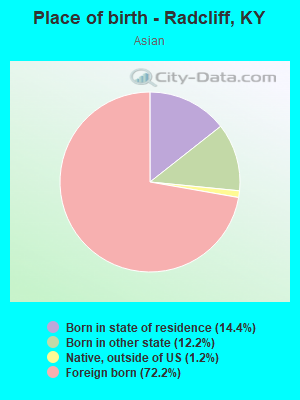
Place of birth - Born in state of residence (%) - Asian
Place of birth - Born in state of residence (%) - Hispanic or Latino
Place of birth - Born in state of residence (%) - American Indian and Alaska Native
Place of birth - Born in state of residence (%) - Multirace
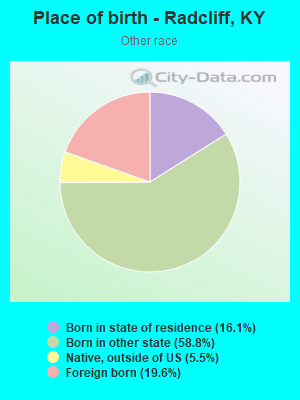
Place of birth - Born in state of residence (%) - Other Race
Place of birth - Born in other state (%)
Place of birth - Born in other state (%) - White
Place of birth - Born in other state (%) - Black or African American
Place of birth - Born in other state (%) - Asian
Place of birth - Born in other state (%) - Hispanic or Latino
Place of birth - Born in other state (%) - American Indian and Alaska Native
Place of birth - Born in other state (%) - Multirace
Place of birth - Born in other state (%) - Other Race
Place of birth - Native, outside of US (%)
Place of birth - Native, outside of US (%) - White
Place of birth - Native, outside of US (%) - Black or African American
Place of birth - Native, outside of US (%) - Asian
Place of birth - Native, outside of US (%) - Hispanic or Latino
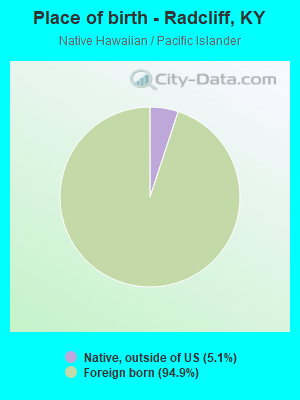
Place of birth - Native, outside of US (%) - American Indian and Alaska Native
Place of birth - Native, outside of US (%) - Multirace
Place of birth - Native, outside of US (%) - Other Race
Place of birth - Foreign born (%)
Place of birth - Foreign born (%) - White
Place of birth - Foreign born (%) - Black or African American
Place of birth - Foreign born (%) - Asian
Place of birth - Foreign born (%) - Hispanic or Latino
Place of birth - Foreign born (%) - American Indian and Alaska Native
Place of birth - Foreign born (%) - Multirace
Place of birth - Foreign born (%) - Other Race
Residents speaking English at home (%)
Residents speaking English at home - Born in the United States (%)
Residents speaking English at home - Native, born elsewhere (%)
Residents speaking English at home - Foreign born (%)
Residents speaking Spanish at home (%)
Residents speaking Spanish at home - Born in the United States (%)
Residents speaking Spanish at home - Native, born elsewhere (%)
Residents speaking Spanish at home - Foreign born (%)
Residents speaking other language at home (%)
Residents speaking other language at home - Born in the United States (%)
Residents speaking other language at home - Native, born elsewhere (%)
Residents speaking other language at home - Foreign born (%)
Marital status - Never married (%)
Marital status - Now married (%)
Marital status - Separated (%)
Marital status - Widowed (%)
Marital status - Divorced (%)
Ancestries Reported - Arab (%)
Ancestries Reported - Czech (%)
Ancestries Reported - Danish (%)
Ancestries Reported - Dutch (%)
Ancestries Reported - English (%)
Ancestries Reported - French (%)
Ancestries Reported - French Canadian (%)
Ancestries Reported - German (%)
Ancestries Reported - Greek (%)
Ancestries Reported - Hungarian (%)
Ancestries Reported - Irish (%)
Ancestries Reported - Italian (%)
Ancestries Reported - Lithuanian (%)
Ancestries Reported - Norwegian (%)
Ancestries Reported - Polish (%)
Ancestries Reported - Portuguese (%)
Ancestries Reported - Russian (%)
Ancestries Reported - Scotch-Irish (%)
Ancestries Reported - Scottish (%)
Ancestries Reported - Slovak (%)
Ancestries Reported - Subsaharan African (%)
Ancestries Reported - Swedish (%)
Ancestries Reported - Swiss (%)
Ancestries Reported - Ukrainian (%)
Ancestries Reported - United States (%)
Ancestries Reported - Welsh (%)
Ancestries Reported - West Indian (%)
Ancestries Reported - Other (%)
Geographical mobility - Same house 1 year ago (%)
Geographical mobility - Same house 1 year ago (%) - White
Geographical mobility - Same house 1 year ago (%) - Black or African American
Geographical mobility - Same house 1 year ago (%) - Asian
Geographical mobility - Same house 1 year ago (%) - Hispanic or Latino
Geographical mobility - Same house 1 year ago (%) - American Indian and Alaska Native
Geographical mobility - Same house 1 year ago (%) - Multirace
Geographical mobility - Same house 1 year ago (%) - Other Race
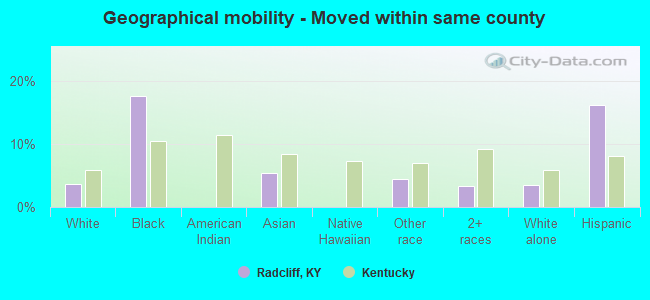
Geographical mobility - Moved within same county (%)
Geographical mobility - Moved within same county (%) - White
Geographical mobility - Moved within same county (%) - Black or African American
Geographical mobility - Moved within same county (%) - Asian
Geographical mobility - Moved within same county (%) - Hispanic or Latino
Geographical mobility - Moved within same county (%) - American Indian and Alaska Native
Geographical mobility - Moved within same county (%) - Multirace
Geographical mobility - Moved within same county (%) - Other Race
Geographical mobility - Moved from different county within same state (%)
Geographical mobility - Moved from different county within same state (%) - White
Geographical mobility - Moved from different county within same state (%) - Black or African American
Geographical mobility - Moved from different county within same state (%) - Asian
Geographical mobility - Moved from different county within same state (%) - Hispanic or Latino
Geographical mobility - Moved from different county within same state (%) - American Indian and Alaska Native
Geographical mobility - Moved from different county within same state (%) - Multirace
Geographical mobility - Moved from different county within same state (%) - Other Race
Geographical mobility - Moved from different state (%)
Geographical mobility - Moved from different state (%) - White
Geographical mobility - Moved from different state (%) - Black or African American
Geographical mobility - Moved from different state (%) - Asian
Geographical mobility - Moved from different state (%) - Hispanic or Latino
Geographical mobility - Moved from different state (%) - American Indian and Alaska Native
Geographical mobility - Moved from different state (%) - Multirace
Geographical mobility - Moved from different state (%) - Other Race
Geographical mobility - Moved from abroad (%)
Geographical mobility - Moved from abroad (%) - White
Geographical mobility - Moved from abroad (%) - Black or African American
Geographical mobility - Moved from abroad (%) - Asian
Geographical mobility - Moved from abroad (%) - Hispanic or Latino
Geographical mobility - Moved from abroad (%) - American Indian and Alaska Native
Geographical mobility - Moved from abroad (%) - Multirace
Geographical mobility - Moved from abroad (%) - Other Race
Place of birth for the foreign-born population - Ireland (%)
Place of birth for the foreign-born population - Denmark (%)
Place of birth for the foreign-born population - Norway (%)
Place of birth for the foreign-born population - Sweden (%)
Place of birth for the foreign-born population - United Kingdom (%)
Place of birth for the foreign-born population - England (%)
Place of birth for the foreign-born population - Scotland (%)
Place of birth for the foreign-born population - Other Northern Europe (%)
Place of birth for the foreign-born population - Austria (%)
Place of birth for the foreign-born population - Belgium (%)
Place of birth for the foreign-born population - France (%)
Place of birth for the foreign-born population - Germany (%)
Place of birth for the foreign-born population - Netherlands (%)
Place of birth for the foreign-born population - Switzerland (%)
Place of birth for the foreign-born population - Other Western Europe (%)
Place of birth for the foreign-born population - Greece (%)
Place of birth for the foreign-born population - Italy (%)
Place of birth for the foreign-born population - Portugal (%)
Place of birth for the foreign-born population - Spain (%)
Place of birth for the foreign-born population - Other Southern Europe (%)
Place of birth for the foreign-born population - Albania (%)
Place of birth for the foreign-born population - Belarus (%)
Place of birth for the foreign-born population - Bosnia and Herzegovina (%)
Place of birth for the foreign-born population - Bulgaria (%)
Place of birth for the foreign-born population - Croatia (%)
Place of birth for the foreign-born population - Czechoslovakia (%)
Place of birth for the foreign-born population - Hungary (%)
Place of birth for the foreign-born population - Latvia (%)
Place of birth for the foreign-born population - Lithuania (%)
Place of birth for the foreign-born population - North Macedonia (Macedonia) (%)
Place of birth for the foreign-born population - Moldova (%)
Place of birth for the foreign-born population - Poland (%)
Place of birth for the foreign-born population - Romania (%)
Place of birth for the foreign-born population - Russia (%)
Place of birth for the foreign-born population - Serbia (%)
Place of birth for the foreign-born population - Ukraine (%)
Place of birth for the foreign-born population - Other Eastern Europe (%)
Place of birth for the foreign-born population - China (%)
Place of birth for the foreign-born population - Hong Kong (%)
Place of birth for the foreign-born population - Taiwan (%)
Place of birth for the foreign-born population - Japan (%)
Place of birth for the foreign-born population - Korea (%)
Place of birth for the foreign-born population - Other Eastern Asia (%)
Place of birth for the foreign-born population - Afghanistan (%)
Place of birth for the foreign-born population - Bangladesh (%)
Place of birth for the foreign-born population - India (%)
Place of birth for the foreign-born population - Iran (%)
Place of birth for the foreign-born population - Kazakhstan (%)
Place of birth for the foreign-born population - Nepal (%)
Place of birth for the foreign-born population - Pakistan (%)
Place of birth for the foreign-born population - Sri Lanka (%)
Place of birth for the foreign-born population - Uzbekistan (%)
Place of birth for the foreign-born population - Other South Central Asia (%)
Place of birth for the foreign-born population - Burma (%)
Place of birth for the foreign-born population - Cambodia (%)
Place of birth for the foreign-born population - Indonesia (%)
Place of birth for the foreign-born population - Laos (%)
Place of birth for the foreign-born population - Malaysia (%)
Place of birth for the foreign-born population - Philippines (%)
Place of birth for the foreign-born population - Singapore (%)
Place of birth for the foreign-born population - Thailand (%)
Place of birth for the foreign-born population - Vietnam (%)
Place of birth for the foreign-born population - Other South Eastern Asia (%)
Place of birth for the foreign-born population - Armenia (%)
Place of birth for the foreign-born population - Iraq (%)
Place of birth for the foreign-born population - Israel (%)
Place of birth for the foreign-born population - Jordan (%)
Place of birth for the foreign-born population - Kuwait (%)
Place of birth for the foreign-born population - Lebanon (%)
Place of birth for the foreign-born population - Saudi Arabia (%)
Place of birth for the foreign-born population - Syria (%)
Place of birth for the foreign-born population - Turkey (%)
Place of birth for the foreign-born population - Yemen (%)
Place of birth for the foreign-born population - Other Western Asia (%)
Place of birth for the foreign-born population - Eritrea (%)
Place of birth for the foreign-born population - Ethiopia (%)
Place of birth for the foreign-born population - Kenya (%)
Place of birth for the foreign-born population - Somalia (%)
Place of birth for the foreign-born population - Uganda (%)
Place of birth for the foreign-born population - Zimbabwe (%)
Place of birth for the foreign-born population - Other Eastern Africa (%)
Place of birth for the foreign-born population - Cameroon (%)
Place of birth for the foreign-born population - Congo (%)
Place of birth for the foreign-born population - Democratic Republic of Congo (Zaire) (%)
Place of birth for the foreign-born population - Other Middle Africa (%)
Place of birth for the foreign-born population - Egypt (%)
Place of birth for the foreign-born population - Morocco (%)
Place of birth for the foreign-born population - Sudan (%)
Place of birth for the foreign-born population - Other Northern Africa (%)
Place of birth for the foreign-born population - South Africa (%)
Place of birth for the foreign-born population - Other Southern Africa (%)
Place of birth for the foreign-born population - Cabo Verde (%)
Place of birth for the foreign-born population - Ghana (%)
Place of birth for the foreign-born population - Liberia (%)
Place of birth for the foreign-born population - Nigeria (%)
Place of birth for the foreign-born population - Senegal (%)
Place of birth for the foreign-born population - Sierra Leone (%)
Place of birth for the foreign-born population - Other Western Africa (%)
Place of birth for the foreign-born population - Australia (%)
Place of birth for the foreign-born population - New Zealand (%)
Place of birth for the foreign-born population - Fiji (%)
Place of birth for the foreign-born population - Micronesia (%)
Place of birth for the foreign-born population - Bahamas (%)
Place of birth for the foreign-born population - Barbados (%)
Place of birth for the foreign-born population - Cuba (%)
Place of birth for the foreign-born population - Dominica (%)
Place of birth for the foreign-born population - Dominican Republic (%)
Place of birth for the foreign-born population - Grenada (%)
Place of birth for the foreign-born population - Haiti (%)
Place of birth for the foreign-born population - Jamaica (%)
Place of birth for the foreign-born population - St. Vincent and the Grenadines (%)
Place of birth for the foreign-born population - Trinidad and Tobago (%)
Place of birth for the foreign-born population - West Indies (%)
Place of birth for the foreign-born population - Other Caribbean (%)
Place of birth for the foreign-born population - Belize (%)
Place of birth for the foreign-born population - Costa Rica (%)
Place of birth for the foreign-born population - El Salvador (%)
Place of birth for the foreign-born population - Guatemala (%)
Place of birth for the foreign-born population - Honduras (%)
Place of birth for the foreign-born population - Mexico (%)
Place of birth for the foreign-born population - Nicaragua (%)
Place of birth for the foreign-born population - Panama (%)
Place of birth for the foreign-born population - Other Central America (%)
Place of birth for the foreign-born population - Argentina (%)
Place of birth for the foreign-born population - Bolivia (%)
Place of birth for the foreign-born population - Brazil (%)
Place of birth for the foreign-born population - Chile (%)
Place of birth for the foreign-born population - Colombia (%)
Place of birth for the foreign-born population - Ecuador (%)
Place of birth for the foreign-born population - Guyana (%)
Place of birth for the foreign-born population - Peru (%)
Place of birth for the foreign-born population - Uruguay (%)
Place of birth for the foreign-born population - Venezuela (%)
Place of birth for the foreign-born population - Other South America (%)
Place of birth for the foreign-born population - Canada (%)
Place of birth for the foreign-born population - Other Northern America (%)
Place of birth for the foreign-born population - Other (%)
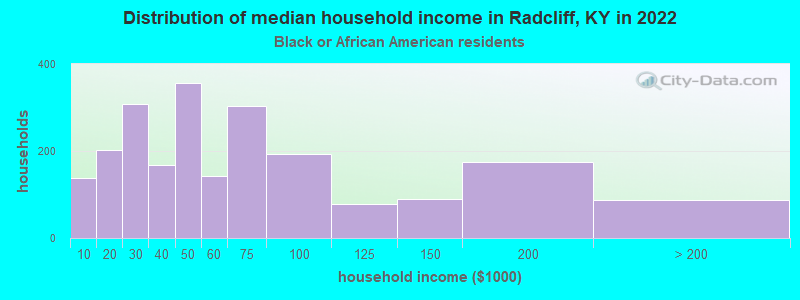
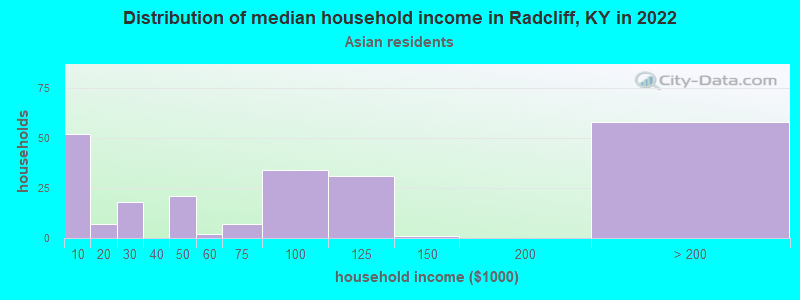
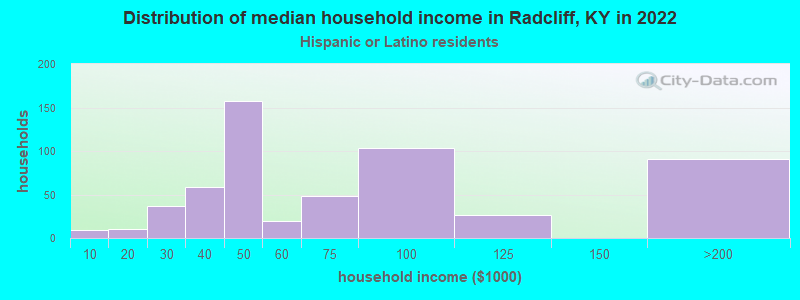
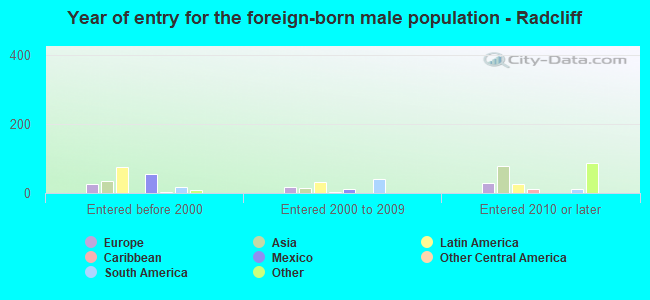
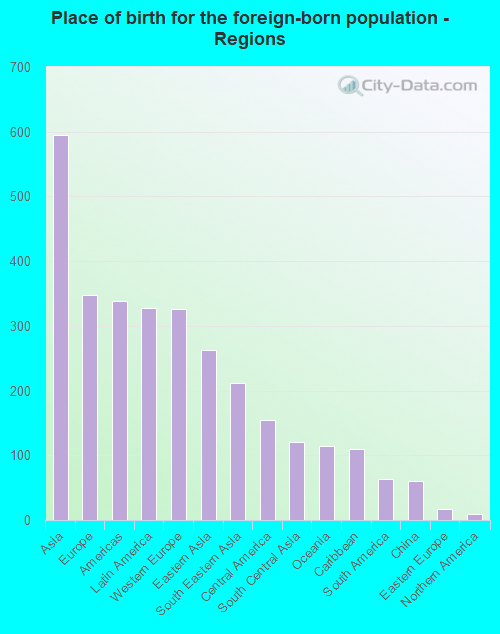
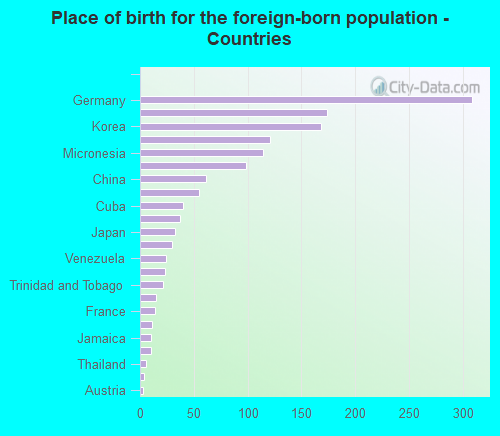
According to 2022 data, the most numerous races in Radcliff, KY are White alone (12,543 residents), Black alone (4,437 residents), and Hispanic (2,080 residents). 91.6% of Radcliff residents speak English at home. 6.0% of Radcliff, KY residents are foreign-born (2.5% born in Asia, 1.5% born in Europe, 1.4% born in Latin America), which is 33.6% greater than the foreign-born rate of 4.0% across the entire state of Kentucky.
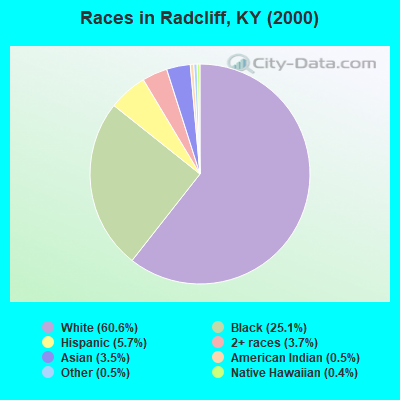
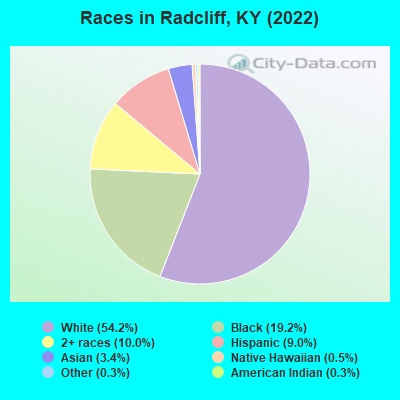
Race distribution in Radcliff
2000 2022
3,608,013 89.3% White alone 293,639 7.3% Black alone 59,939 1.5% Hispanic 37,750 0.9% Two or more races 29,368 0.7% Asian alone 7,939 0.2% American Indian alone 3,846 0.10% Other race alone 1,275 0.03% Native Hawaiian and Other
3,710,998 82.2% White alone 343,194 7.6% Black alone 187,483 4.2% Hispanic 187,394 4.2% Two or more races 62,240 1.4% Asian alone 13,529 0.3% Other race alone 4,302 0.10% American Indian alone 3,170 0.07% Native Hawaiian and Other
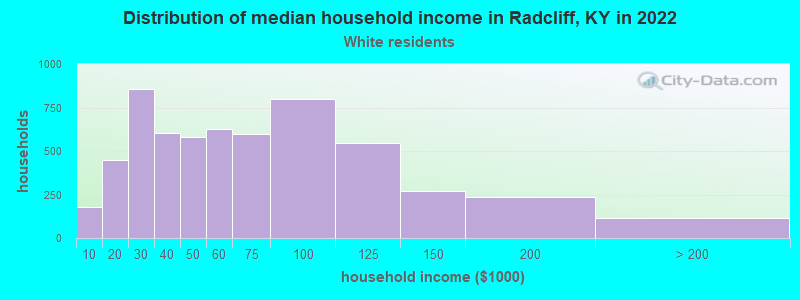
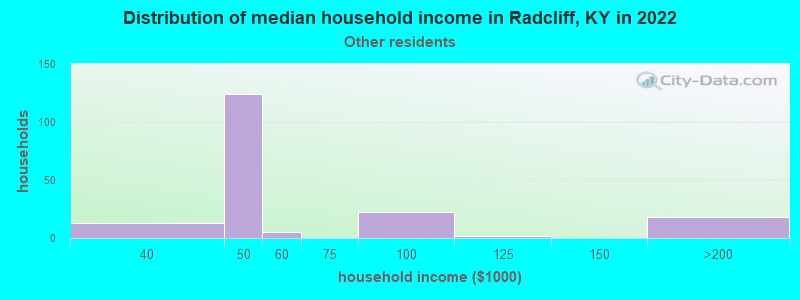
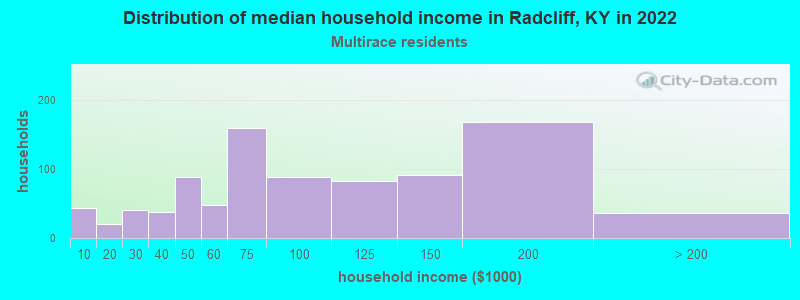
Income and house value in Radcliff Median household income in 2022 $54,961 White non-Hispanic householders$46,489 Black householders$49,479 Some other race householders$87,621 Two or more races householders$42,345 Hispanic or Latino race householdersMedian 2022 house value $175,345 White Non-Hispanic householders$178,721 Black or African American householders$101,915 American Indian or Alaska Native householders $174,923 Asian householders$164,794 Native Hawaiian and other Pacific Islander householders$160,996 Some other race householders$194,335 Two or more races householders$177,033 Hispanic or Latino householders
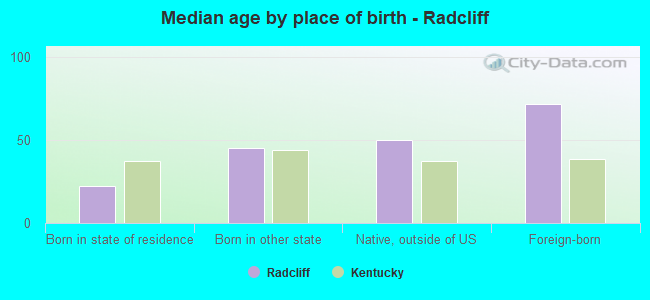
Median age by race in Radcliff
37.7 Median age for White residents37.2 37.8 38.8 Median age for Black or African American residents47.9 33.3 49.8 Median age for American Indian / Alaska Native residents58.4 -630,065,358.8 41.7 Median age for Asian residents25.3 66.6 13.6 Median age for Native Hawaiian / Pacific Islander residents-304,444,444.1 -853,801,168.7 27.6 Median age for Other race residents23.5 39.0 30.4 Median age for Two or more races residents26.3 29.7 37.6 Median age for White alone residents37.3 37.7 20.9 Median age for Hispanic or Latino residents22.1 22.3
Owner/renter occupied households by race in Radcliff
House owners and renters - White residents 3,220 56.3% Owner occupied2,499 43.7% Renter occupiedHouse owners and renters - Black or African American residents 945 48.5% Owner occupied1,002 51.5% Renter occupiedHouse owners and renters - American Indian / Alaska Native residents 20 100.0% Owner occupiedHouse owners and renters - Asian residents 137 60.7% Owner occupied89 39.3% Renter occupiedHouse owners and renters - Native Hawaiian / Pacific Islander residents 51 100.0% Renter occupiedHouse owners and renters - Other race residents 30 13.3% Owner occupied193 86.7% Renter occupiedHouse owners and renters - Two or more races residents 423 52.4% Owner occupied385 47.6% Renter occupiedHouse owners and renters - White alone residents 3,077 56.0% Owner occupied2,416 44.0% Renter occupiedHouse owners and renters - Hispanic or Latino residents 240 41.4% Owner occupied340 58.6% Renter occupied
Language usage in Radcliff
English speakers - Total 91.6% of residents of Radcliff speak English at home.
3.2% of residents speak Spanish at home 537 77.4% Speak English very well157 22.6% Speak English less than very well5.0% of residents speak other language at home 678 63.3% Speak English very well393 36.7% Speak English less than very well
English speakers - Born in the United States 95.4% of residents of Radcliff speak English at home.
3.3% of residents speak Spanish at home 300 81.7% Speak English very well67 18.3% Speak English less than very well1.2% of residents speak other language at home 134 100.0% Speak English very well
English speakers - Native, born elsewhere 75.2% of residents of Radcliff speak English at home.
18.4% of residents speak Spanish at home 77 68.1% Speak English very well36 31.9% Speak English less than very well4.4% of residents speak other language at home 27 100.0% Speak English very well
English speakers - Foreign-born 23.1% of residents of Radcliff speak English at home.
23.8% of residents speak Spanish at home 210 67.5% Speak English very well101 32.5% Speak English less than very well65.1% of residents speak other language at home 415 48.8% Speak English very well435 51.2% Speak English less than very well
White (Caucasian) - Speak only English Native:
98.2% (11,691)Foreign-born:
40.5% (168)
White (Caucasian) - Speak another language Native:
1.8% (214)Foreign-born:
59.6% (247)
Black or African American - Speak only English Native:
99.2% (5,620)Foreign-born:
100.0% (35)
Asian - Speak only English Native:
91.1% (197)Foreign-born:
13.0% (56)
Asian - Speak another language Native:
7.1% (15)Foreign-born:
87.1% (378)
Native Hawaiian / Pacific Islander - Speak another language Native:
100.0% (10)Foreign-born:
100.0% (115)
Other race - Speak another language Native:
29.6% (121)Foreign-born:
98.6% (112)
Two or more races - Speak only English Native:
84.4% (2,050)Foreign-born:
31.0% (89)
Two or more races - Speak another language Native:
14.9% (363)Foreign-born:
69.0% (199)
White alone - Speak only English Native:
99.1% (11,461)Foreign-born:
51.4% (181)
White alone - Speak another language Native:
0.9% (106)Foreign-born:
48.9% (172)
Hispanic or Latino - Speak only English Native:
81.1% (1,352)Foreign-born:
5.6% (19)
Hispanic or Latino - Speak another language Native:
23.9% (398)Foreign-born:
92.8% (317)
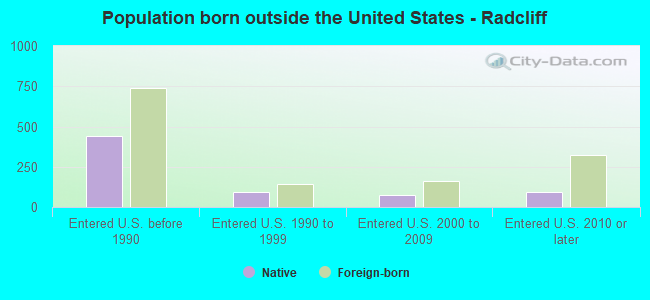
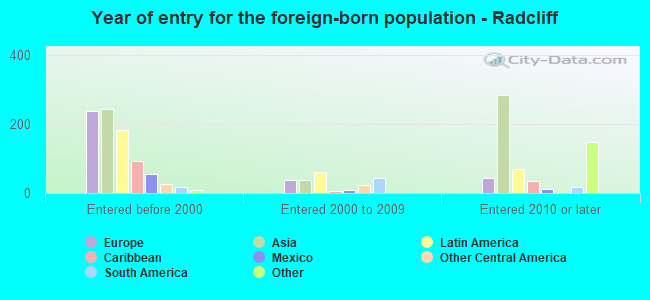
Foreign-born residents in Radcliff 1,396 residents are foreign born (2.5% Asia , 1.5% Europe , 1.4% Latin America ).
This city:
6.0%Kentucky:
4.1%
Marital status for residents in Radcliff Marital status - White (Caucasian) population 15 years and over
Males 32.7% Never married44.5% Now married3.0% Separated4.1% Widowed15.7% DivorcedFemales 21.9% Never married40.3% Now married3.4% Separated12.2% Widowed22.2% DivorcedWomen who gave birth in the past 12 months Now married:
55.3% (93)Unmarried:
44.7% (75)
Women who did not give birth in the past 12 months Now married:
40.5% (1,288)Unmarried:
59.5% (1,889)
Marital status - Black or African American population 15 years and over
Males 49.0% Never married27.3% Now married3.2% Separated5.4% Widowed15.1% DivorcedFemales 37.8% Never married26.7% Now married8.1% Separated5.9% Widowed21.5% DivorcedWomen who gave birth in the past 12 months Now married:
100.0% (22)Unmarried:
0.0% (0)
Women who did not give birth in the past 12 months Now married:
29.6% (392)Unmarried:
70.4% (931)
Marital status - American Indian / Alaska Native population 15 years and over
Males 3.2% Never married96.8% Now married0.0% Separated0.0% Widowed0.0% DivorcedFemales 0.0% Never married100.0% Now married0.0% Separated0.0% Widowed0.0% DivorcedMarital status - Asian population 15 years and over
Males 34.2% Never married38.5% Now married13.8% Separated0.0% Widowed13.5% DivorcedFemales 26.7% Never married62.0% Now married0.0% Separated11.3% Widowed0.0% DivorcedWomen who did not give birth in the past 12 months Now married:
37.9% (47)Unmarried:
62.1% (78)
Marital status - Native Hawaiian / Pacific Islander population 15 years and over
Males 0.0% Never married100.0% Now married0.0% Separated0.0% Widowed0.0% DivorcedFemales 0.0% Never married81.6% Now married0.0% Separated18.4% Widowed0.0% DivorcedWomen who did not give birth in the past 12 months Now married:
100.0% (42)Unmarried:
0.0% (0)
Marital status - Other race population 15 years and over
Males 81.9% Never married18.1% Now married0.0% Separated0.0% Widowed0.0% DivorcedFemales 71.5% Never married24.8% Now married0.0% Separated0.0% Widowed3.7% DivorcedWomen who gave birth in the past 12 months Now married:
100.0% (18)Unmarried:
0.0% (0)
Women who did not give birth in the past 12 months Now married:
0.0% (0)Unmarried:
100.0% (244)
Marital status - Two or more races population 15 years and over
Males 45.2% Never married34.8% Now married4.7% Separated0.0% Widowed15.4% DivorcedFemales 36.6% Never married37.0% Now married6.9% Separated5.1% Widowed14.5% DivorcedWomen who gave birth in the past 12 months Now married:
63.6% (20)Unmarried:
36.4% (11)
Women who did not give birth in the past 12 months Now married:
49.3% (326)Unmarried:
50.7% (334)
Marital status - White alone, not Hispanic / Latino population 15 years and over
Males 33.0% Never married43.6% Now married3.0% Separated4.2% Widowed16.1% DivorcedFemales 22.5% Never married39.5% Now married3.6% Separated12.2% Widowed22.3% DivorcedWomen who gave birth in the past 12 months Now married:
55.3% (93)Unmarried:
44.7% (76)
Women who did not give birth in the past 12 months Now married:
39.0% (1,186)Unmarried:
61.0% (1,858)
Marital status - Hispanic or Latino population 15 years and over
Males 52.9% Never married37.0% Now married3.2% Separated0.0% Widowed6.9% DivorcedFemales 31.4% Never married43.2% Now married8.5% Separated4.8% Widowed12.1% DivorcedWomen who gave birth in the past 12 months Now married:
100.0% (54)Unmarried:
0.0% (0)
Women who did not give birth in the past 12 months Now married:
46.6% (206)Unmarried:
53.4% (236)
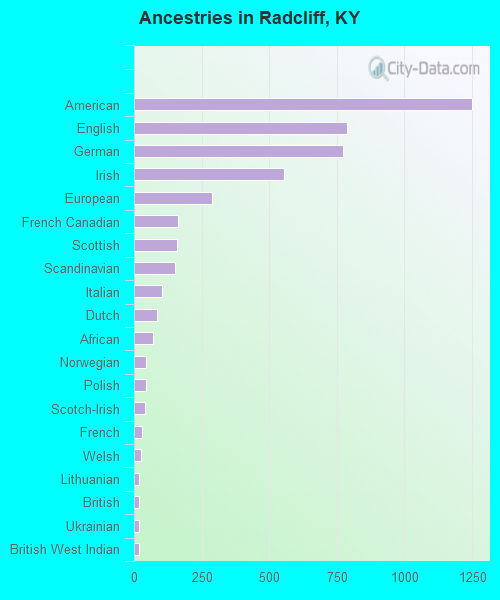
Ancestries in Radcliff
1,250 10.9% American786 6.9% English774 6.8% German554 4.8% Irish287 2.5% European164 1.4% French Canadian159 1.4% Scottish150 1.3% Scandinavian104 0.9% Italian84 0.7% Dutch70 0.6% African46 0.4% Norwegian43 0.4% Polish39 0.3% Scotch-Irish29 0.3% French26 0.2% Welsh20 0.2% Lithuanian18 0.2% British18 0.2% Ukrainian18 0.2% British West Indian10 0.09% Swedish9 0.08% Canadian9 0.08% Pennsylvania German9 0.08% Yugoslavian7 0.06% West Indian6 0.05% Eastern European
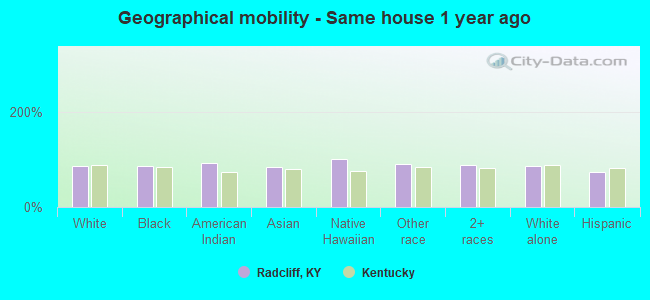
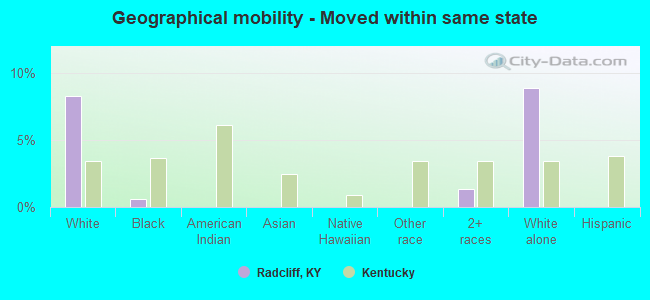
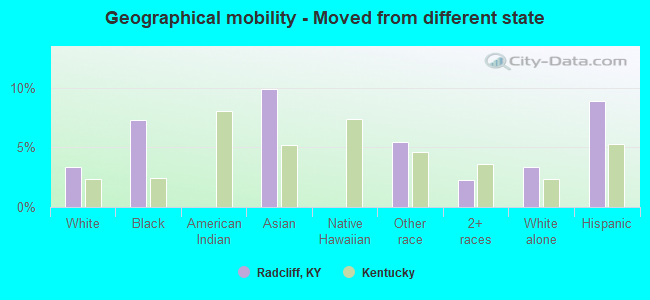
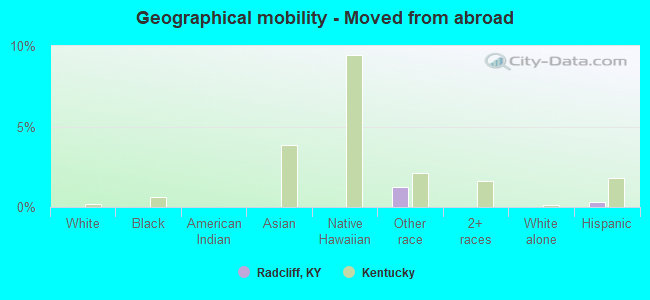
Geographical mobility in Radcliff Same house 1 year ago 10,993 84.9% White (Caucasian)4,443 85.2% Black or African American48 91.6% American Indian / Alaska Native584 84.5% Asian130 100.0% Native Hawaiian / Pacific Islander489 90.4% Other race2,560 86.5% Two or more races10,598 84.7% White alone, not Hispanic / Latino1,426 73.3% Hispanic or LatinoMoved within same county 463 3.6% White / Caucasian920 17.6% Black or African American38 5.4% Asian24 4.4% Other race100 3.4% Two or more races440 3.5% White alone, not Hispanic / Latino315 16.2% Hispanic or LatinoMoved within same state 1,071 8.3% White / Caucasian31 0.6% Black or African American40 1.4% Two or more races1,109 8.9% White alone, not Hispanic / LatinoMoved from different state 431 3.3% White / Caucasian380 7.3% Black or African American68 9.9% Asian30 5.5% Other race66 2.2% Two or more races415 3.3% White alone, not Hispanic / Latino174 8.9% Hispanic or LatinoMoved from abroad 7 1.3% Other race6 0.3% Hispanic or Latino
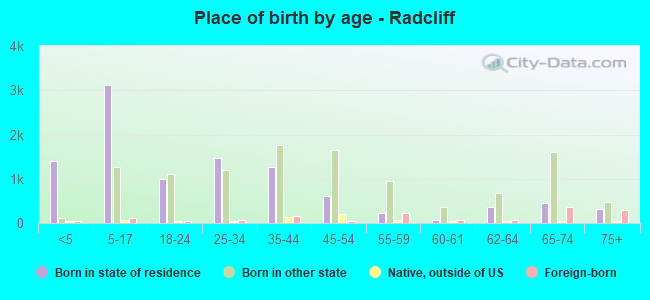
Children Nativity (place of birth) in Radcliff
Children under 6 years - Living with two parents Both parents native 855 100.0% NativeBoth parents foreign-born 1 84.4% NativeOne native, one foreign-born parent 92 100.0% NativeChildren under 6 years - Living with one parent Native parent 856 100.0% NativeChildren 6 to 17 years - Living with two parents Both parents native 1,188 99.5% Native6 0.5% Foreign-bornBoth parents foreign-born 25 38.9% Native40 61.1% Foreign-bornOne native, one foreign-born parent 95 59.0% Native66 41.0% Foreign-bornChildren 6 to 17 years - Living with one parent Native parent 2,079 100.0% NativeForeign-born parent 23 49.5% Native24 50.5% Foreign-born
Grandparents responsible for own grandchildren in Radcliff
Grandparents (30 to 59 years) White / Caucasian 98 49.1% Responsible for grandchildren101 50.9% Not responsible for grandchildrenBlack or African American 24 20.8% Responsible for grandchildren90 79.2% Not responsible for grandchildrenOther race 8 100.0% Not responsible for grandchildrenTwo or more races 15 100.0% Not responsible for grandchildrenWhite alone, not Hispanic / Latino 98 48.7% Responsible for grandchildren103 51.3% Not responsible for grandchildrenHispanic or Latino 18 100.0% Not responsible for grandchildrenGrandparents (60 years and over) White / Caucasian 116 46.6% Responsible for grandchildren133 53.4% Not responsible for grandchildrenBlack or African American 62 57.4% Responsible for grandchildren46 42.6% Not responsible for grandchildrenTwo or more races 42 100.0% Not responsible for grandchildrenWhite alone, not Hispanic / Latino 116 46.4% Responsible for grandchildren134 53.6% Not responsible for grandchildrenHispanic or Latino 15 100.0% Not responsible for grandchildren