Races in Rainbow City, Alabama (AL) Detailed Stats
Data:
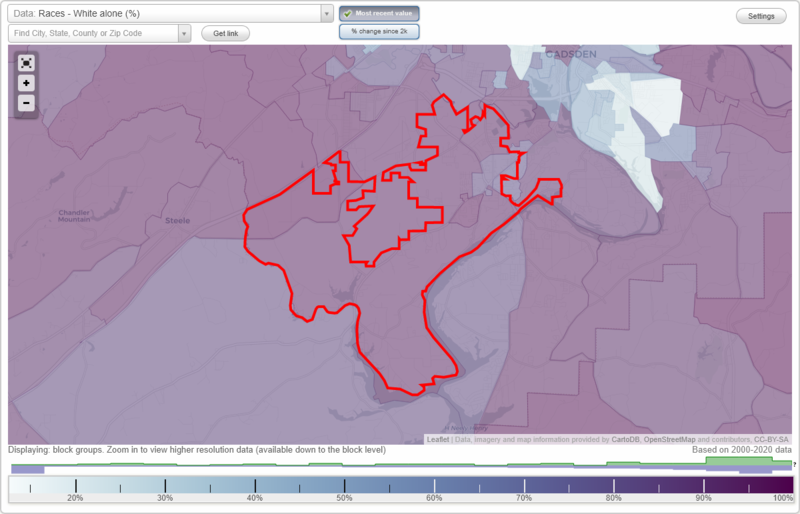
Races - White alone (%)
Races - White alone (% change since 2000)
Races - Black alone (%)
Races - Black alone (% change since 2000)
Races - American Indian alone (%)
Races - American Indian alone (% change since 2000)
Races - Asian alone (%)
Races - Asian alone (% change since 2000)
Races - Hispanic (%)
Races - Hispanic (% change since 2000)
Races - Native Hawaiian and Other Pacific Islander alone (%)
Races - Native Hawaiian and Other Pacific Islander alone (% change since 2000)
Races - Two or more races(%)
Races - Two or more races(% change since 2000)
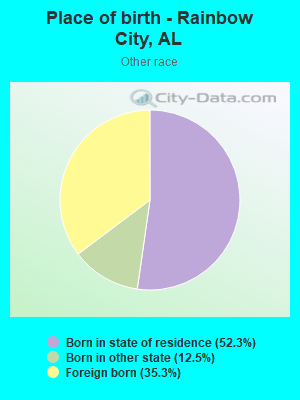
Races - Other race alone (%)
Races - Other race alone (% change since 2000)
Racial diversity
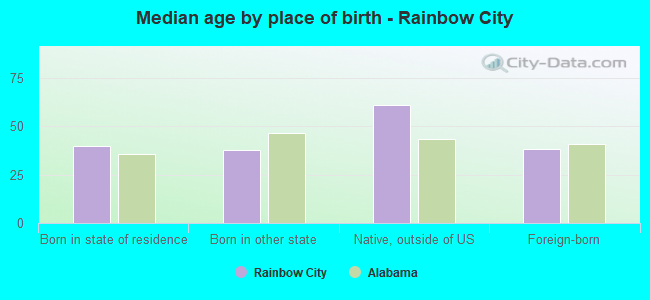
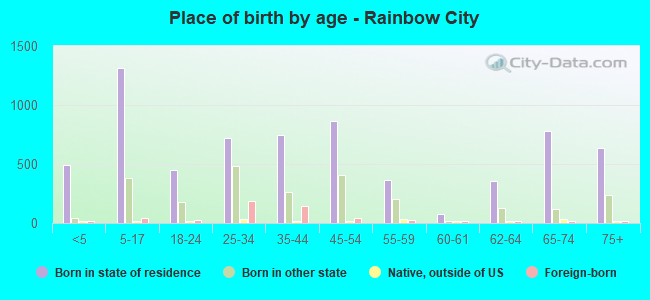
Place of birth - Born in state of residence (%)
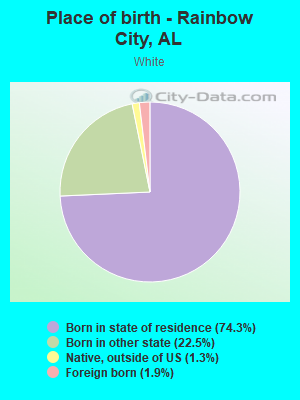
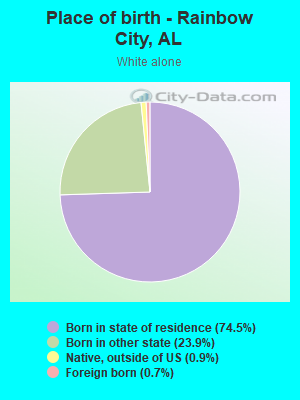
Place of birth - Born in state of residence (%) - White
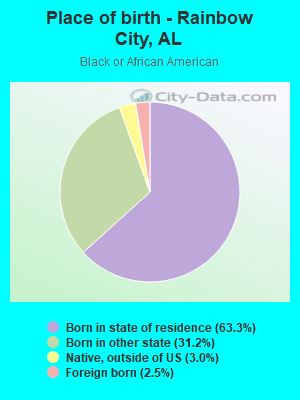
Place of birth - Born in state of residence (%) - Black or African American
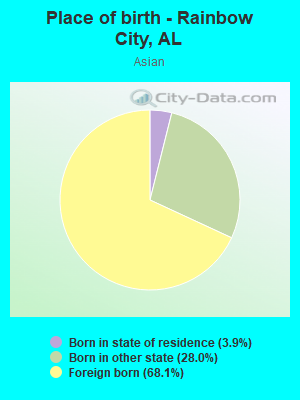
Place of birth - Born in state of residence (%) - Asian
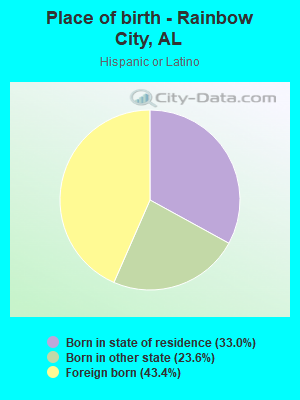
Place of birth - Born in state of residence (%) - Hispanic or Latino
Place of birth - Born in state of residence (%) - American Indian and Alaska Native
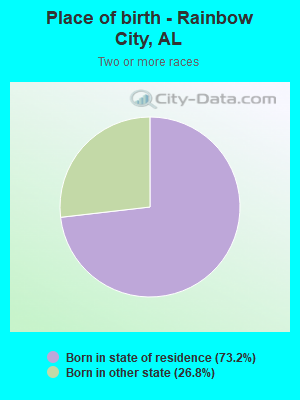
Place of birth - Born in state of residence (%) - Multirace
Place of birth - Born in state of residence (%) - Other Race
Place of birth - Born in other state (%)
Place of birth - Born in other state (%) - White
Place of birth - Born in other state (%) - Black or African American
Place of birth - Born in other state (%) - Asian
Place of birth - Born in other state (%) - Hispanic or Latino
Place of birth - Born in other state (%) - American Indian and Alaska Native
Place of birth - Born in other state (%) - Multirace
Place of birth - Born in other state (%) - Other Race
Place of birth - Native, outside of US (%)
Place of birth - Native, outside of US (%) - White
Place of birth - Native, outside of US (%) - Black or African American
Place of birth - Native, outside of US (%) - Asian
Place of birth - Native, outside of US (%) - Hispanic or Latino
Place of birth - Native, outside of US (%) - American Indian and Alaska Native
Place of birth - Native, outside of US (%) - Multirace
Place of birth - Native, outside of US (%) - Other Race
Place of birth - Foreign born (%)
Place of birth - Foreign born (%) - White
Place of birth - Foreign born (%) - Black or African American
Place of birth - Foreign born (%) - Asian
Place of birth - Foreign born (%) - Hispanic or Latino
Place of birth - Foreign born (%) - American Indian and Alaska Native
Place of birth - Foreign born (%) - Multirace
Place of birth - Foreign born (%) - Other Race
Residents speaking English at home (%)
Residents speaking English at home - Born in the United States (%)
Residents speaking English at home - Native, born elsewhere (%)
Residents speaking English at home - Foreign born (%)
Residents speaking Spanish at home (%)
Residents speaking Spanish at home - Born in the United States (%)
Residents speaking Spanish at home - Native, born elsewhere (%)
Residents speaking Spanish at home - Foreign born (%)
Residents speaking other language at home (%)
Residents speaking other language at home - Born in the United States (%)
Residents speaking other language at home - Native, born elsewhere (%)
Residents speaking other language at home - Foreign born (%)
Marital status - Never married (%)
Marital status - Now married (%)
Marital status - Separated (%)
Marital status - Widowed (%)
Marital status - Divorced (%)
Ancestries Reported - Arab (%)
Ancestries Reported - Czech (%)
Ancestries Reported - Danish (%)
Ancestries Reported - Dutch (%)
Ancestries Reported - English (%)
Ancestries Reported - French (%)
Ancestries Reported - French Canadian (%)
Ancestries Reported - German (%)
Ancestries Reported - Greek (%)
Ancestries Reported - Hungarian (%)
Ancestries Reported - Irish (%)
Ancestries Reported - Italian (%)
Ancestries Reported - Lithuanian (%)
Ancestries Reported - Norwegian (%)
Ancestries Reported - Polish (%)
Ancestries Reported - Portuguese (%)
Ancestries Reported - Russian (%)
Ancestries Reported - Scotch-Irish (%)
Ancestries Reported - Scottish (%)
Ancestries Reported - Slovak (%)
Ancestries Reported - Subsaharan African (%)
Ancestries Reported - Swedish (%)
Ancestries Reported - Swiss (%)
Ancestries Reported - Ukrainian (%)
Ancestries Reported - United States (%)
Ancestries Reported - Welsh (%)
Ancestries Reported - West Indian (%)
Ancestries Reported - Other (%)
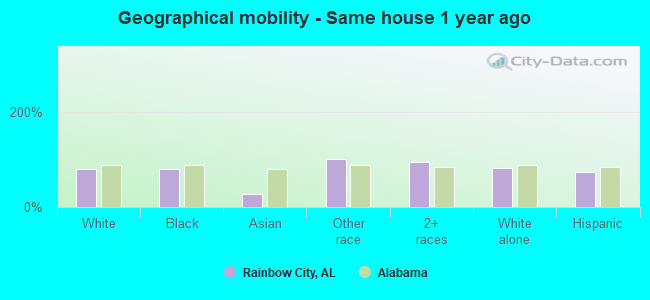
Geographical mobility - Same house 1 year ago (%)
Geographical mobility - Same house 1 year ago (%) - White
Geographical mobility - Same house 1 year ago (%) - Black or African American
Geographical mobility - Same house 1 year ago (%) - Asian
Geographical mobility - Same house 1 year ago (%) - Hispanic or Latino
Geographical mobility - Same house 1 year ago (%) - American Indian and Alaska Native
Geographical mobility - Same house 1 year ago (%) - Multirace
Geographical mobility - Same house 1 year ago (%) - Other Race
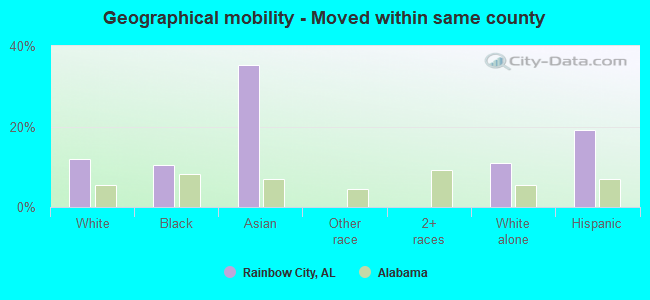
Geographical mobility - Moved within same county (%)
Geographical mobility - Moved within same county (%) - White
Geographical mobility - Moved within same county (%) - Black or African American
Geographical mobility - Moved within same county (%) - Asian
Geographical mobility - Moved within same county (%) - Hispanic or Latino
Geographical mobility - Moved within same county (%) - American Indian and Alaska Native
Geographical mobility - Moved within same county (%) - Multirace
Geographical mobility - Moved within same county (%) - Other Race
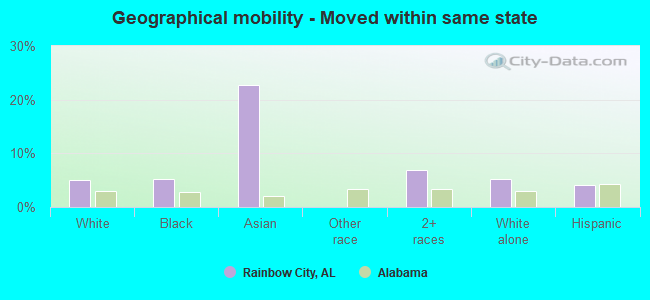
Geographical mobility - Moved from different county within same state (%)
Geographical mobility - Moved from different county within same state (%) - White
Geographical mobility - Moved from different county within same state (%) - Black or African American
Geographical mobility - Moved from different county within same state (%) - Asian
Geographical mobility - Moved from different county within same state (%) - Hispanic or Latino
Geographical mobility - Moved from different county within same state (%) - American Indian and Alaska Native
Geographical mobility - Moved from different county within same state (%) - Multirace
Geographical mobility - Moved from different county within same state (%) - Other Race
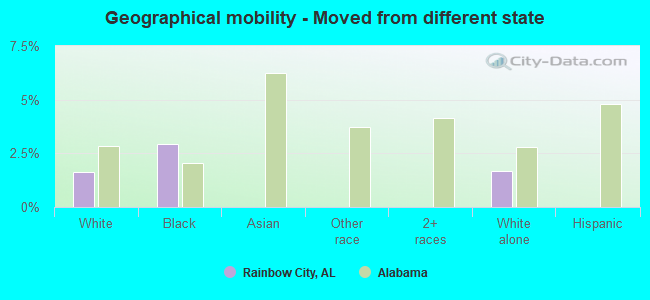
Geographical mobility - Moved from different state (%)
Geographical mobility - Moved from different state (%) - White
Geographical mobility - Moved from different state (%) - Black or African American
Geographical mobility - Moved from different state (%) - Asian
Geographical mobility - Moved from different state (%) - Hispanic or Latino
Geographical mobility - Moved from different state (%) - American Indian and Alaska Native
Geographical mobility - Moved from different state (%) - Multirace
Geographical mobility - Moved from different state (%) - Other Race
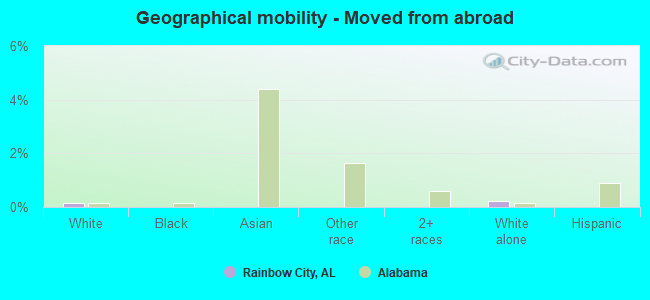
Geographical mobility - Moved from abroad (%)
Geographical mobility - Moved from abroad (%) - White
Geographical mobility - Moved from abroad (%) - Black or African American
Geographical mobility - Moved from abroad (%) - Asian
Geographical mobility - Moved from abroad (%) - Hispanic or Latino
Geographical mobility - Moved from abroad (%) - American Indian and Alaska Native
Geographical mobility - Moved from abroad (%) - Multirace
Geographical mobility - Moved from abroad (%) - Other Race
Place of birth for the foreign-born population - Ireland (%)
Place of birth for the foreign-born population - Denmark (%)
Place of birth for the foreign-born population - Norway (%)
Place of birth for the foreign-born population - Sweden (%)
Place of birth for the foreign-born population - United Kingdom (%)
Place of birth for the foreign-born population - England (%)
Place of birth for the foreign-born population - Scotland (%)
Place of birth for the foreign-born population - Other Northern Europe (%)
Place of birth for the foreign-born population - Austria (%)
Place of birth for the foreign-born population - Belgium (%)
Place of birth for the foreign-born population - France (%)
Place of birth for the foreign-born population - Germany (%)
Place of birth for the foreign-born population - Netherlands (%)
Place of birth for the foreign-born population - Switzerland (%)
Place of birth for the foreign-born population - Other Western Europe (%)
Place of birth for the foreign-born population - Greece (%)
Place of birth for the foreign-born population - Italy (%)
Place of birth for the foreign-born population - Portugal (%)
Place of birth for the foreign-born population - Spain (%)
Place of birth for the foreign-born population - Other Southern Europe (%)
Place of birth for the foreign-born population - Albania (%)
Place of birth for the foreign-born population - Belarus (%)
Place of birth for the foreign-born population - Bosnia and Herzegovina (%)
Place of birth for the foreign-born population - Bulgaria (%)
Place of birth for the foreign-born population - Croatia (%)
Place of birth for the foreign-born population - Czechoslovakia (%)
Place of birth for the foreign-born population - Hungary (%)
Place of birth for the foreign-born population - Latvia (%)
Place of birth for the foreign-born population - Lithuania (%)
Place of birth for the foreign-born population - North Macedonia (Macedonia) (%)
Place of birth for the foreign-born population - Moldova (%)
Place of birth for the foreign-born population - Poland (%)
Place of birth for the foreign-born population - Romania (%)
Place of birth for the foreign-born population - Russia (%)
Place of birth for the foreign-born population - Serbia (%)
Place of birth for the foreign-born population - Ukraine (%)
Place of birth for the foreign-born population - Other Eastern Europe (%)
Place of birth for the foreign-born population - China (%)
Place of birth for the foreign-born population - Hong Kong (%)
Place of birth for the foreign-born population - Taiwan (%)
Place of birth for the foreign-born population - Japan (%)
Place of birth for the foreign-born population - Korea (%)
Place of birth for the foreign-born population - Other Eastern Asia (%)
Place of birth for the foreign-born population - Afghanistan (%)
Place of birth for the foreign-born population - Bangladesh (%)
Place of birth for the foreign-born population - India (%)
Place of birth for the foreign-born population - Iran (%)
Place of birth for the foreign-born population - Kazakhstan (%)
Place of birth for the foreign-born population - Nepal (%)
Place of birth for the foreign-born population - Pakistan (%)
Place of birth for the foreign-born population - Sri Lanka (%)
Place of birth for the foreign-born population - Uzbekistan (%)
Place of birth for the foreign-born population - Other South Central Asia (%)
Place of birth for the foreign-born population - Burma (%)
Place of birth for the foreign-born population - Cambodia (%)
Place of birth for the foreign-born population - Indonesia (%)
Place of birth for the foreign-born population - Laos (%)
Place of birth for the foreign-born population - Malaysia (%)
Place of birth for the foreign-born population - Philippines (%)
Place of birth for the foreign-born population - Singapore (%)
Place of birth for the foreign-born population - Thailand (%)
Place of birth for the foreign-born population - Vietnam (%)
Place of birth for the foreign-born population - Other South Eastern Asia (%)
Place of birth for the foreign-born population - Armenia (%)
Place of birth for the foreign-born population - Iraq (%)
Place of birth for the foreign-born population - Israel (%)
Place of birth for the foreign-born population - Jordan (%)
Place of birth for the foreign-born population - Kuwait (%)
Place of birth for the foreign-born population - Lebanon (%)
Place of birth for the foreign-born population - Saudi Arabia (%)
Place of birth for the foreign-born population - Syria (%)
Place of birth for the foreign-born population - Turkey (%)
Place of birth for the foreign-born population - Yemen (%)
Place of birth for the foreign-born population - Other Western Asia (%)
Place of birth for the foreign-born population - Eritrea (%)
Place of birth for the foreign-born population - Ethiopia (%)
Place of birth for the foreign-born population - Kenya (%)
Place of birth for the foreign-born population - Somalia (%)
Place of birth for the foreign-born population - Uganda (%)
Place of birth for the foreign-born population - Zimbabwe (%)
Place of birth for the foreign-born population - Other Eastern Africa (%)
Place of birth for the foreign-born population - Cameroon (%)
Place of birth for the foreign-born population - Congo (%)
Place of birth for the foreign-born population - Democratic Republic of Congo (Zaire) (%)
Place of birth for the foreign-born population - Other Middle Africa (%)
Place of birth for the foreign-born population - Egypt (%)
Place of birth for the foreign-born population - Morocco (%)
Place of birth for the foreign-born population - Sudan (%)
Place of birth for the foreign-born population - Other Northern Africa (%)
Place of birth for the foreign-born population - South Africa (%)
Place of birth for the foreign-born population - Other Southern Africa (%)
Place of birth for the foreign-born population - Cabo Verde (%)
Place of birth for the foreign-born population - Ghana (%)
Place of birth for the foreign-born population - Liberia (%)
Place of birth for the foreign-born population - Nigeria (%)
Place of birth for the foreign-born population - Senegal (%)
Place of birth for the foreign-born population - Sierra Leone (%)
Place of birth for the foreign-born population - Other Western Africa (%)
Place of birth for the foreign-born population - Australia (%)
Place of birth for the foreign-born population - New Zealand (%)
Place of birth for the foreign-born population - Fiji (%)
Place of birth for the foreign-born population - Micronesia (%)
Place of birth for the foreign-born population - Bahamas (%)
Place of birth for the foreign-born population - Barbados (%)
Place of birth for the foreign-born population - Cuba (%)
Place of birth for the foreign-born population - Dominica (%)
Place of birth for the foreign-born population - Dominican Republic (%)
Place of birth for the foreign-born population - Grenada (%)
Place of birth for the foreign-born population - Haiti (%)
Place of birth for the foreign-born population - Jamaica (%)
Place of birth for the foreign-born population - St. Vincent and the Grenadines (%)
Place of birth for the foreign-born population - Trinidad and Tobago (%)
Place of birth for the foreign-born population - West Indies (%)
Place of birth for the foreign-born population - Other Caribbean (%)
Place of birth for the foreign-born population - Belize (%)
Place of birth for the foreign-born population - Costa Rica (%)
Place of birth for the foreign-born population - El Salvador (%)
Place of birth for the foreign-born population - Guatemala (%)
Place of birth for the foreign-born population - Honduras (%)
Place of birth for the foreign-born population - Mexico (%)
Place of birth for the foreign-born population - Nicaragua (%)
Place of birth for the foreign-born population - Panama (%)
Place of birth for the foreign-born population - Other Central America (%)
Place of birth for the foreign-born population - Argentina (%)
Place of birth for the foreign-born population - Bolivia (%)
Place of birth for the foreign-born population - Brazil (%)
Place of birth for the foreign-born population - Chile (%)
Place of birth for the foreign-born population - Colombia (%)
Place of birth for the foreign-born population - Ecuador (%)
Place of birth for the foreign-born population - Guyana (%)
Place of birth for the foreign-born population - Peru (%)
Place of birth for the foreign-born population - Uruguay (%)
Place of birth for the foreign-born population - Venezuela (%)
Place of birth for the foreign-born population - Other South America (%)
Place of birth for the foreign-born population - Canada (%)
Place of birth for the foreign-born population - Other Northern America (%)
Place of birth for the foreign-born population - Other (%)
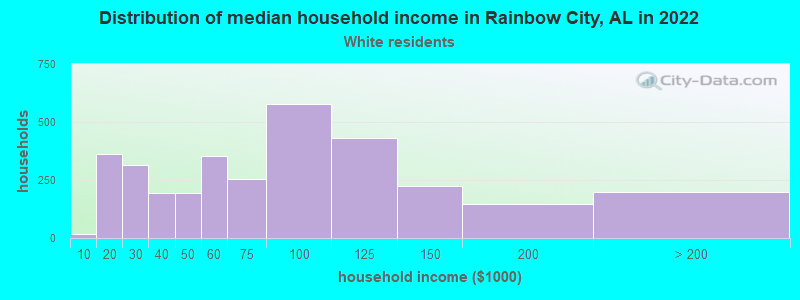
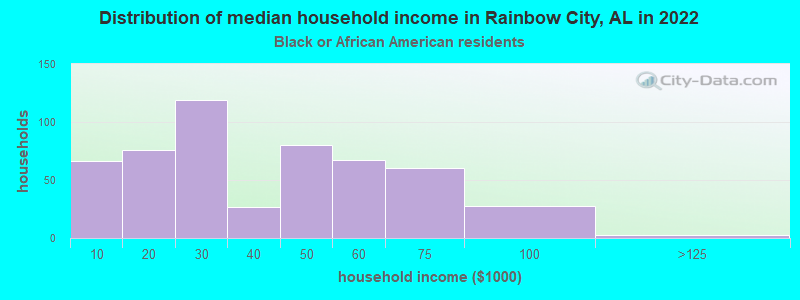
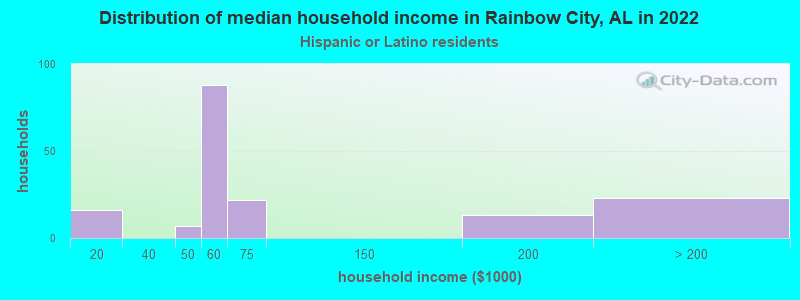
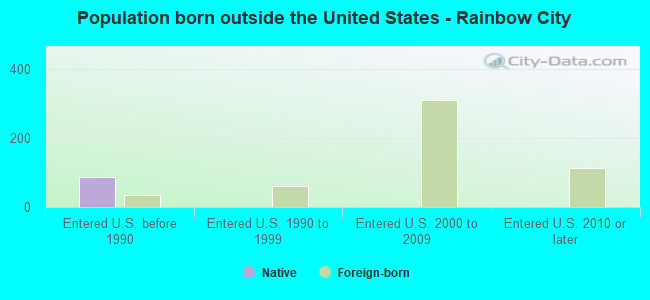
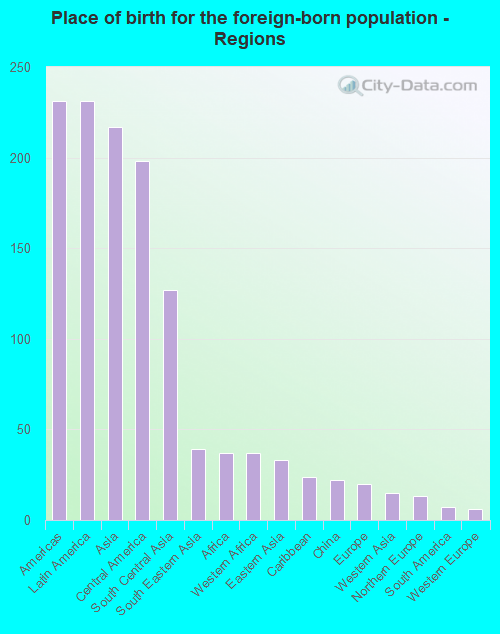
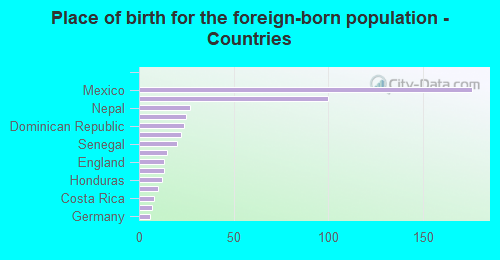
According to 2022 data, the most numerous races in Rainbow City, AL are White alone (7,837 residents), Black alone (950 residents), and Hispanic (583 residents). 93.6% of Rainbow City residents speak English at home. 5.1% of Rainbow City, AL residents are foreign-born (2.4% born in Latin America, 2.2% born in Asia), which is 41.7% greater than the foreign-born rate of 3.0% across the entire state of Alabama.
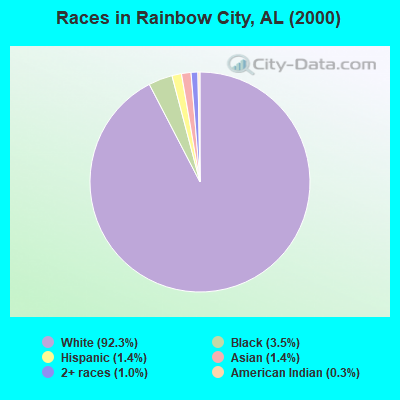
Race distribution in Rainbow City
2000 2022
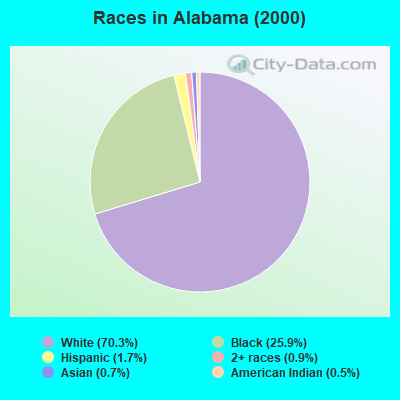
3,125,819 70.3% White alone 1,150,076 25.9% Black alone 75,830 1.7% Hispanic 39,086 0.9% Two or more races 30,989 0.7% Asian alone 21,618 0.5% American Indian alone 2,623 0.06% Other race alone 1,059 0.02% Native Hawaiian and Other
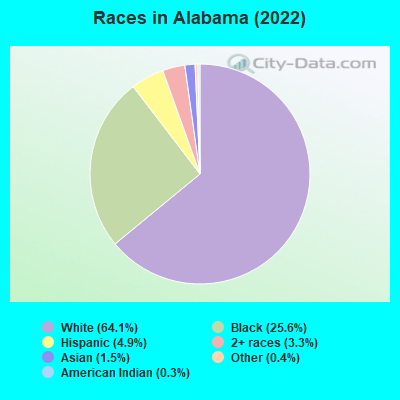
3,250,182 64.1% White alone 1,296,500 25.6% Black alone 246,477 4.9% Hispanic 169,880 3.3% Two or more races 76,682 1.5% Asian alone 19,927 0.4% Other race alone 12,694 0.3% American Indian alone 1,954 0.04% Native Hawaiian and Other
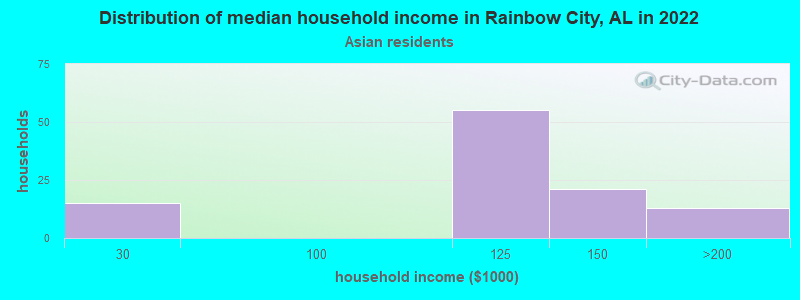
Income and house value in Rainbow City Median household income in 2022 $62,607 White non-Hispanic householders$33,088 Black householders$134,555 American Indian and Alaska Native householders$114,161 Asian householders$4,705 Some other race householders$90,212 Two or more races householders$21,412 Hispanic or Latino race householdersMedian 2022 house value $280,002 White Non-Hispanic householders$431,659 Black or African American householders $446,589 Asian householders
Median age by race in Rainbow City
43.4 Median age for White residents46.4 39.4 28.6 Median age for Black or African American residents11.0 35.2 26.9 Median age for American Indian / Alaska Native residents31.7 Median age for Asian residents31.5 37.3 47.1 Median age for Native Hawaiian / Pacific Islander residents30.3 Median age for Other race residents16.7 Median age for Two or more races residents18.2 15.8 45.3 Median age for White alone residents45.9 41.8 29.3 Median age for Hispanic or Latino residents36.2 26.0
Owner/renter occupied households by race in Rainbow City
House owners and renters - White residents 2,341 68.6% Owner occupied1,074 31.4% Renter occupiedHouse owners and renters - Black or African American residents 65 15.0% Owner occupied368 85.0% Renter occupiedHouse owners and renters - Asian residents 47 66.6% Owner occupied24 33.4% Renter occupiedHouse owners and renters - Other race residents 19 100.0% Renter occupiedHouse owners and renters - Two or more races residents 40 100.0% Owner occupiedHouse owners and renters - White alone residents 2,351 69.3% Owner occupied1,043 30.7% Renter occupiedHouse owners and renters - Hispanic or Latino residents 73 100.0% Renter occupied
Language usage in Rainbow City
English speakers - Total 93.6% of residents of Rainbow City speak English at home.
3.1% of residents speak Spanish at home 133 45.9% Speak English very well157 54.1% Speak English less than very well3.2% of residents speak other language at home 198 65.6% Speak English very well104 34.4% Speak English less than very well
English speakers - Born in the United States 98.1% of residents of Rainbow City speak English at home.
1.1% of residents speak Spanish at home 26 100.0% Speak English very well0.9% of residents speak other language at home 21 100.0% Speak English very well
All residents speak only English at home
English speakers - Foreign-born 21.9% of residents of Rainbow City speak English at home.
37.4% of residents speak Spanish at home 43 21.9% Speak English very well153 78.1% Speak English less than very well39.9% of residents speak other language at home 104 49.8% Speak English very well105 50.2% Speak English less than very well
White (Caucasian) - Speak only English Native:
99.5% (7,566)Foreign-born:
28.5% (50)
White (Caucasian) - Speak another language Native:
0.7% (55)Foreign-born:
71.0% (125)
Asian - Speak only English Native:
81.4% (56)Foreign-born:
25.4% (52)
Asian - Speak another language Native:
25.3% (17)Foreign-born:
74.5% (151)
Other race - Speak only English Native:
25.1% (28)Foreign-born:
18.9% (11)
Other race - Speak another language Native:
68.3% (75)Foreign-born:
82.7% (48)
White alone - Speak only English Native:
99.3% (7,421)Foreign-born:
52.4% (29)
White alone - Speak another language Native:
0.7% (55)Foreign-born:
46.9% (26)
Hispanic or Latino - Speak only English Native:
68.5% (225)Foreign-born:
9.9% (24)
Hispanic or Latino - Speak another language Native:
35.6% (117)Foreign-born:
86.1% (206)
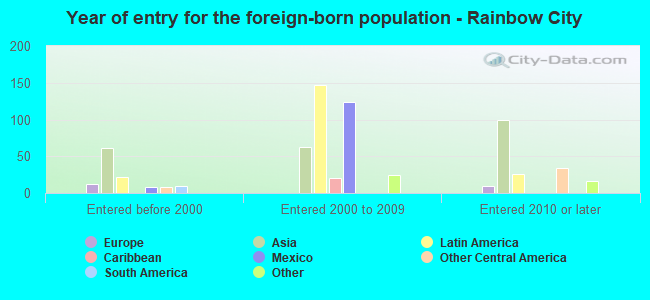
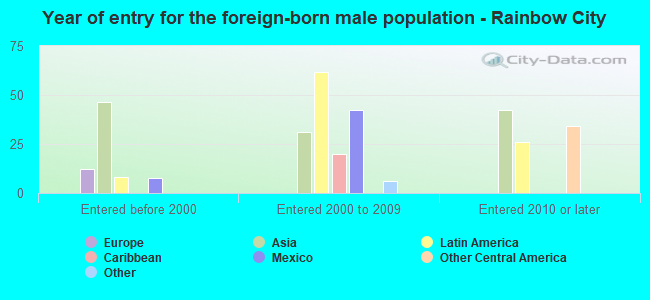
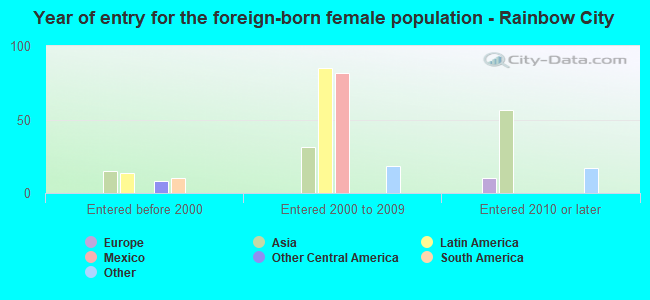
Foreign-born residents in Rainbow City 506 residents are foreign born (2.4% Latin America , 2.2% Asia ).
This city:
5.1%Alabama:
100.0%
Marital status for residents in Rainbow City Marital status - White (Caucasian) population 15 years and over
Males 22.3% Never married52.5% Now married0.6% Separated3.7% Widowed21.0% DivorcedFemales 20.2% Never married48.8% Now married4.2% Separated11.7% Widowed15.1% DivorcedWomen who gave birth in the past 12 months Now married:
65.9% (26)Unmarried:
34.1% (13)
Women who did not give birth in the past 12 months Now married:
47.8% (777)Unmarried:
52.2% (849)
Marital status - Black or African American population 15 years and over
Males 7.9% Never married47.5% Now married0.0% Separated23.0% Widowed21.6% DivorcedFemales 46.7% Never married29.0% Now married0.0% Separated0.0% Widowed24.3% DivorcedWomen who gave birth in the past 12 months Now married:
100.0% (21)Unmarried:
0.0% (0)
Women who did not give birth in the past 12 months Now married:
31.0% (71)Unmarried:
69.0% (159)
Marital status - Asian population 15 years and over
Males 38.8% Never married61.2% Now married0.0% Separated0.0% Widowed0.0% DivorcedFemales 27.3% Never married72.7% Now married0.0% Separated0.0% Widowed0.0% DivorcedWomen who did not give birth in the past 12 months Now married:
72.7% (76)Unmarried:
27.3% (28)
Marital status - Other race population 15 years and over
Males 100.0% Never married0.0% Now married0.0% Separated0.0% Widowed0.0% DivorcedFemales 43.2% Never married56.8% Now married0.0% Separated0.0% Widowed0.0% DivorcedWomen who did not give birth in the past 12 months Now married:
44.8% (17)Unmarried:
55.2% (21)
Marital status - Two or more races population 15 years and over
Males 100.0% Never married0.0% Now married0.0% Separated0.0% Widowed0.0% DivorcedFemales 0.0% Never married100.0% Now married0.0% Separated0.0% Widowed0.0% DivorcedWomen who did not give birth in the past 12 months Now married:
100.0% (69)Unmarried:
0.0% (0)
Marital status - White alone, not Hispanic / Latino population 15 years and over
Males 22.0% Never married54.2% Now married0.6% Separated3.8% Widowed19.4% DivorcedFemales 18.2% Never married49.5% Now married4.4% Separated12.1% Widowed15.7% DivorcedWomen who gave birth in the past 12 months Now married:
65.9% (26)Unmarried:
34.1% (14)
Women who did not give birth in the past 12 months Now married:
49.5% (772)Unmarried:
50.5% (786)
Marital status - Hispanic or Latino population 15 years and over
Males 43.4% Never married0.0% Now married0.0% Separated0.0% Widowed56.6% DivorcedFemales 63.7% Never married36.3% Now married0.0% Separated0.0% Widowed0.0% DivorcedWomen who did not give birth in the past 12 months Now married:
29.2% (55)Unmarried:
70.8% (134)
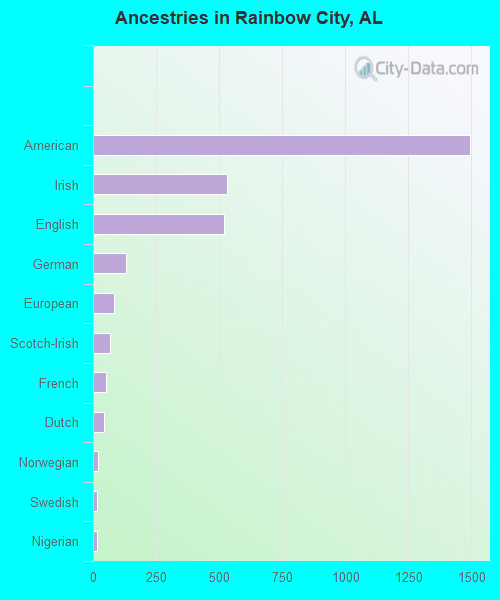
Ancestries in Rainbow City
1,262 24.4% American742 14.3% Irish402 7.8% English269 5.2% European231 4.5% Scottish131 2.5% German65 1.3% Scotch-Irish42 0.8% British30 0.6% Palestinian26 0.5% Northern European25 0.5% Dutch19 0.4% Eastern European17 0.3% Italian13 0.3% French10 0.2% Greek8 0.2% French Canadian7 0.1% Polish6 0.1% Swedish6 0.1% Welsh
Children Nativity (place of birth) in Rainbow City
Children under 6 years - Living with two parents Both parents native 359 100.0% NativeBoth parents foreign-born 23 100.0% NativeOne native, one foreign-born parent 16 100.0% NativeChildren under 6 years - Living with one parent Native parent 195 100.0% NativeChildren 6 to 17 years - Living with two parents Both parents native 882 97.8% Native20 2.2% Foreign-bornBoth parents foreign-born 26 57.6% Native19 42.4% Foreign-bornOne native, one foreign-born parent 60 100.0% NativeChildren 6 to 17 years - Living with one parent Native parent 435 100.0% NativeForeign-born parent 60 50.8% Native58 49.2% Foreign-born
Grandparents responsible for own grandchildren in Rainbow City
Grandparents (30 to 59 years) White / Caucasian 13 43.6% Responsible for grandchildren16 56.4% Not responsible for grandchildrenBlack or African American 45 100.0% Responsible for grandchildrenWhite alone, not Hispanic / Latino 12 41.3% Responsible for grandchildren17 58.7% Not responsible for grandchildrenGrandparents (60 years and over) White / Caucasian 62 57.6% Responsible for grandchildren46 42.4% Not responsible for grandchildrenWhite alone, not Hispanic / Latino 63 56.8% Responsible for grandchildren48 43.2% Not responsible for grandchildren