Races in Rancho Santa Margarita, California (CA) Detailed Stats
Data:
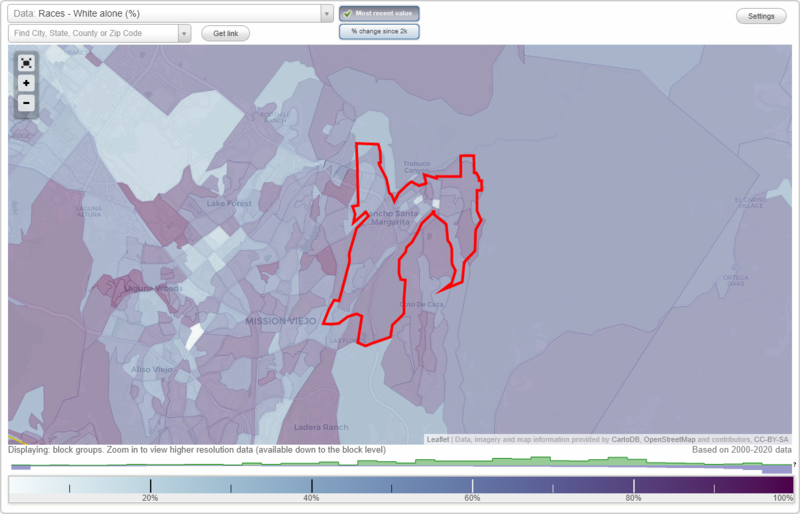
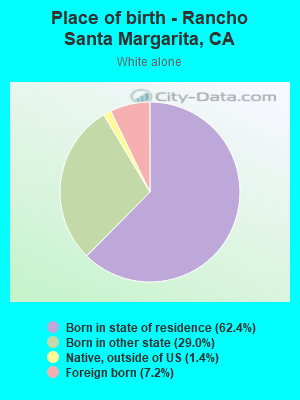
Races - White alone (%)
Races - White alone (% change since 2000)
Races - Black alone (%)
Races - Black alone (% change since 2000)
Races - American Indian alone (%)
Races - American Indian alone (% change since 2000)
Races - Asian alone (%)
Races - Asian alone (% change since 2000)
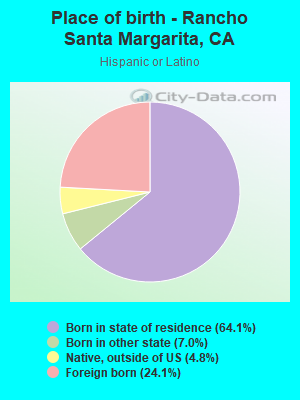
Races - Hispanic (%)
Races - Hispanic (% change since 2000)
Races - Native Hawaiian and Other Pacific Islander alone (%)
Races - Native Hawaiian and Other Pacific Islander alone (% change since 2000)
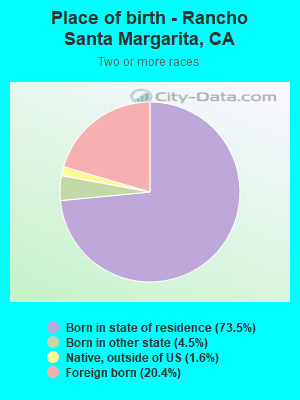
Races - Two or more races(%)
Races - Two or more races(% change since 2000)
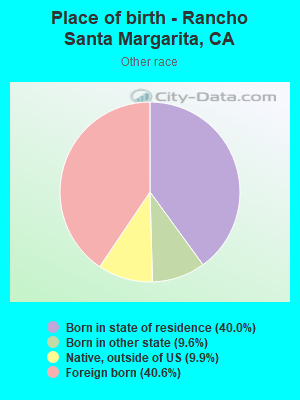
Races - Other race alone (%)
Races - Other race alone (% change since 2000)
Racial diversity
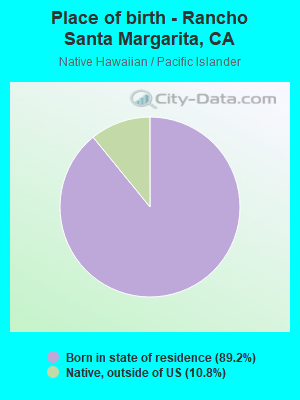
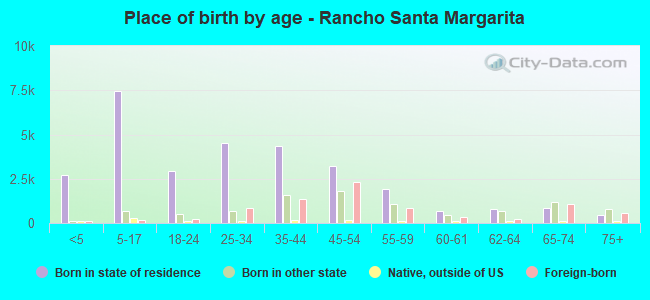
Place of birth - Born in state of residence (%)
Place of birth - Born in state of residence (%) - White
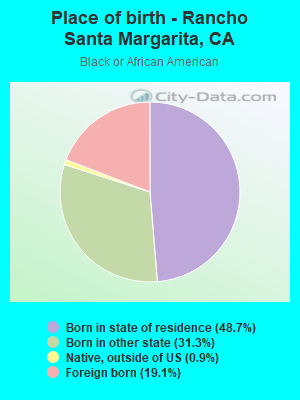
Place of birth - Born in state of residence (%) - Black or African American
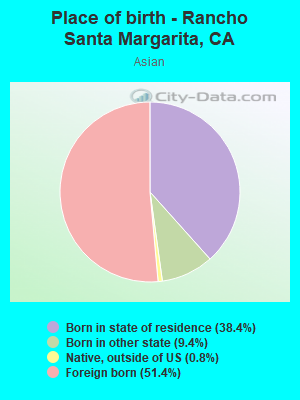
Place of birth - Born in state of residence (%) - Asian
Place of birth - Born in state of residence (%) - Hispanic or Latino
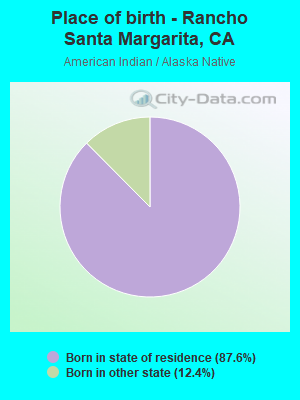
Place of birth - Born in state of residence (%) - American Indian and Alaska Native
Place of birth - Born in state of residence (%) - Multirace
Place of birth - Born in state of residence (%) - Other Race
Place of birth - Born in other state (%)
Place of birth - Born in other state (%) - White
Place of birth - Born in other state (%) - Black or African American
Place of birth - Born in other state (%) - Asian
Place of birth - Born in other state (%) - Hispanic or Latino
Place of birth - Born in other state (%) - American Indian and Alaska Native
Place of birth - Born in other state (%) - Multirace
Place of birth - Born in other state (%) - Other Race
Place of birth - Native, outside of US (%)
Place of birth - Native, outside of US (%) - White
Place of birth - Native, outside of US (%) - Black or African American
Place of birth - Native, outside of US (%) - Asian
Place of birth - Native, outside of US (%) - Hispanic or Latino
Place of birth - Native, outside of US (%) - American Indian and Alaska Native
Place of birth - Native, outside of US (%) - Multirace
Place of birth - Native, outside of US (%) - Other Race
Place of birth - Foreign born (%)
Place of birth - Foreign born (%) - White
Place of birth - Foreign born (%) - Black or African American
Place of birth - Foreign born (%) - Asian
Place of birth - Foreign born (%) - Hispanic or Latino
Place of birth - Foreign born (%) - American Indian and Alaska Native
Place of birth - Foreign born (%) - Multirace
Place of birth - Foreign born (%) - Other Race
Residents speaking English at home (%)
Residents speaking English at home - Born in the United States (%)
Residents speaking English at home - Native, born elsewhere (%)
Residents speaking English at home - Foreign born (%)
Residents speaking Spanish at home (%)
Residents speaking Spanish at home - Born in the United States (%)
Residents speaking Spanish at home - Native, born elsewhere (%)
Residents speaking Spanish at home - Foreign born (%)
Residents speaking other language at home (%)
Residents speaking other language at home - Born in the United States (%)
Residents speaking other language at home - Native, born elsewhere (%)
Residents speaking other language at home - Foreign born (%)
Marital status - Never married (%)
Marital status - Now married (%)
Marital status - Separated (%)
Marital status - Widowed (%)
Marital status - Divorced (%)
Ancestries Reported - Arab (%)
Ancestries Reported - Czech (%)
Ancestries Reported - Danish (%)
Ancestries Reported - Dutch (%)
Ancestries Reported - English (%)
Ancestries Reported - French (%)
Ancestries Reported - French Canadian (%)
Ancestries Reported - German (%)
Ancestries Reported - Greek (%)
Ancestries Reported - Hungarian (%)
Ancestries Reported - Irish (%)
Ancestries Reported - Italian (%)
Ancestries Reported - Lithuanian (%)
Ancestries Reported - Norwegian (%)
Ancestries Reported - Polish (%)
Ancestries Reported - Portuguese (%)
Ancestries Reported - Russian (%)
Ancestries Reported - Scotch-Irish (%)
Ancestries Reported - Scottish (%)
Ancestries Reported - Slovak (%)
Ancestries Reported - Subsaharan African (%)
Ancestries Reported - Swedish (%)
Ancestries Reported - Swiss (%)
Ancestries Reported - Ukrainian (%)
Ancestries Reported - United States (%)
Ancestries Reported - Welsh (%)
Ancestries Reported - West Indian (%)
Ancestries Reported - Other (%)
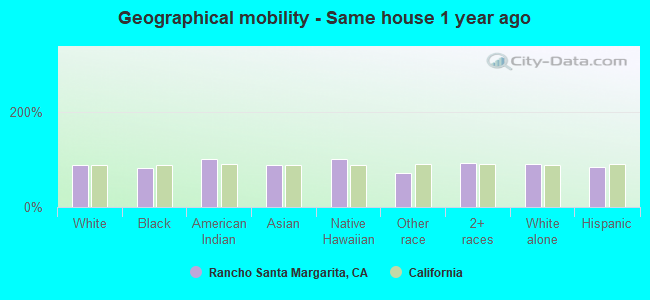
Geographical mobility - Same house 1 year ago (%)
Geographical mobility - Same house 1 year ago (%) - White
Geographical mobility - Same house 1 year ago (%) - Black or African American
Geographical mobility - Same house 1 year ago (%) - Asian
Geographical mobility - Same house 1 year ago (%) - Hispanic or Latino
Geographical mobility - Same house 1 year ago (%) - American Indian and Alaska Native
Geographical mobility - Same house 1 year ago (%) - Multirace
Geographical mobility - Same house 1 year ago (%) - Other Race
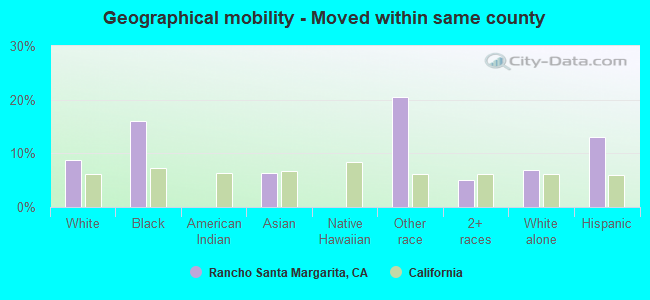
Geographical mobility - Moved within same county (%)
Geographical mobility - Moved within same county (%) - White
Geographical mobility - Moved within same county (%) - Black or African American
Geographical mobility - Moved within same county (%) - Asian
Geographical mobility - Moved within same county (%) - Hispanic or Latino
Geographical mobility - Moved within same county (%) - American Indian and Alaska Native
Geographical mobility - Moved within same county (%) - Multirace
Geographical mobility - Moved within same county (%) - Other Race
Geographical mobility - Moved from different county within same state (%)
Geographical mobility - Moved from different county within same state (%) - White
Geographical mobility - Moved from different county within same state (%) - Black or African American
Geographical mobility - Moved from different county within same state (%) - Asian
Geographical mobility - Moved from different county within same state (%) - Hispanic or Latino
Geographical mobility - Moved from different county within same state (%) - American Indian and Alaska Native
Geographical mobility - Moved from different county within same state (%) - Multirace
Geographical mobility - Moved from different county within same state (%) - Other Race
Geographical mobility - Moved from different state (%)
Geographical mobility - Moved from different state (%) - White
Geographical mobility - Moved from different state (%) - Black or African American
Geographical mobility - Moved from different state (%) - Asian
Geographical mobility - Moved from different state (%) - Hispanic or Latino
Geographical mobility - Moved from different state (%) - American Indian and Alaska Native
Geographical mobility - Moved from different state (%) - Multirace
Geographical mobility - Moved from different state (%) - Other Race
Geographical mobility - Moved from abroad (%)
Geographical mobility - Moved from abroad (%) - White
Geographical mobility - Moved from abroad (%) - Black or African American
Geographical mobility - Moved from abroad (%) - Asian
Geographical mobility - Moved from abroad (%) - Hispanic or Latino
Geographical mobility - Moved from abroad (%) - American Indian and Alaska Native
Geographical mobility - Moved from abroad (%) - Multirace
Geographical mobility - Moved from abroad (%) - Other Race
Place of birth for the foreign-born population - Ireland (%)
Place of birth for the foreign-born population - Denmark (%)
Place of birth for the foreign-born population - Norway (%)
Place of birth for the foreign-born population - Sweden (%)
Place of birth for the foreign-born population - United Kingdom (%)
Place of birth for the foreign-born population - England (%)
Place of birth for the foreign-born population - Scotland (%)
Place of birth for the foreign-born population - Other Northern Europe (%)
Place of birth for the foreign-born population - Austria (%)
Place of birth for the foreign-born population - Belgium (%)
Place of birth for the foreign-born population - France (%)
Place of birth for the foreign-born population - Germany (%)
Place of birth for the foreign-born population - Netherlands (%)
Place of birth for the foreign-born population - Switzerland (%)
Place of birth for the foreign-born population - Other Western Europe (%)
Place of birth for the foreign-born population - Greece (%)
Place of birth for the foreign-born population - Italy (%)
Place of birth for the foreign-born population - Portugal (%)
Place of birth for the foreign-born population - Spain (%)
Place of birth for the foreign-born population - Other Southern Europe (%)
Place of birth for the foreign-born population - Albania (%)
Place of birth for the foreign-born population - Belarus (%)
Place of birth for the foreign-born population - Bosnia and Herzegovina (%)
Place of birth for the foreign-born population - Bulgaria (%)
Place of birth for the foreign-born population - Croatia (%)
Place of birth for the foreign-born population - Czechoslovakia (%)
Place of birth for the foreign-born population - Hungary (%)
Place of birth for the foreign-born population - Latvia (%)
Place of birth for the foreign-born population - Lithuania (%)
Place of birth for the foreign-born population - North Macedonia (Macedonia) (%)
Place of birth for the foreign-born population - Moldova (%)
Place of birth for the foreign-born population - Poland (%)
Place of birth for the foreign-born population - Romania (%)
Place of birth for the foreign-born population - Russia (%)
Place of birth for the foreign-born population - Serbia (%)
Place of birth for the foreign-born population - Ukraine (%)
Place of birth for the foreign-born population - Other Eastern Europe (%)
Place of birth for the foreign-born population - China (%)
Place of birth for the foreign-born population - Hong Kong (%)
Place of birth for the foreign-born population - Taiwan (%)
Place of birth for the foreign-born population - Japan (%)
Place of birth for the foreign-born population - Korea (%)
Place of birth for the foreign-born population - Other Eastern Asia (%)
Place of birth for the foreign-born population - Afghanistan (%)
Place of birth for the foreign-born population - Bangladesh (%)
Place of birth for the foreign-born population - India (%)
Place of birth for the foreign-born population - Iran (%)
Place of birth for the foreign-born population - Kazakhstan (%)
Place of birth for the foreign-born population - Nepal (%)
Place of birth for the foreign-born population - Pakistan (%)
Place of birth for the foreign-born population - Sri Lanka (%)
Place of birth for the foreign-born population - Uzbekistan (%)
Place of birth for the foreign-born population - Other South Central Asia (%)
Place of birth for the foreign-born population - Burma (%)
Place of birth for the foreign-born population - Cambodia (%)
Place of birth for the foreign-born population - Indonesia (%)
Place of birth for the foreign-born population - Laos (%)
Place of birth for the foreign-born population - Malaysia (%)
Place of birth for the foreign-born population - Philippines (%)
Place of birth for the foreign-born population - Singapore (%)
Place of birth for the foreign-born population - Thailand (%)
Place of birth for the foreign-born population - Vietnam (%)
Place of birth for the foreign-born population - Other South Eastern Asia (%)
Place of birth for the foreign-born population - Armenia (%)
Place of birth for the foreign-born population - Iraq (%)
Place of birth for the foreign-born population - Israel (%)
Place of birth for the foreign-born population - Jordan (%)
Place of birth for the foreign-born population - Kuwait (%)
Place of birth for the foreign-born population - Lebanon (%)
Place of birth for the foreign-born population - Saudi Arabia (%)
Place of birth for the foreign-born population - Syria (%)
Place of birth for the foreign-born population - Turkey (%)
Place of birth for the foreign-born population - Yemen (%)
Place of birth for the foreign-born population - Other Western Asia (%)
Place of birth for the foreign-born population - Eritrea (%)
Place of birth for the foreign-born population - Ethiopia (%)
Place of birth for the foreign-born population - Kenya (%)
Place of birth for the foreign-born population - Somalia (%)
Place of birth for the foreign-born population - Uganda (%)
Place of birth for the foreign-born population - Zimbabwe (%)
Place of birth for the foreign-born population - Other Eastern Africa (%)
Place of birth for the foreign-born population - Cameroon (%)
Place of birth for the foreign-born population - Congo (%)
Place of birth for the foreign-born population - Democratic Republic of Congo (Zaire) (%)
Place of birth for the foreign-born population - Other Middle Africa (%)
Place of birth for the foreign-born population - Egypt (%)
Place of birth for the foreign-born population - Morocco (%)
Place of birth for the foreign-born population - Sudan (%)
Place of birth for the foreign-born population - Other Northern Africa (%)
Place of birth for the foreign-born population - South Africa (%)
Place of birth for the foreign-born population - Other Southern Africa (%)
Place of birth for the foreign-born population - Cabo Verde (%)
Place of birth for the foreign-born population - Ghana (%)
Place of birth for the foreign-born population - Liberia (%)
Place of birth for the foreign-born population - Nigeria (%)
Place of birth for the foreign-born population - Senegal (%)
Place of birth for the foreign-born population - Sierra Leone (%)
Place of birth for the foreign-born population - Other Western Africa (%)
Place of birth for the foreign-born population - Australia (%)
Place of birth for the foreign-born population - New Zealand (%)
Place of birth for the foreign-born population - Fiji (%)
Place of birth for the foreign-born population - Micronesia (%)
Place of birth for the foreign-born population - Bahamas (%)
Place of birth for the foreign-born population - Barbados (%)
Place of birth for the foreign-born population - Cuba (%)
Place of birth for the foreign-born population - Dominica (%)
Place of birth for the foreign-born population - Dominican Republic (%)
Place of birth for the foreign-born population - Grenada (%)
Place of birth for the foreign-born population - Haiti (%)
Place of birth for the foreign-born population - Jamaica (%)
Place of birth for the foreign-born population - St. Vincent and the Grenadines (%)
Place of birth for the foreign-born population - Trinidad and Tobago (%)
Place of birth for the foreign-born population - West Indies (%)
Place of birth for the foreign-born population - Other Caribbean (%)
Place of birth for the foreign-born population - Belize (%)
Place of birth for the foreign-born population - Costa Rica (%)
Place of birth for the foreign-born population - El Salvador (%)
Place of birth for the foreign-born population - Guatemala (%)
Place of birth for the foreign-born population - Honduras (%)
Place of birth for the foreign-born population - Mexico (%)
Place of birth for the foreign-born population - Nicaragua (%)
Place of birth for the foreign-born population - Panama (%)
Place of birth for the foreign-born population - Other Central America (%)
Place of birth for the foreign-born population - Argentina (%)
Place of birth for the foreign-born population - Bolivia (%)
Place of birth for the foreign-born population - Brazil (%)
Place of birth for the foreign-born population - Chile (%)
Place of birth for the foreign-born population - Colombia (%)
Place of birth for the foreign-born population - Ecuador (%)
Place of birth for the foreign-born population - Guyana (%)
Place of birth for the foreign-born population - Peru (%)
Place of birth for the foreign-born population - Uruguay (%)
Place of birth for the foreign-born population - Venezuela (%)
Place of birth for the foreign-born population - Other South America (%)
Place of birth for the foreign-born population - Canada (%)
Place of birth for the foreign-born population - Other Northern America (%)
Place of birth for the foreign-born population - Other (%)
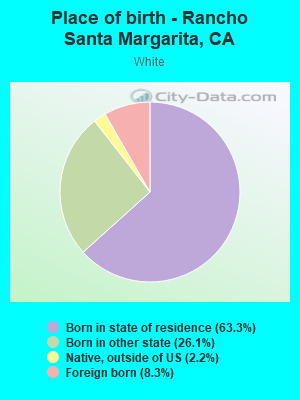
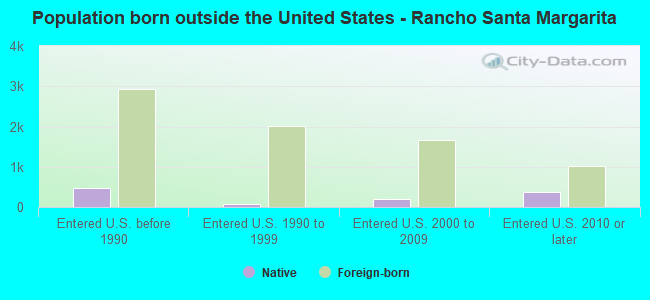
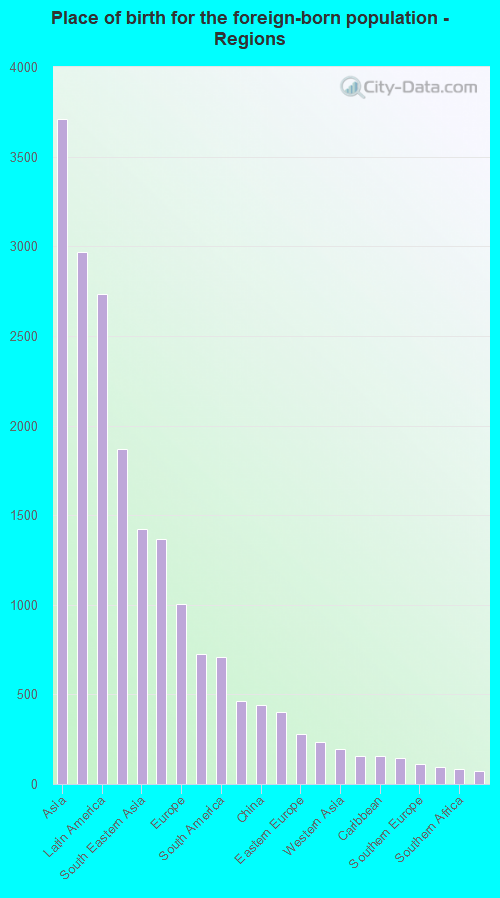
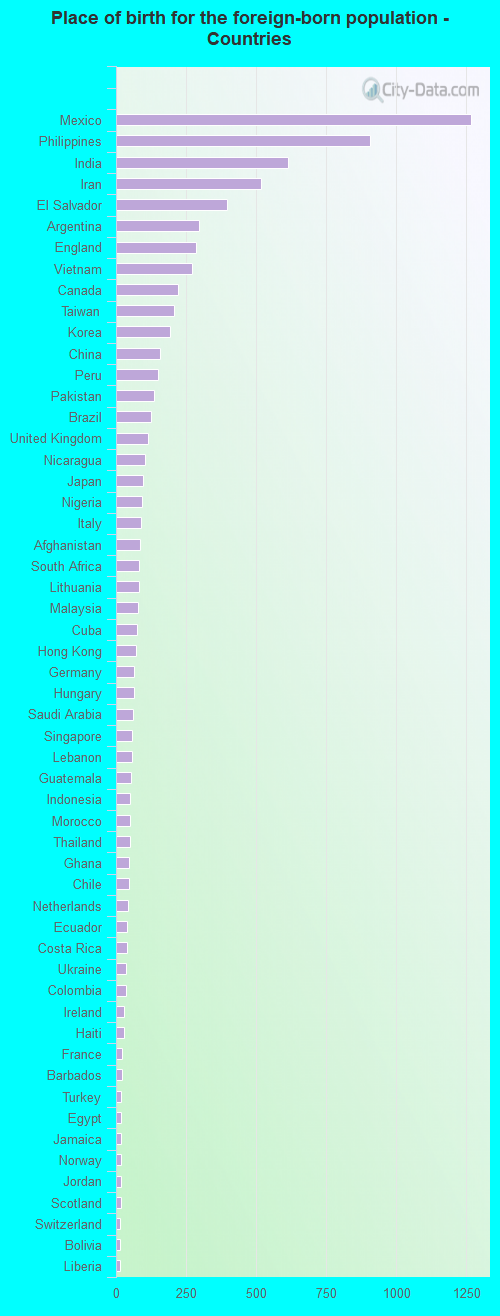
According to 2022 data, the most numerous races in Rancho Santa Margarita, CA are Hispanic (10,205 residents), White alone (27,439 residents), and Asian alone (5,539 residents). 80.1% of Rancho Santa Margarita residents speak English at home. 16.6% of Rancho Santa Margarita, CA residents are foreign-born (7.5% born in Asia, 5.6% born in Latin America, 2.0% born in Europe), which is 56.7% less than the foreign-born rate of 26.0% across the entire state of California.
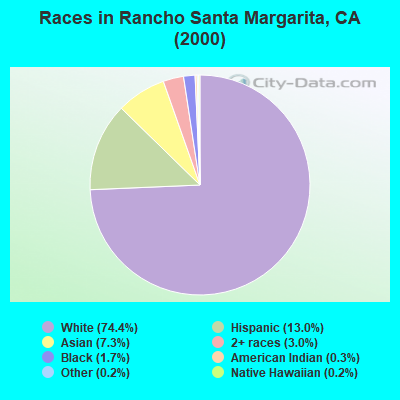
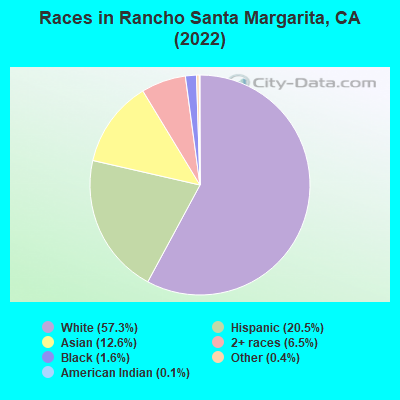
Race distribution in Rancho Santa Margarita
2000 2022
15,816,790 46.7% White alone 10,966,556 32.4% Hispanic 3,648,860 10.8% Asian alone 2,181,926 6.4% Black alone 903,115 2.7% Two or more races 178,984 0.5% American Indian alone 103,736 0.3% Native Hawaiian and Other 71,681 0.2% Other race alone
15,732,184 40.3% Hispanic 13,160,426 33.7% White alone 5,957,867 15.3% Asian alone 2,025,218 5.2% Black alone 1,663,222 4.3% Two or more races 251,618 0.6% Other race alone 135,777 0.3% Native Hawaiian and Other 103,030 0.3% American Indian alone
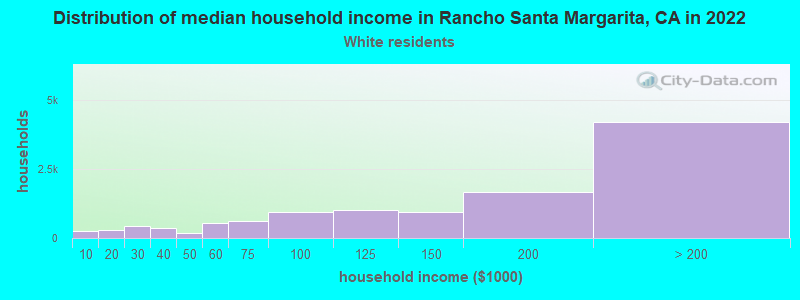
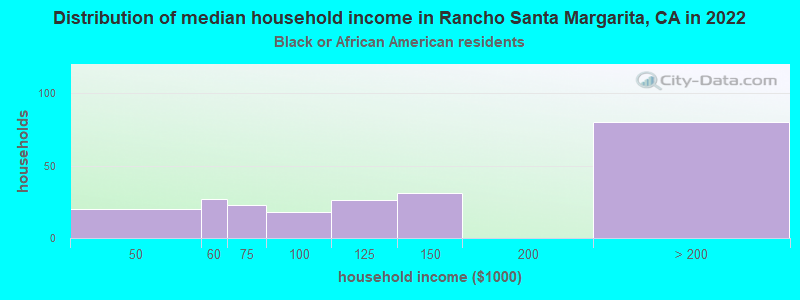
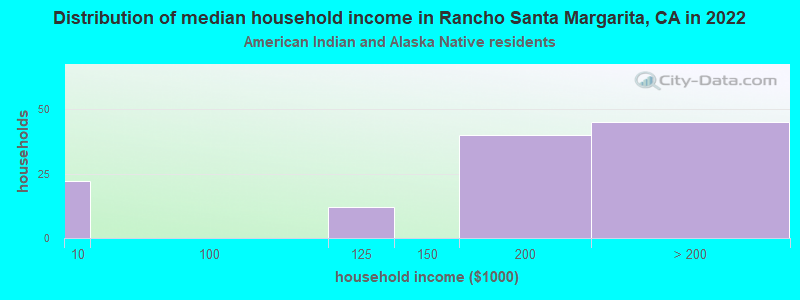
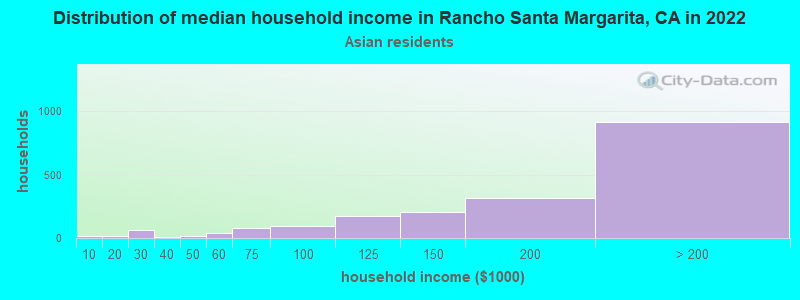
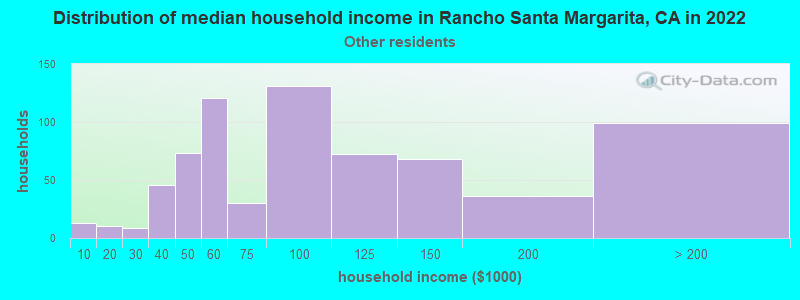
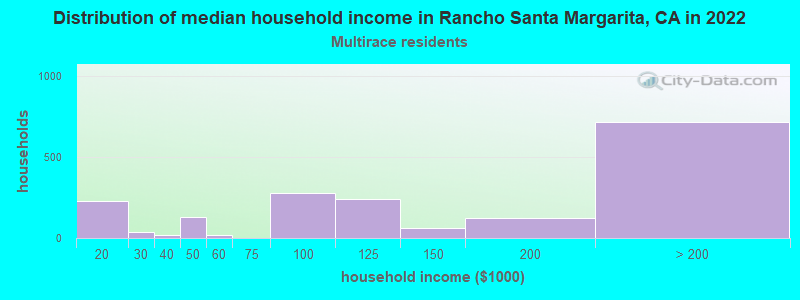
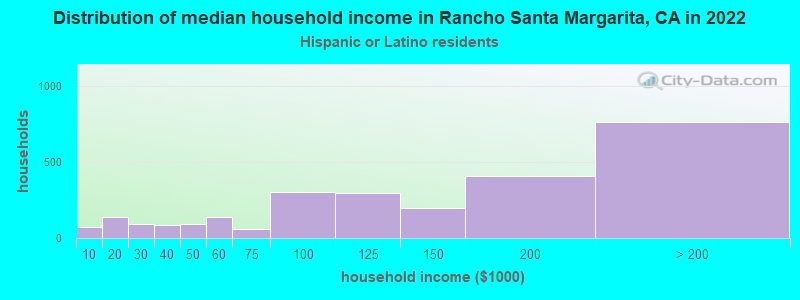
Income and house value in Rancho Santa Margarita Median household income in 2022 $157,444 White non-Hispanic householders$158,654 Black householders$190,806 American Indian and Alaska Native householders$186,803 Asian householders$63,403 Native Hawaiian and other Pacific Islander householders$142,831 Some other race householders$118,113 Two or more races householders$142,508 Hispanic or Latino race householdersMedian 2022 house value over $1,000,000 White Non-Hispanic householders$983,327 Black or African American householdersover $1,000,000 American Indian or Alaska Native householders $999,524 Asian householders$404,920 Native Hawaiian and other Pacific Islander householders$873,909 Some other race householders$955,973 Two or more races householders$904,863 Hispanic or Latino householders
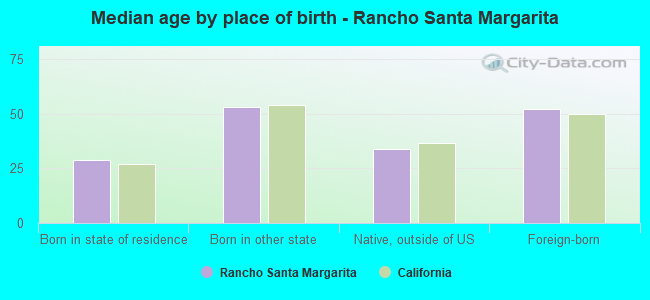
Median age by race in Rancho Santa Margarita
42.5 Median age for White residents41.7 42.9 40.2 Median age for Black or African American residents43.3 16.9 31.4 Median age for American Indian / Alaska Native residents36.0 33.4 41.2 Median age for Asian residents40.5 42.0 58.2 Median age for Native Hawaiian / Pacific Islander residents41.3 Median age for Other race residents37.2 43.6 23.4 Median age for Two or more races residents25.3 21.0 42.7 Median age for White alone residents41.7 43.3 34.0 Median age for Hispanic or Latino residents33.5 34.4
Owner/renter occupied households by race in Rancho Santa Margarita
House owners and renters - White residents 8,555 71.4% Owner occupied3,422 28.6% Renter occupiedHouse owners and renters - Black or African American residents 315 78.5% Owner occupied87 21.5% Renter occupiedHouse owners and renters - American Indian / Alaska Native residents 80 85.0% Owner occupied14 15.0% Renter occupiedHouse owners and renters - Asian residents 1,632 80.5% Owner occupied395 19.5% Renter occupiedHouse owners and renters - Native Hawaiian / Pacific Islander residents 12 100.0% Owner occupiedHouse owners and renters - Other race residents 362 69.8% Owner occupied156 30.2% Renter occupiedHouse owners and renters - Two or more races residents 1,146 56.4% Owner occupied887 43.6% Renter occupiedHouse owners and renters - White alone residents 7,972 72.2% Owner occupied3,067 27.8% Renter occupiedHouse owners and renters - Hispanic or Latino residents 1,899 61.2% Owner occupied1,203 38.8% Renter occupied
Language usage in Rancho Santa Margarita
English speakers - Total 80.1% of residents of Rancho Santa Margarita speak English at home.
9.8% of residents speak Spanish at home 3,451 77.1% Speak English very well1,023 22.9% Speak English less than very well10.7% of residents speak other language at home 3,740 76.8% Speak English very well1,131 23.2% Speak English less than very well
English speakers - Born in the United States 94.1% of residents of Rancho Santa Margarita speak English at home.
3.0% of residents speak Spanish at home 281 91.2% Speak English very well27 8.8% Speak English less than very well2.7% of residents speak other language at home 225 82.1% Speak English very well49 17.9% Speak English less than very well
English speakers - Native, born elsewhere 67.7% of residents of Rancho Santa Margarita speak English at home.
25.6% of residents speak Spanish at home 172 70.2% Speak English very well73 29.8% Speak English less than very well7.2% of residents speak other language at home 59 85.5% Speak English very well10 14.5% Speak English less than very well
English speakers - Foreign-born 30.1% of residents of Rancho Santa Margarita speak English at home.
26.7% of residents speak Spanish at home 1,370 65.1% Speak English very well735 34.9% Speak English less than very well46.7% of residents speak other language at home 2,731 74.2% Speak English very well952 25.8% Speak English less than very well
White (Caucasian) - Speak only English Native:
97.6% (25,409)Foreign-born:
42.3% (1,054)
White (Caucasian) - Speak another language Native:
5.8% (1,502)Foreign-born:
65.2% (1,625)
Black or African American - Speak only English Native:
98.0% (1,141)Foreign-born:
61.2% (175)
Black or African American - Speak another language Native:
1.9% (22)Foreign-born:
31.2% (90)
Asian - Speak only English Native:
76.9% (2,099)Foreign-born:
22.3% (659)
Asian - Speak another language Native:
23.8% (650)Foreign-born:
77.9% (2,301)
Other race - Speak only English Native:
44.9% (383)Foreign-born:
19.9% (113)
Other race - Speak another language Native:
55.7% (474)Foreign-born:
85.6% (484)
Two or more races - Speak only English Native:
67.9% (3,249)Foreign-born:
5.0% (85)
Two or more races - Speak another language Native:
21.9% (1,047)Foreign-born:
93.7% (1,602)
White alone - Speak only English Native:
96.6% (23,081)Foreign-born:
41.3% (821)
White alone - Speak another language Native:
3.2% (755)Foreign-born:
57.8% (1,150)
Hispanic or Latino - Speak only English Native:
69.2% (5,154)Foreign-born:
24.5% (581)
Hispanic or Latino - Speak another language Native:
30.5% (2,268)Foreign-born:
82.1% (1,947)
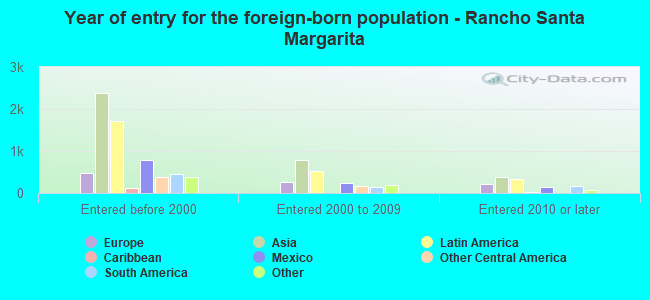
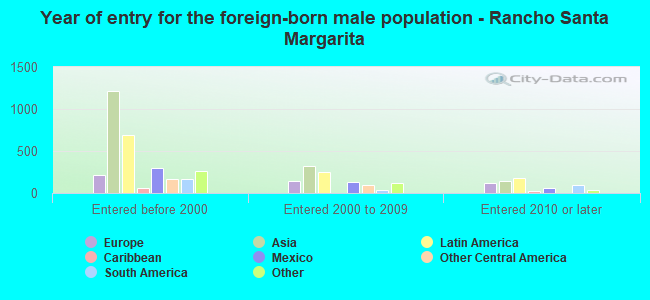
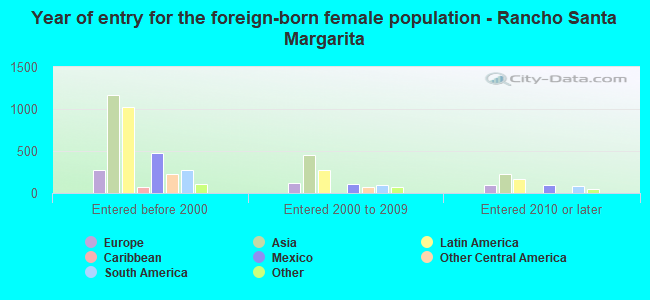
Foreign-born residents in Rancho Santa Margarita 8,084 residents are foreign born (7.5% Asia , 5.6% Latin America , 2.0% Europe ).
This city:
16.6%California:
100.0%
Marital status for residents in Rancho Santa Margarita Marital status - White (Caucasian) population 15 years and over
Males 27.6% Never married62.3% Now married0.9% Separated1.2% Widowed8.0% DivorcedFemales 23.9% Never married55.6% Now married1.4% Separated4.7% Widowed14.4% DivorcedWomen who gave birth in the past 12 months Now married:
91.0% (273)Unmarried:
9.0% (27)
Women who did not give birth in the past 12 months Now married:
53.4% (3,506)Unmarried:
46.6% (3,055)
Marital status - Black or African American population 15 years and over
Males 23.9% Never married70.2% Now married0.0% Separated0.0% Widowed5.8% DivorcedFemales 27.3% Never married64.3% Now married0.0% Separated4.3% Widowed4.1% DivorcedWomen who did not give birth in the past 12 months Now married:
70.3% (172)Unmarried:
29.7% (73)
Marital status - American Indian / Alaska Native population 15 years and over
Males 26.7% Never married60.0% Now married0.0% Separated0.0% Widowed13.3% DivorcedFemales 52.7% Never married32.7% Now married0.0% Separated0.0% Widowed14.5% DivorcedWomen who gave birth in the past 12 months Now married:
100.0% (33)Unmarried:
0.0% (0)
Women who did not give birth in the past 12 months Now married:
0.0% (0)Unmarried:
100.0% (77)
Marital status - Asian population 15 years and over
Males 31.6% Never married61.3% Now married2.2% Separated1.8% Widowed3.1% DivorcedFemales 22.2% Never married64.2% Now married0.5% Separated1.5% Widowed11.6% DivorcedWomen who gave birth in the past 12 months Now married:
100.0% (75)Unmarried:
0.0% (0)
Women who did not give birth in the past 12 months Now married:
62.9% (1,020)Unmarried:
37.1% (601)
Marital status - Native Hawaiian / Pacific Islander population 15 years and over
Males 0.0% Never married100.0% Now married0.0% Separated0.0% Widowed0.0% DivorcedFemales 100.0% Never married0.0% Now married0.0% Separated0.0% Widowed0.0% DivorcedWomen who did not give birth in the past 12 months Now married:
0.0% (0)Unmarried:
100.0% (8)
Marital status - Other race population 15 years and over
Males 44.8% Never married37.6% Now married0.0% Separated6.3% Widowed11.3% DivorcedFemales 24.6% Never married39.4% Now married5.1% Separated11.0% Widowed19.9% DivorcedWomen who gave birth in the past 12 months Now married:
100.0% (53)Unmarried:
0.0% (0)
Women who did not give birth in the past 12 months Now married:
38.5% (153)Unmarried:
61.5% (244)
Marital status - Two or more races population 15 years and over
Males 52.5% Never married43.5% Now married1.0% Separated0.0% Widowed3.0% DivorcedFemales 44.0% Never married43.6% Now married0.0% Separated5.1% Widowed7.3% DivorcedWomen who gave birth in the past 12 months Now married:
86.4% (111)Unmarried:
13.6% (18)
Women who did not give birth in the past 12 months Now married:
33.6% (499)Unmarried:
66.4% (986)
Marital status - White alone, not Hispanic / Latino population 15 years and over
Males 26.2% Never married62.9% Now married0.9% Separated1.5% Widowed8.5% DivorcedFemales 21.1% Never married57.5% Now married1.5% Separated5.3% Widowed14.5% DivorcedWomen who gave birth in the past 12 months Now married:
89.6% (276)Unmarried:
10.4% (32)
Women who did not give birth in the past 12 months Now married:
56.6% (3,336)Unmarried:
43.4% (2,560)
Marital status - Hispanic or Latino population 15 years and over
Males 35.8% Never married56.5% Now married0.6% Separated0.7% Widowed6.4% DivorcedFemales 35.2% Never married46.5% Now married1.2% Separated2.9% Widowed14.2% DivorcedWomen who gave birth in the past 12 months Now married:
100.0% (115)Unmarried:
0.0% (0)
Women who did not give birth in the past 12 months Now married:
41.6% (1,135)Unmarried:
58.4% (1,593)
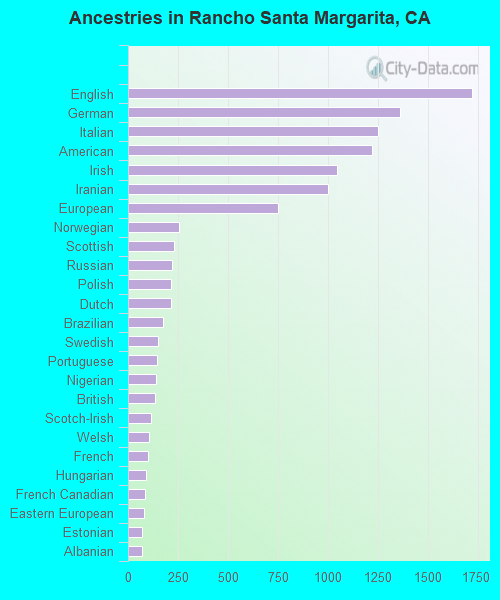
Ancestries in Rancho Santa Margarita
1,775 8.0% English1,338 6.0% European1,222 5.5% German1,071 4.8% American848 3.8% Italian839 3.8% Irish496 2.2% Iranian476 2.1% British252 1.1% South African234 1.0% Swedish203 0.9% Norwegian201 0.9% Scottish172 0.8% Nigerian156 0.7% Afghan154 0.7% Dutch151 0.7% Polish126 0.6% French Canadian113 0.5% Eastern European105 0.5% Arab104 0.5% French95 0.4% Scandinavian94 0.4% Hungarian83 0.4% Portuguese82 0.4% Brazilian55 0.2% Trinidadian and Tobagonian54 0.2% Moroccan53 0.2% Scotch-Irish53 0.2% Welsh49 0.2% Czech47 0.2% Northern European44 0.2% African41 0.2% Russian40 0.2% Swiss38 0.2% Lebanese35 0.2% Greek32 0.1% Maltese30 0.1% Ukrainian29 0.1% Haitian28 0.1% Danish28 0.1% Austrian25 0.1% Estonian24 0.1% Czechoslovakian21 0.09% Slovak21 0.09% Turkish21 0.09% Jamaican20 0.09% Canadian20 0.09% Icelander19 0.09% Romanian15 0.07% Slavic15 0.07% Armenian14 0.06% Australian14 0.06% Lithuanian8 0.04% Finnish8 0.04% Croatian7 0.03% Yugoslavian6 0.03% Israeli
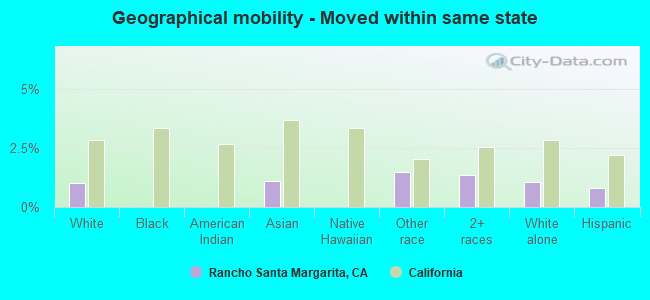
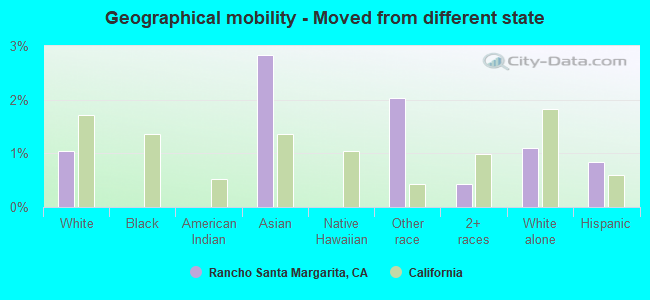
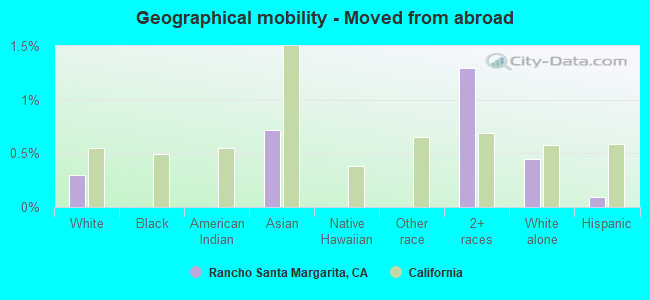
Geographical mobility in Rancho Santa Margarita Same house 1 year ago 25,864 88.7% White (Caucasian)1,228 81.5% Black or African American325 100.0% American Indian / Alaska Native5,134 89.3% Asian55 100.0% Native Hawaiian / Pacific Islander933 71.1% Other race7,095 93.4% Two or more races25,115 90.6% White alone, not Hispanic / Latino8,427 83.8% Hispanic or LatinoMoved within same county 2,558 8.8% White / Caucasian242 16.1% Black or African American363 6.3% Asian270 20.6% Other race381 5.0% Two or more races1,934 7.0% White alone, not Hispanic / Latino1,319 13.1% Hispanic or LatinoMoved within same state 294 1.0% White / Caucasian63 1.1% Asian20 1.5% Other race101 1.3% Two or more races291 1.0% White alone, not Hispanic / Latino81 0.8% Hispanic or LatinoMoved from different state 302 1.0% White / Caucasian163 2.8% Asian27 2.0% Other race33 0.4% Two or more races304 1.1% White alone, not Hispanic / Latino84 0.8% Hispanic or LatinoMoved from abroad 88 0.3% White41 0.7% Asian98 1.3% Two or more races123 0.4% White alone, not Hispanic / Latino10 0.1% Hispanic or Latino
Children Nativity (place of birth) in Rancho Santa Margarita
Children under 6 years - Living with two parents Both parents native 2,305 100.0% NativeBoth parents foreign-born 314 93.8% Native21 6.2% Foreign-bornOne native, one foreign-born parent 444 100.0% NativeChildren under 6 years - Living with one parent Native parent 251 100.0% NativeForeign-born parent 37 100.0% NativeChildren 6 to 17 years - Living with two parents Both parents native 4,115 100.0% Native1 0.0% Foreign-bornBoth parents foreign-born 1,004 85.1% Native176 14.9% Foreign-bornOne native, one foreign-born parent 1,153 100.0% NativeChildren 6 to 17 years - Living with one parent Native parent 1,241 100.0% NativeForeign-born parent 314 50.8% Native304 49.2% Foreign-born
Grandparents responsible for own grandchildren in Rancho Santa Margarita
Grandparents (30 to 59 years) White / Caucasian 16 34.4% Responsible for grandchildren30 65.6% Not responsible for grandchildrenAsian 7 100.0% Not responsible for grandchildrenTwo or more races 21 100.0% Responsible for grandchildrenWhite alone, not Hispanic / Latino 16 43.3% Responsible for grandchildren21 56.7% Not responsible for grandchildrenHispanic or Latino 18 100.0% Not responsible for grandchildrenGrandparents (60 years and over) White / Caucasian 119 39.1% Responsible for grandchildren186 60.9% Not responsible for grandchildrenAsian 10 8.5% Responsible for grandchildren106 91.5% Not responsible for grandchildrenTwo or more races 143 100.0% Not responsible for grandchildrenWhite alone, not Hispanic / Latino 147 39.9% Responsible for grandchildren221 60.1% Not responsible for grandchildrenHispanic or Latino 55 100.0% Not responsible for grandchildren