Races in Redstone Arsenal, Alabama (AL) Detailed Stats
Data:
Races - White alone (%)
Races - White alone (% change since 2000)
Races - Black alone (%)
Races - Black alone (% change since 2000)
Races - American Indian alone (%)
Races - American Indian alone (% change since 2000)
Races - Asian alone (%)
Races - Asian alone (% change since 2000)
Races - Hispanic (%)
Races - Hispanic (% change since 2000)
Races - Native Hawaiian and Other Pacific Islander alone (%)
Races - Native Hawaiian and Other Pacific Islander alone (% change since 2000)
Races - Two or more races(%)
Races - Two or more races(% change since 2000)
Races - Other race alone (%)
Races - Other race alone (% change since 2000)
Racial diversity
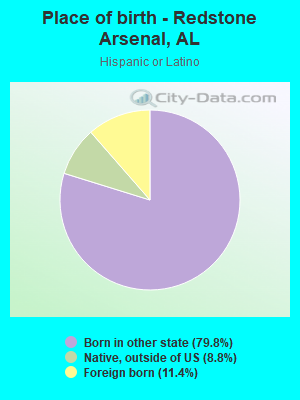
Place of birth - Born in state of residence (%)
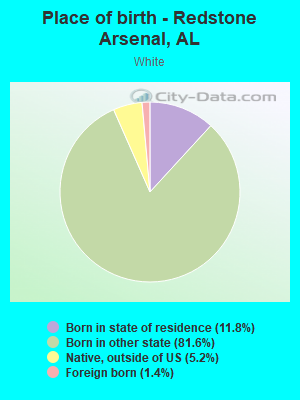
Place of birth - Born in state of residence (%) - White
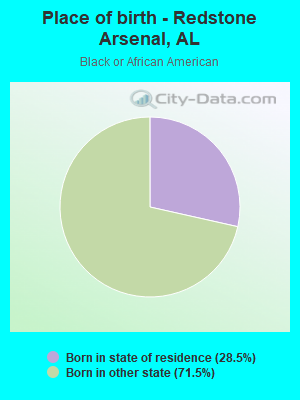
Place of birth - Born in state of residence (%) - Black or African American
Place of birth - Born in state of residence (%) - Asian
Place of birth - Born in state of residence (%) - Hispanic or Latino
Place of birth - Born in state of residence (%) - American Indian and Alaska Native
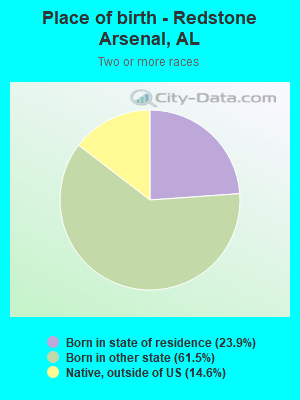
Place of birth - Born in state of residence (%) - Multirace
Place of birth - Born in state of residence (%) - Other Race
Place of birth - Born in other state (%)
Place of birth - Born in other state (%) - White
Place of birth - Born in other state (%) - Black or African American
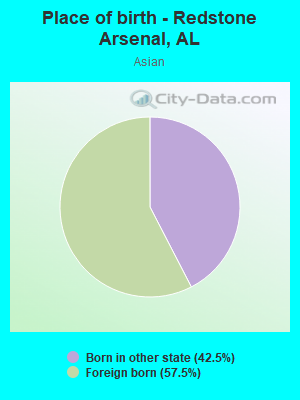
Place of birth - Born in other state (%) - Asian
Place of birth - Born in other state (%) - Hispanic or Latino
Place of birth - Born in other state (%) - American Indian and Alaska Native
Place of birth - Born in other state (%) - Multirace
Place of birth - Born in other state (%) - Other Race
Place of birth - Native, outside of US (%)
Place of birth - Native, outside of US (%) - White
Place of birth - Native, outside of US (%) - Black or African American
Place of birth - Native, outside of US (%) - Asian
Place of birth - Native, outside of US (%) - Hispanic or Latino
Place of birth - Native, outside of US (%) - American Indian and Alaska Native
Place of birth - Native, outside of US (%) - Multirace
Place of birth - Native, outside of US (%) - Other Race
Place of birth - Foreign born (%)
Place of birth - Foreign born (%) - White
Place of birth - Foreign born (%) - Black or African American
Place of birth - Foreign born (%) - Asian
Place of birth - Foreign born (%) - Hispanic or Latino
Place of birth - Foreign born (%) - American Indian and Alaska Native
Place of birth - Foreign born (%) - Multirace
Place of birth - Foreign born (%) - Other Race
Residents speaking English at home (%)
Residents speaking English at home - Born in the United States (%)
Residents speaking English at home - Native, born elsewhere (%)
Residents speaking English at home - Foreign born (%)
Residents speaking Spanish at home (%)
Residents speaking Spanish at home - Born in the United States (%)
Residents speaking Spanish at home - Native, born elsewhere (%)
Residents speaking Spanish at home - Foreign born (%)
Residents speaking other language at home (%)
Residents speaking other language at home - Born in the United States (%)
Residents speaking other language at home - Native, born elsewhere (%)
Residents speaking other language at home - Foreign born (%)
Marital status - Never married (%)
Marital status - Now married (%)
Marital status - Separated (%)
Marital status - Widowed (%)
Marital status - Divorced (%)
Ancestries Reported - Arab (%)
Ancestries Reported - Czech (%)
Ancestries Reported - Danish (%)
Ancestries Reported - Dutch (%)
Ancestries Reported - English (%)
Ancestries Reported - French (%)
Ancestries Reported - French Canadian (%)
Ancestries Reported - German (%)
Ancestries Reported - Greek (%)
Ancestries Reported - Hungarian (%)
Ancestries Reported - Irish (%)
Ancestries Reported - Italian (%)
Ancestries Reported - Lithuanian (%)
Ancestries Reported - Norwegian (%)
Ancestries Reported - Polish (%)
Ancestries Reported - Portuguese (%)
Ancestries Reported - Russian (%)
Ancestries Reported - Scotch-Irish (%)
Ancestries Reported - Scottish (%)
Ancestries Reported - Slovak (%)
Ancestries Reported - Subsaharan African (%)
Ancestries Reported - Swedish (%)
Ancestries Reported - Swiss (%)
Ancestries Reported - Ukrainian (%)
Ancestries Reported - United States (%)
Ancestries Reported - Welsh (%)
Ancestries Reported - West Indian (%)
Ancestries Reported - Other (%)
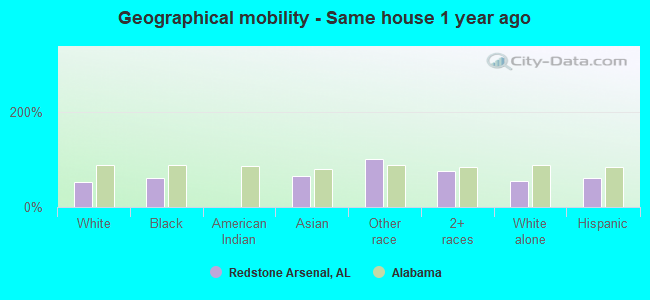
Geographical mobility - Same house 1 year ago (%)
Geographical mobility - Same house 1 year ago (%) - White
Geographical mobility - Same house 1 year ago (%) - Black or African American
Geographical mobility - Same house 1 year ago (%) - Asian
Geographical mobility - Same house 1 year ago (%) - Hispanic or Latino
Geographical mobility - Same house 1 year ago (%) - American Indian and Alaska Native
Geographical mobility - Same house 1 year ago (%) - Multirace
Geographical mobility - Same house 1 year ago (%) - Other Race
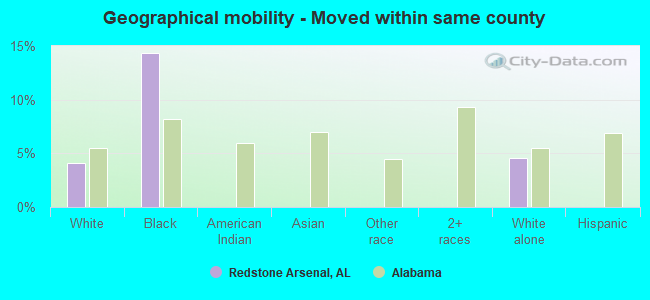
Geographical mobility - Moved within same county (%)
Geographical mobility - Moved within same county (%) - White
Geographical mobility - Moved within same county (%) - Black or African American
Geographical mobility - Moved within same county (%) - Asian
Geographical mobility - Moved within same county (%) - Hispanic or Latino
Geographical mobility - Moved within same county (%) - American Indian and Alaska Native
Geographical mobility - Moved within same county (%) - Multirace
Geographical mobility - Moved within same county (%) - Other Race
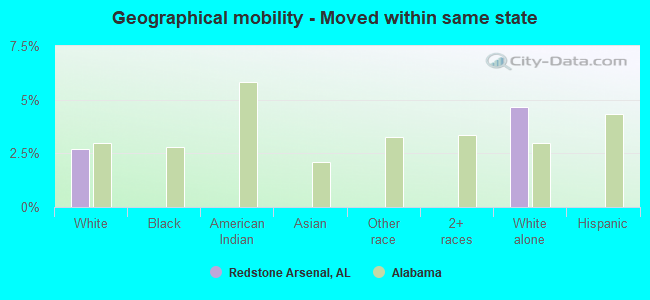
Geographical mobility - Moved from different county within same state (%)
Geographical mobility - Moved from different county within same state (%) - White
Geographical mobility - Moved from different county within same state (%) - Black or African American
Geographical mobility - Moved from different county within same state (%) - Asian
Geographical mobility - Moved from different county within same state (%) - Hispanic or Latino
Geographical mobility - Moved from different county within same state (%) - American Indian and Alaska Native
Geographical mobility - Moved from different county within same state (%) - Multirace
Geographical mobility - Moved from different county within same state (%) - Other Race
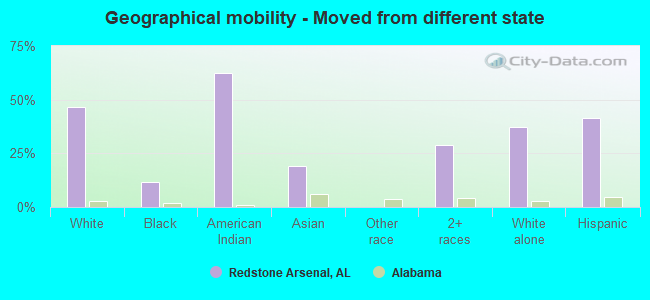
Geographical mobility - Moved from different state (%)
Geographical mobility - Moved from different state (%) - White
Geographical mobility - Moved from different state (%) - Black or African American
Geographical mobility - Moved from different state (%) - Asian
Geographical mobility - Moved from different state (%) - Hispanic or Latino
Geographical mobility - Moved from different state (%) - American Indian and Alaska Native
Geographical mobility - Moved from different state (%) - Multirace
Geographical mobility - Moved from different state (%) - Other Race
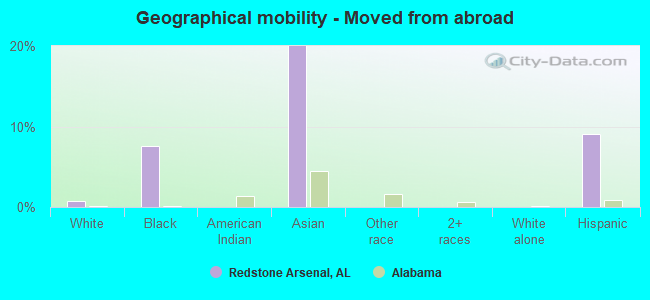
Geographical mobility - Moved from abroad (%)
Geographical mobility - Moved from abroad (%) - White
Geographical mobility - Moved from abroad (%) - Black or African American
Geographical mobility - Moved from abroad (%) - Asian
Geographical mobility - Moved from abroad (%) - Hispanic or Latino
Geographical mobility - Moved from abroad (%) - American Indian and Alaska Native
Geographical mobility - Moved from abroad (%) - Multirace
Geographical mobility - Moved from abroad (%) - Other Race
Place of birth for the foreign-born population - Ireland (%)
Place of birth for the foreign-born population - Denmark (%)
Place of birth for the foreign-born population - Norway (%)
Place of birth for the foreign-born population - Sweden (%)
Place of birth for the foreign-born population - United Kingdom (%)
Place of birth for the foreign-born population - England (%)
Place of birth for the foreign-born population - Scotland (%)
Place of birth for the foreign-born population - Other Northern Europe (%)
Place of birth for the foreign-born population - Austria (%)
Place of birth for the foreign-born population - Belgium (%)
Place of birth for the foreign-born population - France (%)
Place of birth for the foreign-born population - Germany (%)
Place of birth for the foreign-born population - Netherlands (%)
Place of birth for the foreign-born population - Switzerland (%)
Place of birth for the foreign-born population - Other Western Europe (%)
Place of birth for the foreign-born population - Greece (%)
Place of birth for the foreign-born population - Italy (%)
Place of birth for the foreign-born population - Portugal (%)
Place of birth for the foreign-born population - Spain (%)
Place of birth for the foreign-born population - Other Southern Europe (%)
Place of birth for the foreign-born population - Albania (%)
Place of birth for the foreign-born population - Belarus (%)
Place of birth for the foreign-born population - Bosnia and Herzegovina (%)
Place of birth for the foreign-born population - Bulgaria (%)
Place of birth for the foreign-born population - Croatia (%)
Place of birth for the foreign-born population - Czechoslovakia (%)
Place of birth for the foreign-born population - Hungary (%)
Place of birth for the foreign-born population - Latvia (%)
Place of birth for the foreign-born population - Lithuania (%)
Place of birth for the foreign-born population - North Macedonia (Macedonia) (%)
Place of birth for the foreign-born population - Moldova (%)
Place of birth for the foreign-born population - Poland (%)
Place of birth for the foreign-born population - Romania (%)
Place of birth for the foreign-born population - Russia (%)
Place of birth for the foreign-born population - Serbia (%)
Place of birth for the foreign-born population - Ukraine (%)
Place of birth for the foreign-born population - Other Eastern Europe (%)
Place of birth for the foreign-born population - China (%)
Place of birth for the foreign-born population - Hong Kong (%)
Place of birth for the foreign-born population - Taiwan (%)
Place of birth for the foreign-born population - Japan (%)
Place of birth for the foreign-born population - Korea (%)
Place of birth for the foreign-born population - Other Eastern Asia (%)
Place of birth for the foreign-born population - Afghanistan (%)
Place of birth for the foreign-born population - Bangladesh (%)
Place of birth for the foreign-born population - India (%)
Place of birth for the foreign-born population - Iran (%)
Place of birth for the foreign-born population - Kazakhstan (%)
Place of birth for the foreign-born population - Nepal (%)
Place of birth for the foreign-born population - Pakistan (%)
Place of birth for the foreign-born population - Sri Lanka (%)
Place of birth for the foreign-born population - Uzbekistan (%)
Place of birth for the foreign-born population - Other South Central Asia (%)
Place of birth for the foreign-born population - Burma (%)
Place of birth for the foreign-born population - Cambodia (%)
Place of birth for the foreign-born population - Indonesia (%)
Place of birth for the foreign-born population - Laos (%)
Place of birth for the foreign-born population - Malaysia (%)
Place of birth for the foreign-born population - Philippines (%)
Place of birth for the foreign-born population - Singapore (%)
Place of birth for the foreign-born population - Thailand (%)
Place of birth for the foreign-born population - Vietnam (%)
Place of birth for the foreign-born population - Other South Eastern Asia (%)
Place of birth for the foreign-born population - Armenia (%)
Place of birth for the foreign-born population - Iraq (%)
Place of birth for the foreign-born population - Israel (%)
Place of birth for the foreign-born population - Jordan (%)
Place of birth for the foreign-born population - Kuwait (%)
Place of birth for the foreign-born population - Lebanon (%)
Place of birth for the foreign-born population - Saudi Arabia (%)
Place of birth for the foreign-born population - Syria (%)
Place of birth for the foreign-born population - Turkey (%)
Place of birth for the foreign-born population - Yemen (%)
Place of birth for the foreign-born population - Other Western Asia (%)
Place of birth for the foreign-born population - Eritrea (%)
Place of birth for the foreign-born population - Ethiopia (%)
Place of birth for the foreign-born population - Kenya (%)
Place of birth for the foreign-born population - Somalia (%)
Place of birth for the foreign-born population - Uganda (%)
Place of birth for the foreign-born population - Zimbabwe (%)
Place of birth for the foreign-born population - Other Eastern Africa (%)
Place of birth for the foreign-born population - Cameroon (%)
Place of birth for the foreign-born population - Congo (%)
Place of birth for the foreign-born population - Democratic Republic of Congo (Zaire) (%)
Place of birth for the foreign-born population - Other Middle Africa (%)
Place of birth for the foreign-born population - Egypt (%)
Place of birth for the foreign-born population - Morocco (%)
Place of birth for the foreign-born population - Sudan (%)
Place of birth for the foreign-born population - Other Northern Africa (%)
Place of birth for the foreign-born population - South Africa (%)
Place of birth for the foreign-born population - Other Southern Africa (%)
Place of birth for the foreign-born population - Cabo Verde (%)
Place of birth for the foreign-born population - Ghana (%)
Place of birth for the foreign-born population - Liberia (%)
Place of birth for the foreign-born population - Nigeria (%)
Place of birth for the foreign-born population - Senegal (%)
Place of birth for the foreign-born population - Sierra Leone (%)
Place of birth for the foreign-born population - Other Western Africa (%)
Place of birth for the foreign-born population - Australia (%)
Place of birth for the foreign-born population - New Zealand (%)
Place of birth for the foreign-born population - Fiji (%)
Place of birth for the foreign-born population - Micronesia (%)
Place of birth for the foreign-born population - Bahamas (%)
Place of birth for the foreign-born population - Barbados (%)
Place of birth for the foreign-born population - Cuba (%)
Place of birth for the foreign-born population - Dominica (%)
Place of birth for the foreign-born population - Dominican Republic (%)
Place of birth for the foreign-born population - Grenada (%)
Place of birth for the foreign-born population - Haiti (%)
Place of birth for the foreign-born population - Jamaica (%)
Place of birth for the foreign-born population - St. Vincent and the Grenadines (%)
Place of birth for the foreign-born population - Trinidad and Tobago (%)
Place of birth for the foreign-born population - West Indies (%)
Place of birth for the foreign-born population - Other Caribbean (%)
Place of birth for the foreign-born population - Belize (%)
Place of birth for the foreign-born population - Costa Rica (%)
Place of birth for the foreign-born population - El Salvador (%)
Place of birth for the foreign-born population - Guatemala (%)
Place of birth for the foreign-born population - Honduras (%)
Place of birth for the foreign-born population - Mexico (%)
Place of birth for the foreign-born population - Nicaragua (%)
Place of birth for the foreign-born population - Panama (%)
Place of birth for the foreign-born population - Other Central America (%)
Place of birth for the foreign-born population - Argentina (%)
Place of birth for the foreign-born population - Bolivia (%)
Place of birth for the foreign-born population - Brazil (%)
Place of birth for the foreign-born population - Chile (%)
Place of birth for the foreign-born population - Colombia (%)
Place of birth for the foreign-born population - Ecuador (%)
Place of birth for the foreign-born population - Guyana (%)
Place of birth for the foreign-born population - Peru (%)
Place of birth for the foreign-born population - Uruguay (%)
Place of birth for the foreign-born population - Venezuela (%)
Place of birth for the foreign-born population - Other South America (%)
Place of birth for the foreign-born population - Canada (%)
Place of birth for the foreign-born population - Other Northern America (%)
Place of birth for the foreign-born population - Other (%)
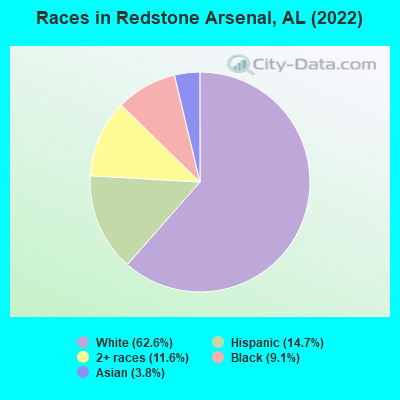
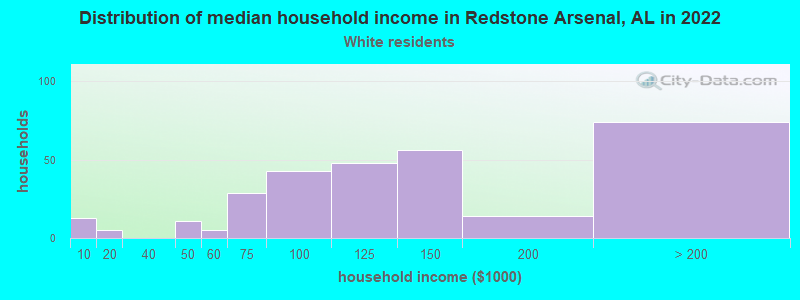
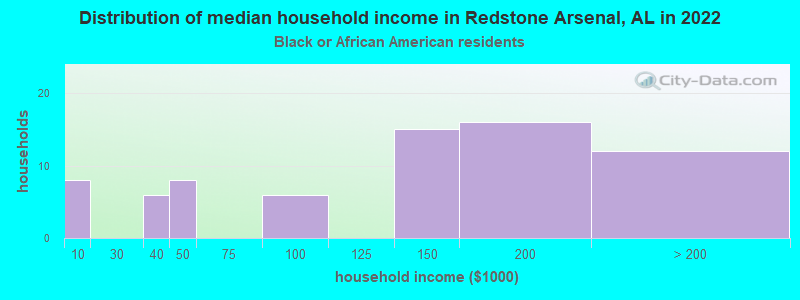
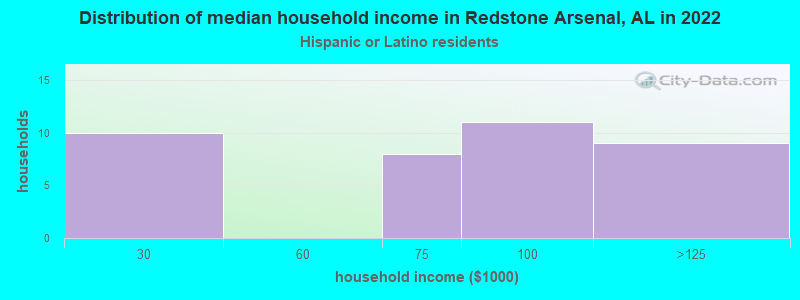
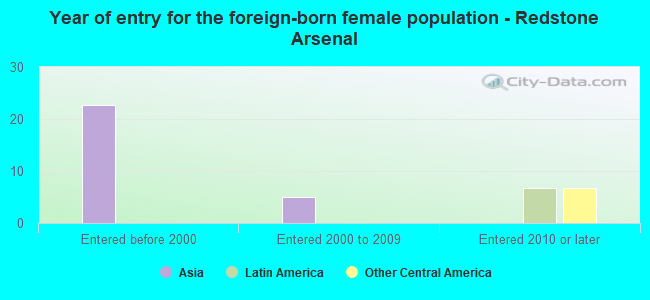
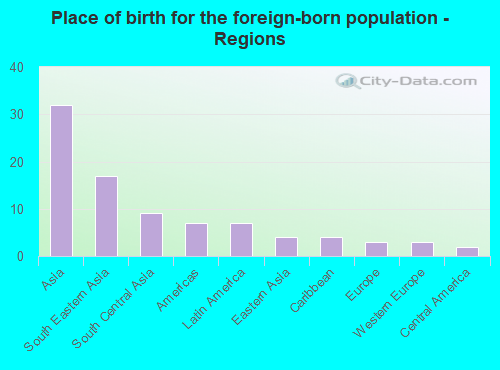
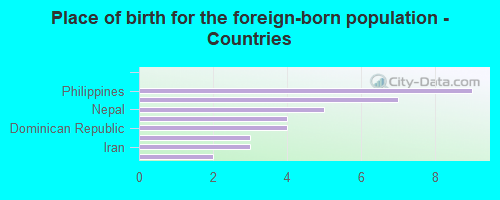
According to 2022 data, the most numerous races in Redstone Arsenal, AL are White alone (624 residents), Black alone (511 residents), and Hispanic (100 residents). 95.3% of Redstone Arsenal residents speak English at home. 3.1% of Redstone Arsenal, AL residents are foreign-born (2.4% born in Asia, 0.6% born in Latin America), which is 3.8% greater than the foreign-born rate of 3.0% across the entire state of Alabama.
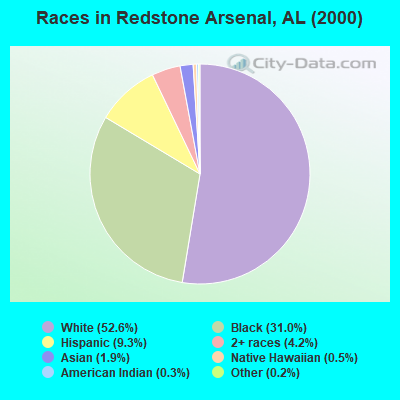
Race distribution in Redstone Arsenal
2000 2022
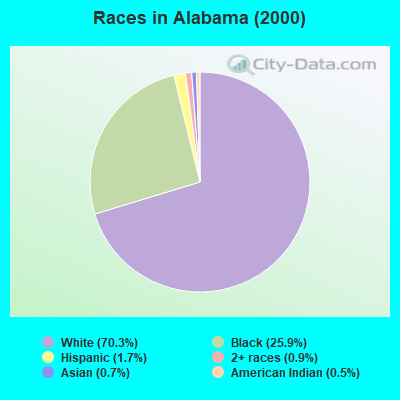
3,125,819 70.3% White alone 1,150,076 25.9% Black alone 75,830 1.7% Hispanic 39,086 0.9% Two or more races 30,989 0.7% Asian alone 21,618 0.5% American Indian alone 2,623 0.06% Other race alone 1,059 0.02% Native Hawaiian and Other
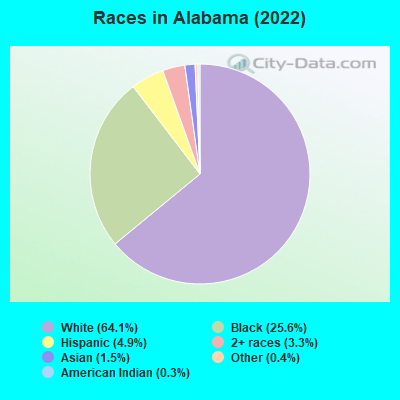
3,250,182 64.1% White alone 1,296,500 25.6% Black alone 246,477 4.9% Hispanic 169,880 3.3% Two or more races 76,682 1.5% Asian alone 19,927 0.4% Other race alone 12,694 0.3% American Indian alone 1,954 0.04% Native Hawaiian and Other
Income and house value in Redstone Arsenal Median household income in 2022 $119,043 White non-Hispanic householders$79,958 Black householders$96,398 Some other race householders$114,266 Two or more races householders$118,475 Hispanic or Latino race householders
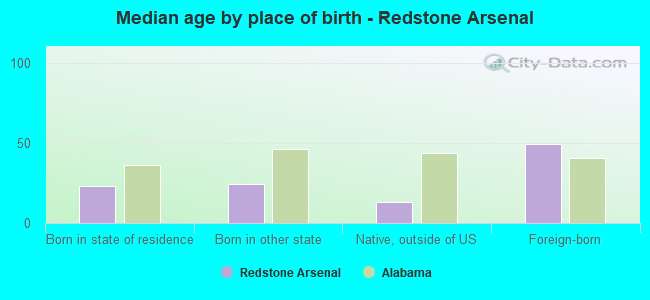
Median age by race in Redstone Arsenal
30.8 Median age for White residents30.6 31.9 24.4 Median age for Black or African American residents24.4 24.4 22.0 Median age for Asian residents20.4 45.0 21.0 Median age for Other race residents13.6 Median age for Two or more races residents13.8 9.6 30.3 Median age for White alone residents29.4 31.5 43.2 Median age for Hispanic or Latino residents50.7 39.8
Owner/renter occupied households by race in Redstone Arsenal
House owners and renters - White residents 5 2.2% Owner occupied237 97.8% Renter occupiedHouse owners and renters - Black or African American residents 112 100.0% Renter occupiedHouse owners and renters - Asian residents 6 100.0% Renter occupiedHouse owners and renters - White alone residents 5 2.4% Owner occupied214 97.6% Renter occupiedHouse owners and renters - Hispanic or Latino residents 28 100.0% Renter occupied
Language usage in Redstone Arsenal
English speakers - Total 95.3% of residents of Redstone Arsenal speak English at home.
1.8% of residents speak Spanish at home 18 78.3% Speak English very well5 21.7% Speak English less than very well2.6% of residents speak other language at home 30 90.9% Speak English very well3 9.1% Speak English less than very well
English speakers - Born in the United States 96.8% of residents of Redstone Arsenal speak English at home.
2.0% of residents speak Spanish at home 15 75.0% Speak English very well5 25.0% Speak English less than very well1.2% of residents speak other language at home 12 100.0% Speak English very well
All residents speak only English at home
English speakers - Foreign-born 45.7% of residents of Redstone Arsenal speak English at home.
6.5% of residents speak Spanish at home 3 100.0% Speak English very well47.8% of residents speak other language at home 18 81.8% Speak English very well4 18.2% Speak English less than very well
White (Caucasian) - Speak only English Native:
97.3% (604)Foreign-born:
54.5% (6)
White (Caucasian) - Speak another language Native:
2.4% (15)Foreign-born:
44.6% (5)
Asian - Speak only English Native:
100.0% (17)Foreign-born:
51.1% (18)
White alone - Speak only English Native:
99.6% (575)Foreign-born:
37.8% (3)
White alone - Speak another language Native:
0.5% (3)Foreign-born:
64.6% (5)
Hispanic or Latino - Speak only English Native:
89.0% (89)Foreign-born:
27.5% (3)
Hispanic or Latino - Speak another language Native:
19.2% (19)Foreign-born:
56.1% (6)
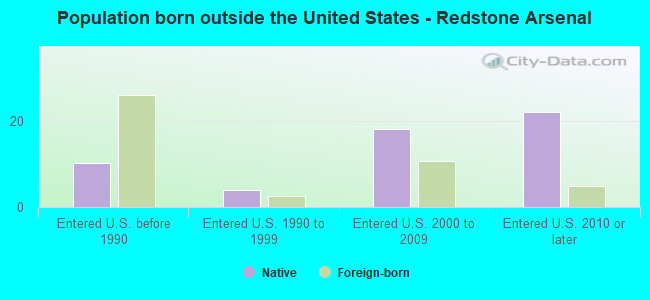
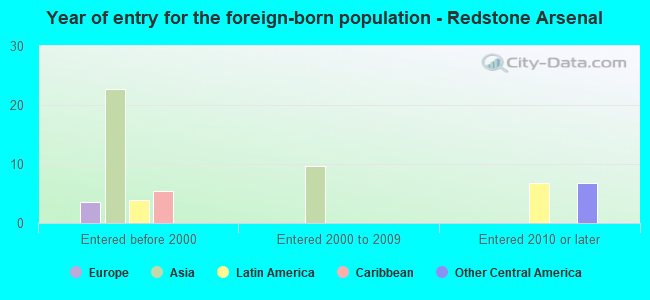
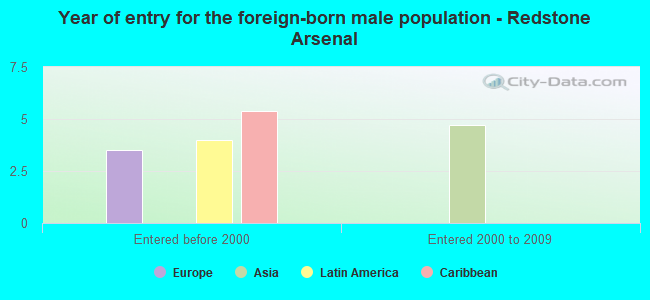
Foreign-born residents in Redstone Arsenal 44 residents are foreign born (2.4% Asia , 0.6% Latin America ).
This city:
3.1%Alabama:
100.0%
Marital status for residents in Redstone Arsenal Marital status - White (Caucasian) population 15 years and over
Males 38.6% Never married52.2% Now married1.1% Separated0.0% Widowed8.1% DivorcedFemales 20.1% Never married75.1% Now married1.8% Separated3.0% Widowed0.0% DivorcedWomen who did not give birth in the past 12 months Now married:
68.5% (74)Unmarried:
31.5% (34)
Marital status - Black or African American population 15 years and over
Males 53.6% Never married39.8% Now married0.0% Separated0.0% Widowed6.6% DivorcedFemales 33.6% Never married30.0% Now married0.0% Separated0.0% Widowed36.4% DivorcedWomen who gave birth in the past 12 months Now married:
100.0% (14)Unmarried:
0.0% (0)
Women who did not give birth in the past 12 months Now married:
21.6% (44)Unmarried:
78.4% (158)
Marital status - Asian population 15 years and over
Males 100.0% Never married0.0% Now married0.0% Separated0.0% Widowed0.0% DivorcedFemales 0.0% Never married100.0% Now married0.0% Separated0.0% Widowed0.0% DivorcedWomen who did not give birth in the past 12 months Now married:
100.0% (19)Unmarried:
0.0% (0)
Marital status - Other race population 15 years and over
Males 0.0% Never married100.0% Now married0.0% Separated0.0% Widowed0.0% DivorcedFemales 0.0% Never married100.0% Now married0.0% Separated0.0% Widowed0.0% DivorcedWomen who did not give birth in the past 12 months Now married:
100.0% (9)Unmarried:
0.0% (0)
Marital status - Two or more races population 15 years and over
Males 68.2% Never married31.8% Now married0.0% Separated0.0% Widowed0.0% DivorcedFemales 0.0% Never married100.0% Now married0.0% Separated0.0% Widowed0.0% DivorcedWomen who did not give birth in the past 12 months Now married:
100.0% (11)Unmarried:
0.0% (0)
Marital status - White alone, not Hispanic / Latino population 15 years and over
Males 39.4% Never married52.0% Now married1.2% Separated0.0% Widowed7.3% DivorcedFemales 19.1% Never married78.9% Now married2.0% Separated0.0% Widowed0.0% DivorcedWomen who did not give birth in the past 12 months Now married:
69.8% (68)Unmarried:
30.2% (30)
Marital status - Hispanic or Latino population 15 years and over
Males 38.2% Never married52.7% Now married0.0% Separated0.0% Widowed9.1% DivorcedFemales 18.5% Never married63.0% Now married0.0% Separated18.5% Widowed0.0% DivorcedWomen who did not give birth in the past 12 months Now married:
77.3% (18)Unmarried:
22.7% (5)
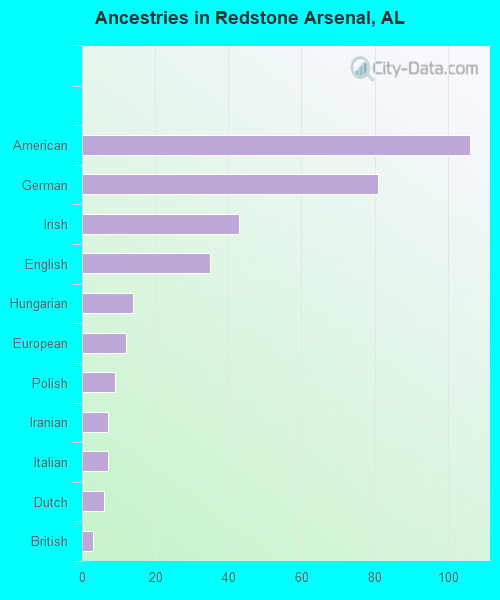
Ancestries in Redstone Arsenal
100 17.1% American27 4.6% European20 3.4% English16 2.7% Hungarian15 2.6% German15 2.6% Irish8 1.4% Italian6 1.0% Portuguese6 1.0% Scotch-Irish5 0.9% Scottish4 0.7% British3 0.5% French3 0.5% Iranian
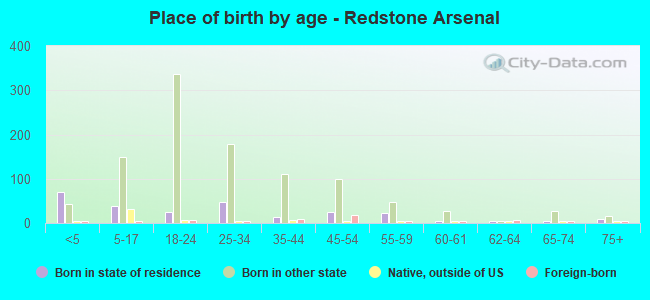
Children Nativity (place of birth) in Redstone Arsenal
Children under 6 years - Living with two parents Both parents native 97 100.0% NativeOne native, one foreign-born parent 4 100.0% NativeChildren under 6 years - Living with one parent Native parent 14 100.0% NativeForeign-born parent 16 100.0% NativeChildren 6 to 17 years - Living with two parents Both parents native 141 100.0% NativeOne native, one foreign-born parent 10 100.0% NativeChildren 6 to 17 years - Living with one parent Native parent 13 100.0% NativeForeign-born parent 17 50.8% Native16 49.2% Foreign-born