Races in Reedley, California (CA) Detailed Stats
Data:
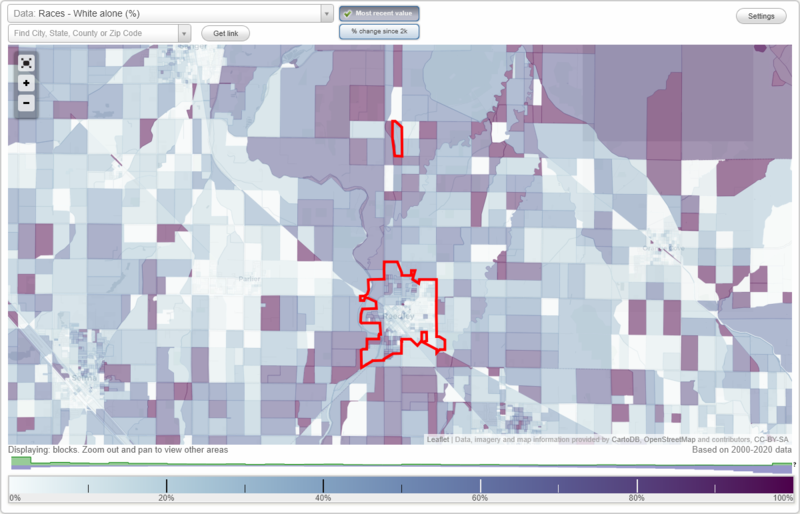
Races - White alone (%)
Races - White alone (% change since 2000)
Races - Black alone (%)
Races - Black alone (% change since 2000)
Races - American Indian alone (%)
Races - American Indian alone (% change since 2000)
Races - Asian alone (%)
Races - Asian alone (% change since 2000)
Races - Hispanic (%)
Races - Hispanic (% change since 2000)
Races - Native Hawaiian and Other Pacific Islander alone (%)
Races - Native Hawaiian and Other Pacific Islander alone (% change since 2000)
Races - Two or more races(%)
Races - Two or more races(% change since 2000)
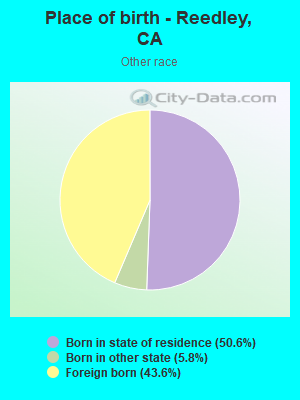
Races - Other race alone (%)
Races - Other race alone (% change since 2000)
Racial diversity
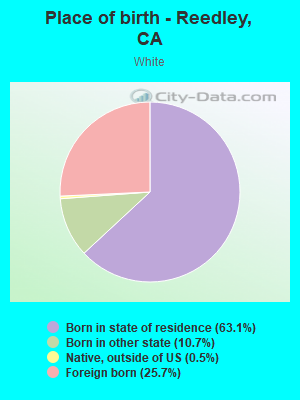
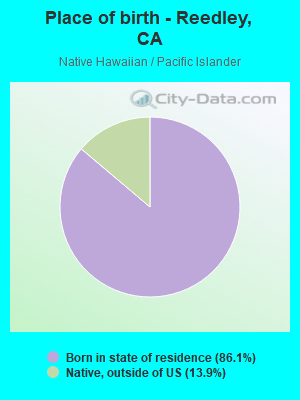
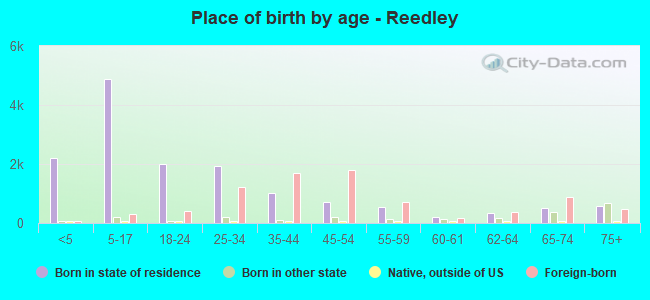
Place of birth - Born in state of residence (%)
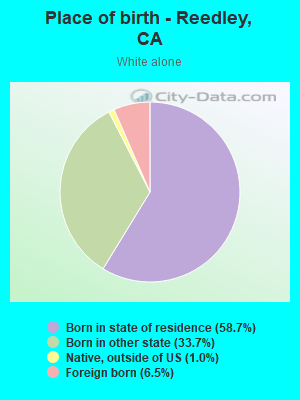
Place of birth - Born in state of residence (%) - White
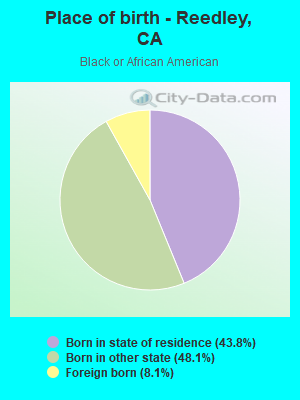
Place of birth - Born in state of residence (%) - Black or African American
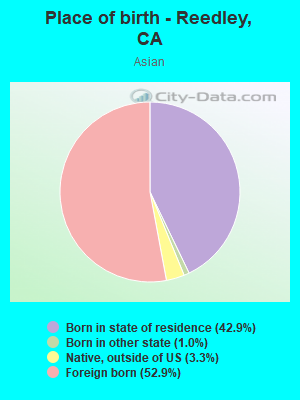
Place of birth - Born in state of residence (%) - Asian
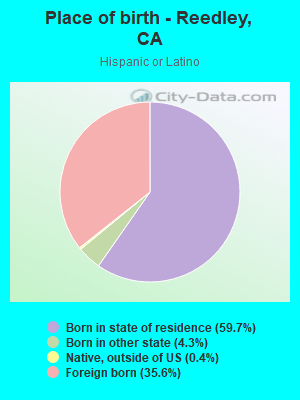
Place of birth - Born in state of residence (%) - Hispanic or Latino
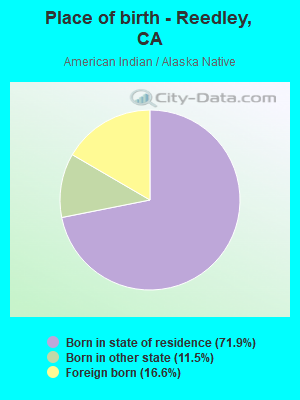
Place of birth - Born in state of residence (%) - American Indian and Alaska Native
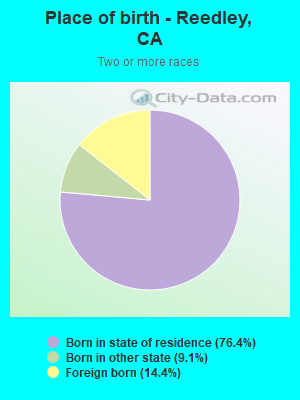
Place of birth - Born in state of residence (%) - Multirace
Place of birth - Born in state of residence (%) - Other Race
Place of birth - Born in other state (%)
Place of birth - Born in other state (%) - White
Place of birth - Born in other state (%) - Black or African American
Place of birth - Born in other state (%) - Asian
Place of birth - Born in other state (%) - Hispanic or Latino
Place of birth - Born in other state (%) - American Indian and Alaska Native
Place of birth - Born in other state (%) - Multirace
Place of birth - Born in other state (%) - Other Race
Place of birth - Native, outside of US (%)
Place of birth - Native, outside of US (%) - White
Place of birth - Native, outside of US (%) - Black or African American
Place of birth - Native, outside of US (%) - Asian
Place of birth - Native, outside of US (%) - Hispanic or Latino
Place of birth - Native, outside of US (%) - American Indian and Alaska Native
Place of birth - Native, outside of US (%) - Multirace
Place of birth - Native, outside of US (%) - Other Race
Place of birth - Foreign born (%)
Place of birth - Foreign born (%) - White
Place of birth - Foreign born (%) - Black or African American
Place of birth - Foreign born (%) - Asian
Place of birth - Foreign born (%) - Hispanic or Latino
Place of birth - Foreign born (%) - American Indian and Alaska Native
Place of birth - Foreign born (%) - Multirace
Place of birth - Foreign born (%) - Other Race
Residents speaking English at home (%)
Residents speaking English at home - Born in the United States (%)
Residents speaking English at home - Native, born elsewhere (%)
Residents speaking English at home - Foreign born (%)
Residents speaking Spanish at home (%)
Residents speaking Spanish at home - Born in the United States (%)
Residents speaking Spanish at home - Native, born elsewhere (%)
Residents speaking Spanish at home - Foreign born (%)
Residents speaking other language at home (%)
Residents speaking other language at home - Born in the United States (%)
Residents speaking other language at home - Native, born elsewhere (%)
Residents speaking other language at home - Foreign born (%)
Marital status - Never married (%)
Marital status - Now married (%)
Marital status - Separated (%)
Marital status - Widowed (%)
Marital status - Divorced (%)
Ancestries Reported - Arab (%)
Ancestries Reported - Czech (%)
Ancestries Reported - Danish (%)
Ancestries Reported - Dutch (%)
Ancestries Reported - English (%)
Ancestries Reported - French (%)
Ancestries Reported - French Canadian (%)
Ancestries Reported - German (%)
Ancestries Reported - Greek (%)
Ancestries Reported - Hungarian (%)
Ancestries Reported - Irish (%)
Ancestries Reported - Italian (%)
Ancestries Reported - Lithuanian (%)
Ancestries Reported - Norwegian (%)
Ancestries Reported - Polish (%)
Ancestries Reported - Portuguese (%)
Ancestries Reported - Russian (%)
Ancestries Reported - Scotch-Irish (%)
Ancestries Reported - Scottish (%)
Ancestries Reported - Slovak (%)
Ancestries Reported - Subsaharan African (%)
Ancestries Reported - Swedish (%)
Ancestries Reported - Swiss (%)
Ancestries Reported - Ukrainian (%)
Ancestries Reported - United States (%)
Ancestries Reported - Welsh (%)
Ancestries Reported - West Indian (%)
Ancestries Reported - Other (%)
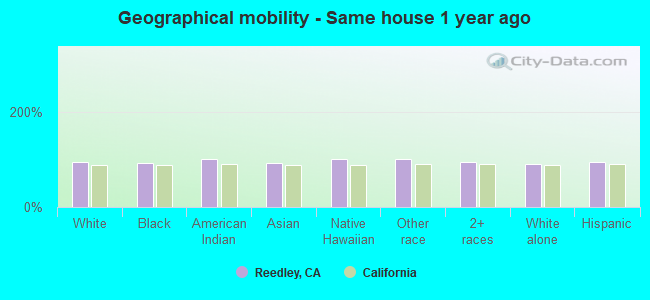
Geographical mobility - Same house 1 year ago (%)
Geographical mobility - Same house 1 year ago (%) - White
Geographical mobility - Same house 1 year ago (%) - Black or African American
Geographical mobility - Same house 1 year ago (%) - Asian
Geographical mobility - Same house 1 year ago (%) - Hispanic or Latino
Geographical mobility - Same house 1 year ago (%) - American Indian and Alaska Native
Geographical mobility - Same house 1 year ago (%) - Multirace
Geographical mobility - Same house 1 year ago (%) - Other Race
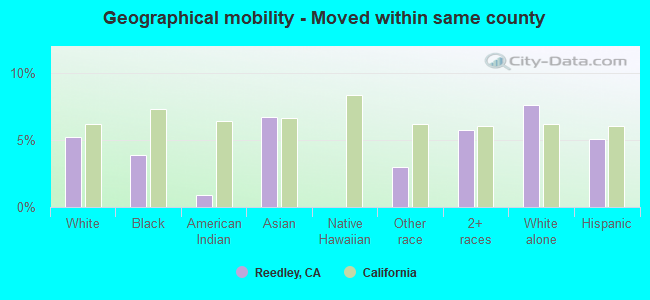
Geographical mobility - Moved within same county (%)
Geographical mobility - Moved within same county (%) - White
Geographical mobility - Moved within same county (%) - Black or African American
Geographical mobility - Moved within same county (%) - Asian
Geographical mobility - Moved within same county (%) - Hispanic or Latino
Geographical mobility - Moved within same county (%) - American Indian and Alaska Native
Geographical mobility - Moved within same county (%) - Multirace
Geographical mobility - Moved within same county (%) - Other Race
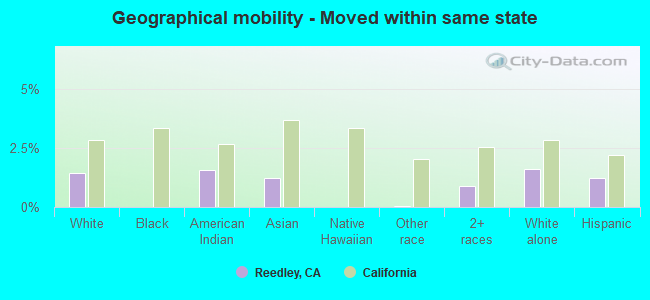
Geographical mobility - Moved from different county within same state (%)
Geographical mobility - Moved from different county within same state (%) - White
Geographical mobility - Moved from different county within same state (%) - Black or African American
Geographical mobility - Moved from different county within same state (%) - Asian
Geographical mobility - Moved from different county within same state (%) - Hispanic or Latino
Geographical mobility - Moved from different county within same state (%) - American Indian and Alaska Native
Geographical mobility - Moved from different county within same state (%) - Multirace
Geographical mobility - Moved from different county within same state (%) - Other Race
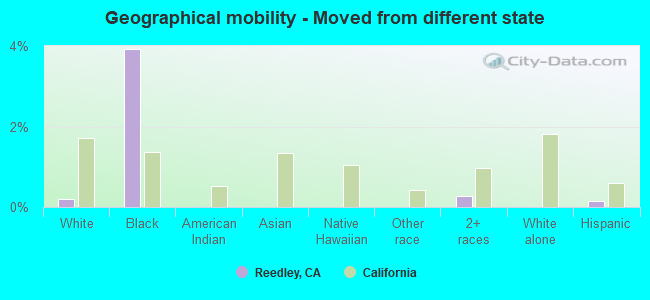
Geographical mobility - Moved from different state (%)
Geographical mobility - Moved from different state (%) - White
Geographical mobility - Moved from different state (%) - Black or African American
Geographical mobility - Moved from different state (%) - Asian
Geographical mobility - Moved from different state (%) - Hispanic or Latino
Geographical mobility - Moved from different state (%) - American Indian and Alaska Native
Geographical mobility - Moved from different state (%) - Multirace
Geographical mobility - Moved from different state (%) - Other Race
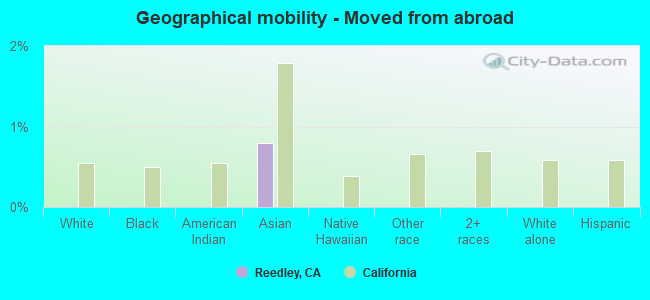
Geographical mobility - Moved from abroad (%)
Geographical mobility - Moved from abroad (%) - White
Geographical mobility - Moved from abroad (%) - Black or African American
Geographical mobility - Moved from abroad (%) - Asian
Geographical mobility - Moved from abroad (%) - Hispanic or Latino
Geographical mobility - Moved from abroad (%) - American Indian and Alaska Native
Geographical mobility - Moved from abroad (%) - Multirace
Geographical mobility - Moved from abroad (%) - Other Race
Place of birth for the foreign-born population - Ireland (%)
Place of birth for the foreign-born population - Denmark (%)
Place of birth for the foreign-born population - Norway (%)
Place of birth for the foreign-born population - Sweden (%)
Place of birth for the foreign-born population - United Kingdom (%)
Place of birth for the foreign-born population - England (%)
Place of birth for the foreign-born population - Scotland (%)
Place of birth for the foreign-born population - Other Northern Europe (%)
Place of birth for the foreign-born population - Austria (%)
Place of birth for the foreign-born population - Belgium (%)
Place of birth for the foreign-born population - France (%)
Place of birth for the foreign-born population - Germany (%)
Place of birth for the foreign-born population - Netherlands (%)
Place of birth for the foreign-born population - Switzerland (%)
Place of birth for the foreign-born population - Other Western Europe (%)
Place of birth for the foreign-born population - Greece (%)
Place of birth for the foreign-born population - Italy (%)
Place of birth for the foreign-born population - Portugal (%)
Place of birth for the foreign-born population - Spain (%)
Place of birth for the foreign-born population - Other Southern Europe (%)
Place of birth for the foreign-born population - Albania (%)
Place of birth for the foreign-born population - Belarus (%)
Place of birth for the foreign-born population - Bosnia and Herzegovina (%)
Place of birth for the foreign-born population - Bulgaria (%)
Place of birth for the foreign-born population - Croatia (%)
Place of birth for the foreign-born population - Czechoslovakia (%)
Place of birth for the foreign-born population - Hungary (%)
Place of birth for the foreign-born population - Latvia (%)
Place of birth for the foreign-born population - Lithuania (%)
Place of birth for the foreign-born population - North Macedonia (Macedonia) (%)
Place of birth for the foreign-born population - Moldova (%)
Place of birth for the foreign-born population - Poland (%)
Place of birth for the foreign-born population - Romania (%)
Place of birth for the foreign-born population - Russia (%)
Place of birth for the foreign-born population - Serbia (%)
Place of birth for the foreign-born population - Ukraine (%)
Place of birth for the foreign-born population - Other Eastern Europe (%)
Place of birth for the foreign-born population - China (%)
Place of birth for the foreign-born population - Hong Kong (%)
Place of birth for the foreign-born population - Taiwan (%)
Place of birth for the foreign-born population - Japan (%)
Place of birth for the foreign-born population - Korea (%)
Place of birth for the foreign-born population - Other Eastern Asia (%)
Place of birth for the foreign-born population - Afghanistan (%)
Place of birth for the foreign-born population - Bangladesh (%)
Place of birth for the foreign-born population - India (%)
Place of birth for the foreign-born population - Iran (%)
Place of birth for the foreign-born population - Kazakhstan (%)
Place of birth for the foreign-born population - Nepal (%)
Place of birth for the foreign-born population - Pakistan (%)
Place of birth for the foreign-born population - Sri Lanka (%)
Place of birth for the foreign-born population - Uzbekistan (%)
Place of birth for the foreign-born population - Other South Central Asia (%)
Place of birth for the foreign-born population - Burma (%)
Place of birth for the foreign-born population - Cambodia (%)
Place of birth for the foreign-born population - Indonesia (%)
Place of birth for the foreign-born population - Laos (%)
Place of birth for the foreign-born population - Malaysia (%)
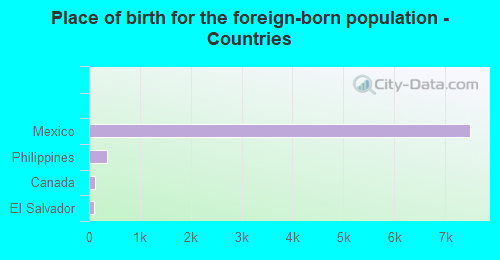
Place of birth for the foreign-born population - Philippines (%)
Place of birth for the foreign-born population - Singapore (%)
Place of birth for the foreign-born population - Thailand (%)
Place of birth for the foreign-born population - Vietnam (%)
Place of birth for the foreign-born population - Other South Eastern Asia (%)
Place of birth for the foreign-born population - Armenia (%)
Place of birth for the foreign-born population - Iraq (%)
Place of birth for the foreign-born population - Israel (%)
Place of birth for the foreign-born population - Jordan (%)
Place of birth for the foreign-born population - Kuwait (%)
Place of birth for the foreign-born population - Lebanon (%)
Place of birth for the foreign-born population - Saudi Arabia (%)
Place of birth for the foreign-born population - Syria (%)
Place of birth for the foreign-born population - Turkey (%)
Place of birth for the foreign-born population - Yemen (%)
Place of birth for the foreign-born population - Other Western Asia (%)
Place of birth for the foreign-born population - Eritrea (%)
Place of birth for the foreign-born population - Ethiopia (%)
Place of birth for the foreign-born population - Kenya (%)
Place of birth for the foreign-born population - Somalia (%)
Place of birth for the foreign-born population - Uganda (%)
Place of birth for the foreign-born population - Zimbabwe (%)
Place of birth for the foreign-born population - Other Eastern Africa (%)
Place of birth for the foreign-born population - Cameroon (%)
Place of birth for the foreign-born population - Congo (%)
Place of birth for the foreign-born population - Democratic Republic of Congo (Zaire) (%)
Place of birth for the foreign-born population - Other Middle Africa (%)
Place of birth for the foreign-born population - Egypt (%)
Place of birth for the foreign-born population - Morocco (%)
Place of birth for the foreign-born population - Sudan (%)
Place of birth for the foreign-born population - Other Northern Africa (%)
Place of birth for the foreign-born population - South Africa (%)
Place of birth for the foreign-born population - Other Southern Africa (%)
Place of birth for the foreign-born population - Cabo Verde (%)
Place of birth for the foreign-born population - Ghana (%)
Place of birth for the foreign-born population - Liberia (%)
Place of birth for the foreign-born population - Nigeria (%)
Place of birth for the foreign-born population - Senegal (%)
Place of birth for the foreign-born population - Sierra Leone (%)
Place of birth for the foreign-born population - Other Western Africa (%)
Place of birth for the foreign-born population - Australia (%)
Place of birth for the foreign-born population - New Zealand (%)
Place of birth for the foreign-born population - Fiji (%)
Place of birth for the foreign-born population - Micronesia (%)
Place of birth for the foreign-born population - Bahamas (%)
Place of birth for the foreign-born population - Barbados (%)
Place of birth for the foreign-born population - Cuba (%)
Place of birth for the foreign-born population - Dominica (%)
Place of birth for the foreign-born population - Dominican Republic (%)
Place of birth for the foreign-born population - Grenada (%)
Place of birth for the foreign-born population - Haiti (%)
Place of birth for the foreign-born population - Jamaica (%)
Place of birth for the foreign-born population - St. Vincent and the Grenadines (%)
Place of birth for the foreign-born population - Trinidad and Tobago (%)
Place of birth for the foreign-born population - West Indies (%)
Place of birth for the foreign-born population - Other Caribbean (%)
Place of birth for the foreign-born population - Belize (%)
Place of birth for the foreign-born population - Costa Rica (%)
Place of birth for the foreign-born population - El Salvador (%)
Place of birth for the foreign-born population - Guatemala (%)
Place of birth for the foreign-born population - Honduras (%)
Place of birth for the foreign-born population - Mexico (%)
Place of birth for the foreign-born population - Nicaragua (%)
Place of birth for the foreign-born population - Panama (%)
Place of birth for the foreign-born population - Other Central America (%)
Place of birth for the foreign-born population - Argentina (%)
Place of birth for the foreign-born population - Bolivia (%)
Place of birth for the foreign-born population - Brazil (%)
Place of birth for the foreign-born population - Chile (%)
Place of birth for the foreign-born population - Colombia (%)
Place of birth for the foreign-born population - Ecuador (%)
Place of birth for the foreign-born population - Guyana (%)
Place of birth for the foreign-born population - Peru (%)
Place of birth for the foreign-born population - Uruguay (%)
Place of birth for the foreign-born population - Venezuela (%)
Place of birth for the foreign-born population - Other South America (%)
Place of birth for the foreign-born population - Canada (%)
Place of birth for the foreign-born population - Other Northern America (%)
Place of birth for the foreign-born population - Other (%)
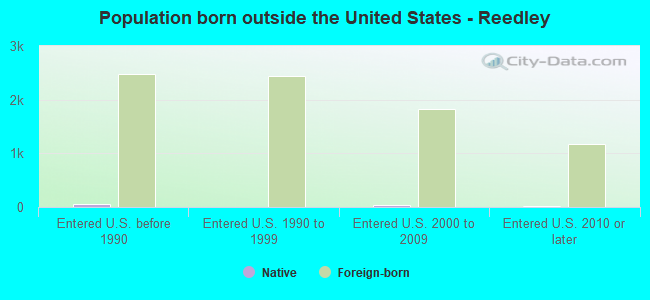
According to 2022 data, the most numerous races in Reedley, CA are Hispanic (20,894 residents), White alone (3,425 residents), and Asian alone (940 residents). 34.6% of Reedley residents speak English at home. 32.2% of Reedley, CA residents are foreign-born (29.3% born in Latin America), which is 19.2% greater than the foreign-born rate of 26.0% across the entire state of California.
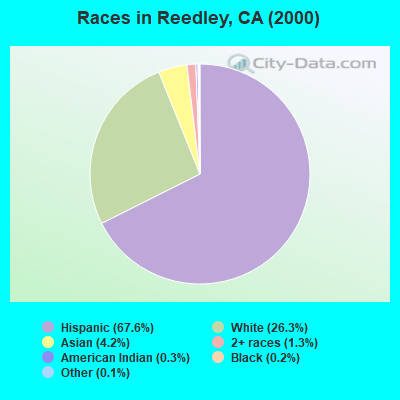
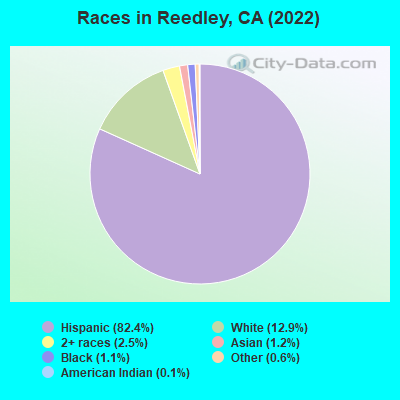
Race distribution in Reedley
2000 2022
15,816,790 46.7% White alone 10,966,556 32.4% Hispanic 3,648,860 10.8% Asian alone 2,181,926 6.4% Black alone 903,115 2.7% Two or more races 178,984 0.5% American Indian alone 103,736 0.3% Native Hawaiian and Other 71,681 0.2% Other race alone
15,732,184 40.3% Hispanic 13,160,426 33.7% White alone 5,957,867 15.3% Asian alone 2,025,218 5.2% Black alone 1,663,222 4.3% Two or more races 251,618 0.6% Other race alone 135,777 0.3% Native Hawaiian and Other 103,030 0.3% American Indian alone
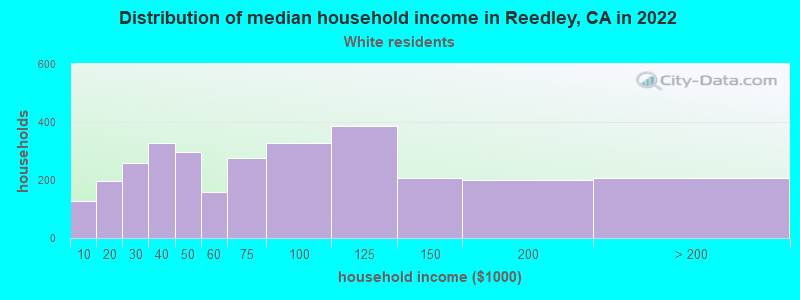
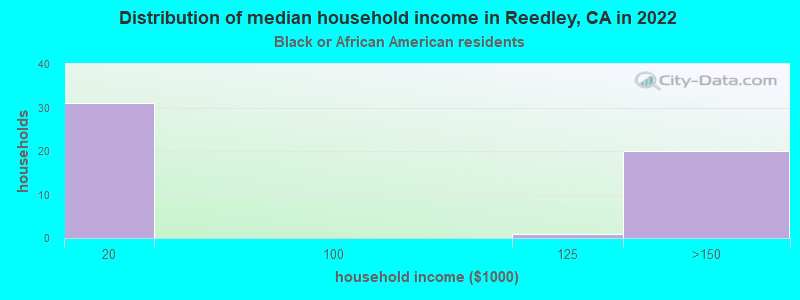
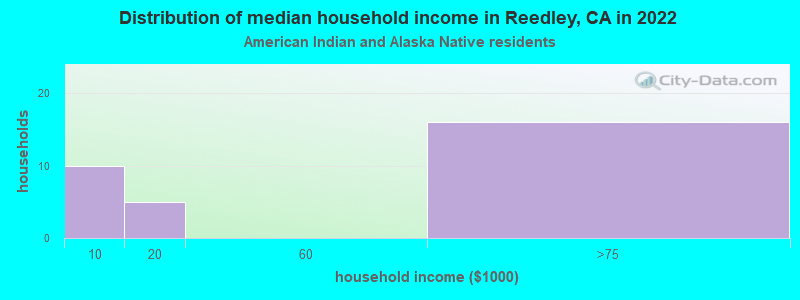
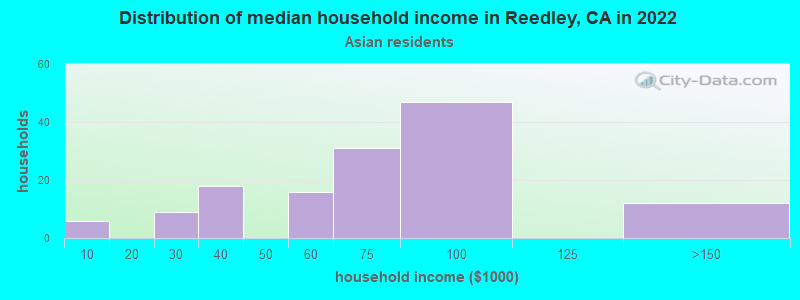
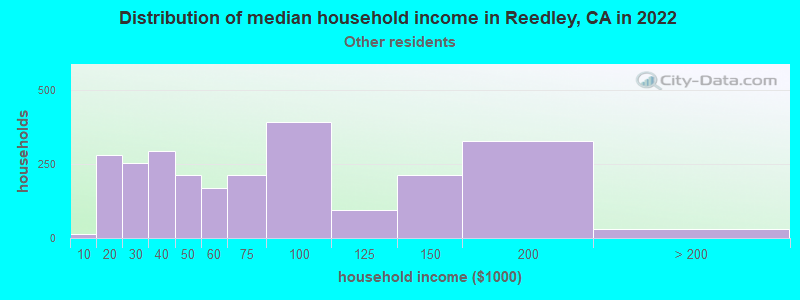
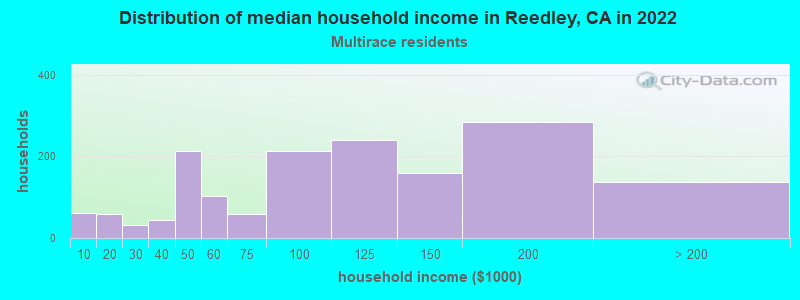
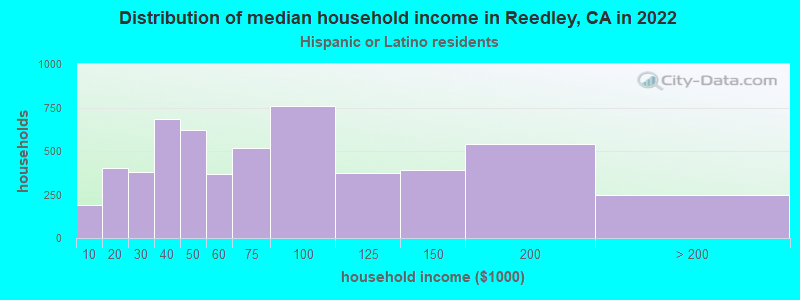
Income and house value in Reedley Median household income in 2022 $83,730 White non-Hispanic householders$145,806 Black householders$118,446 American Indian and Alaska Native householders$42,095 Asian householders$76,547 Some other race householders$119,433 Two or more races householders$62,329 Hispanic or Latino race householdersMedian 2022 house value $427,596 White Non-Hispanic householders$305,940 American Indian or Alaska Native householders $428,316 Asian householders$341,573 Some other race householders$344,812 Two or more races householders$332,934 Hispanic or Latino householders
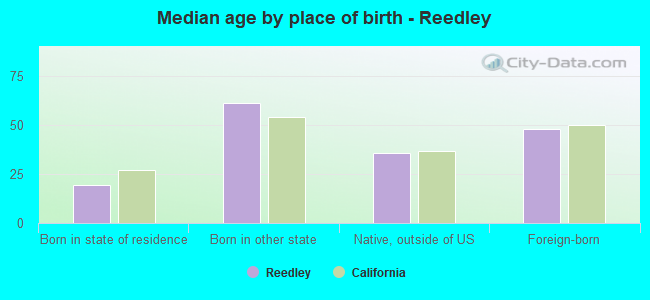
Median age by race in Reedley
33.3 Median age for White residents31.7 35.0 31.6 Median age for Black or African American residents34.6 30.1 28.7 Median age for American Indian / Alaska Native residents17.5 32.1 46.6 Median age for Asian residents41.3 55.2 40.1 Median age for Native Hawaiian / Pacific Islander residents37.7 Median age for Other race residents43.6 32.1 23.6 Median age for Two or more races residents22.7 22.5 62.8 Median age for White alone residents61.0 63.7 29.1 Median age for Hispanic or Latino residents27.9 29.8
Owner/renter occupied households by race in Reedley
House owners and renters - White residents 3,095 64.0% Owner occupied1,744 36.0% Renter occupiedHouse owners and renters - Black or African American residents 64 81.6% Owner occupied14 18.4% Renter occupiedHouse owners and renters - American Indian / Alaska Native residents 17 42.0% Owner occupied23 58.0% Renter occupiedHouse owners and renters - Asian residents 297 80.0% Owner occupied74 20.0% Renter occupiedHouse owners and renters - Other race residents 771 64.6% Owner occupied424 35.4% Renter occupiedHouse owners and renters - Two or more races residents 507 76.6% Owner occupied155 23.4% Renter occupiedHouse owners and renters - White alone residents 1,178 76.6% Owner occupied361 23.4% Renter occupiedHouse owners and renters - Hispanic or Latino residents 3,292 60.2% Owner occupied2,175 39.8% Renter occupied
Language usage in Reedley
English speakers - Total 34.6% of residents of Reedley speak English at home.
61.2% of residents speak Spanish at home 7,411 52.1% Speak English very well6,823 47.9% Speak English less than very well3.1% of residents speak other language at home 557 76.7% Speak English very well169 23.3% Speak English less than very well
English speakers - Born in the United States 68.4% of residents of Reedley speak English at home.
26.3% of residents speak Spanish at home 472 77.6% Speak English very well136 22.4% Speak English less than very well5.4% of residents speak other language at home 124 100.0% Speak English very well
English speakers - Native, born elsewhere 18.1% of residents of Reedley speak English at home.
57.2% of residents speak Spanish at home 55 69.6% Speak English very well24 30.4% Speak English less than very well23.9% of residents speak other language at home 33 100.0% Speak English very well
English speakers - Foreign-born 10.1% of residents of Reedley speak English at home.
81.1% of residents speak Spanish at home 1,395 21.0% Speak English very well5,248 79.0% Speak English less than very well6.1% of residents speak other language at home 334 66.5% Speak English very well168 33.5% Speak English less than very well
White (Caucasian) - Speak only English Native:
49.1% (4,729)Foreign-born:
5.8% (222)
White (Caucasian) - Speak another language Native:
41.6% (4,001)Foreign-born:
90.9% (3,456)
Black or African American - Speak only English Native:
87.2% (242)Foreign-born:
87.8% (14)
Black or African American - Speak another language Native:
15.4% (43)Foreign-born:
26.4% (4)
American Indian / Alaska Native - Speak only English Native:
41.0% (118)Foreign-born:
100.0% (31)
American Indian / Alaska Native - Speak another language Native:
58.3% (168)Foreign-born:
37.5% (12)
Asian - Speak only English Native:
96.3% (353)Foreign-born:
35.0% (179)
Asian - Speak another language Native:
11.9% (44)Foreign-born:
66.8% (343)
Other race - Speak only English Native:
27.0% (670)Foreign-born:
11.8% (212)
Other race - Speak another language Native:
73.5% (1,828)Foreign-born:
85.6% (1,539)
Two or more races - Speak only English Native:
67.2% (1,735)Foreign-born:
5.6% (23)
Two or more races - Speak another language Native:
26.8% (692)Foreign-born:
96.6% (400)
White alone - Speak only English Native:
92.9% (2,923)Foreign-born:
23.9% (51)
White alone - Speak another language Native:
7.4% (233)Foreign-born:
77.4% (165)
Hispanic or Latino - Speak only English Native:
29.4% (3,401)Foreign-born:
6.4% (449)
Hispanic or Latino - Speak another language Native:
70.3% (8,122)Foreign-born:
92.9% (6,502)
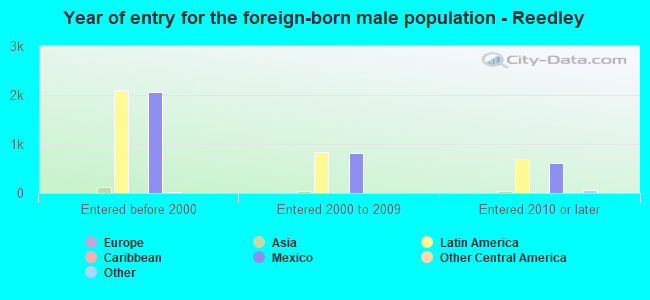
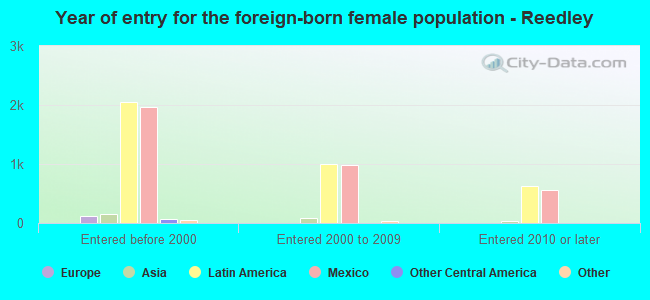
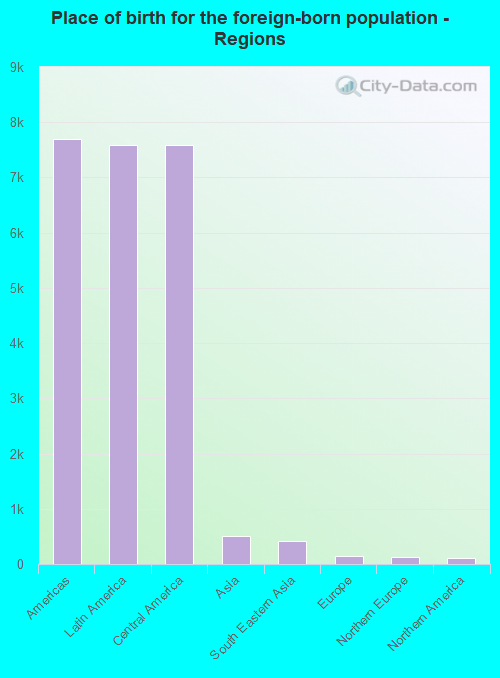
Foreign-born residents in Reedley 8,371 residents are foreign born (29.3% Latin America ).
This city:
32.2%California:
100.0%
Marital status for residents in Reedley Marital status - White (Caucasian) population 15 years and over
Males 34.8% Never married59.0% Now married0.2% Separated2.5% Widowed3.5% DivorcedFemales 28.2% Never married50.8% Now married3.3% Separated9.5% Widowed8.1% DivorcedWomen who gave birth in the past 12 months Now married:
36.7% (82)Unmarried:
63.3% (142)
Women who did not give birth in the past 12 months Now married:
54.9% (1,817)Unmarried:
45.1% (1,490)
Marital status - Black or African American population 15 years and over
Males 77.7% Never married22.3% Now married0.0% Separated0.0% Widowed0.0% DivorcedFemales 86.6% Never married13.4% Now married0.0% Separated0.0% Widowed0.0% DivorcedWomen who did not give birth in the past 12 months Now married:
0.0% (0)Unmarried:
100.0% (94)
Marital status - American Indian / Alaska Native population 15 years and over
Males 14.9% Never married81.9% Now married0.0% Separated0.0% Widowed3.2% DivorcedFemales 5.7% Never married71.4% Now married0.0% Separated0.0% Widowed22.9% DivorcedWomen who did not give birth in the past 12 months Now married:
82.0% (83)Unmarried:
18.0% (18)
Marital status - Asian population 15 years and over
Males 47.3% Never married49.0% Now married0.0% Separated0.0% Widowed3.7% DivorcedFemales 41.0% Never married38.6% Now married0.0% Separated14.7% Widowed5.7% DivorcedWomen who did not give birth in the past 12 months Now married:
26.3% (37)Unmarried:
73.7% (104)
Marital status - Native Hawaiian / Pacific Islander population 15 years and over
Males 100.0% Never married0.0% Now married0.0% Separated0.0% Widowed0.0% DivorcedFemales 0.0% Never married100.0% Now married0.0% Separated0.0% Widowed0.0% DivorcedWomen who did not give birth in the past 12 months Now married:
100.0% (14)Unmarried:
0.0% (0)
Marital status - Other race population 15 years and over
Males 40.6% Never married47.5% Now married0.0% Separated0.4% Widowed11.5% DivorcedFemales 40.8% Never married44.0% Now married0.6% Separated9.5% Widowed5.0% DivorcedWomen who gave birth in the past 12 months Now married:
59.6% (37)Unmarried:
40.4% (25)
Women who did not give birth in the past 12 months Now married:
39.1% (458)Unmarried:
60.9% (714)
Marital status - Two or more races population 15 years and over
Males 49.3% Never married37.2% Now married0.0% Separated2.0% Widowed11.5% DivorcedFemales 41.6% Never married49.3% Now married0.0% Separated0.0% Widowed9.1% DivorcedWomen who did not give birth in the past 12 months Now married:
40.2% (240)Unmarried:
59.8% (358)
Marital status - White alone, not Hispanic / Latino population 15 years and over
Males 26.8% Never married57.1% Now married0.0% Separated8.1% Widowed8.0% DivorcedFemales 10.7% Never married54.4% Now married0.0% Separated23.9% Widowed11.1% DivorcedWomen who gave birth in the past 12 months Now married:
100.0% (23)Unmarried:
0.0% (0)
Women who did not give birth in the past 12 months Now married:
63.0% (182)Unmarried:
37.0% (107)
Marital status - Hispanic or Latino population 15 years and over
Males 38.9% Never married56.6% Now married0.2% Separated0.5% Widowed3.8% DivorcedFemales 35.4% Never married48.4% Now married3.5% Separated5.9% Widowed6.7% DivorcedWomen who gave birth in the past 12 months Now married:
35.5% (115)Unmarried:
64.5% (210)
Women who did not give birth in the past 12 months Now married:
51.0% (2,678)Unmarried:
49.0% (2,575)
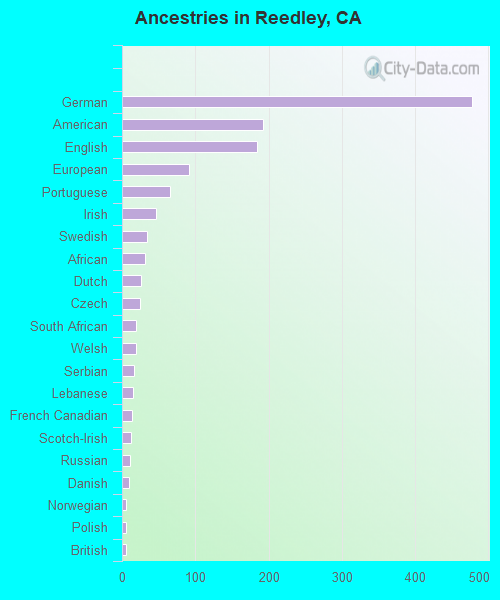
Ancestries in Reedley
594 3.0% German201 1.0% European184 0.9% Finnish180 0.9% American62 0.3% Norwegian56 0.3% English50 0.3% Irish49 0.2% Portuguese34 0.2% Pennsylvania German26 0.1% Danish25 0.1% Scotch-Irish18 0.09% Dutch14 0.07% Swiss10 0.05% Czechoslovakian9 0.05% Italian9 0.05% Scottish7 0.04% Polish6 0.03% French Canadian6 0.03% Haitian5 0.03% Serbian4 0.02% Lebanese4 0.02% Armenian4 0.02% Austrian4 0.02% British4 0.02% Swedish3 0.02% French
Children Nativity (place of birth) in Reedley
Children under 6 years - Living with two parents Both parents native 459 100.0% NativeBoth parents foreign-born 677 100.0% NativeOne native, one foreign-born parent 368 100.0% NativeChildren under 6 years - Living with one parent Native parent 621 96.4% Native23 3.6% Foreign-bornForeign-born parent 242 100.0% NativeChildren 6 to 17 years - Living with two parents Both parents native 1,128 100.0% Native1 0.0% Foreign-bornBoth parents foreign-born 1,476 91.0% Native145 9.0% Foreign-bornOne native, one foreign-born parent 842 100.0% NativeChildren 6 to 17 years - Living with one parent Native parent 452 100.0% NativeForeign-born parent 814 50.1% Native811 49.9% Foreign-born
Grandparents responsible for own grandchildren in Reedley
Grandparents (30 to 59 years) White / Caucasian 85 34.6% Responsible for grandchildren161 65.4% Not responsible for grandchildrenOther race 2 1.9% Responsible for grandchildren125 98.1% Not responsible for grandchildrenWhite alone, not Hispanic / Latino 38 100.0% Not responsible for grandchildrenHispanic or Latino 153 32.4% Responsible for grandchildren319 67.6% Not responsible for grandchildrenGrandparents (60 years and over) White / Caucasian 25 8.1% Responsible for grandchildren285 91.9% Not responsible for grandchildrenOther race 52 26.9% Responsible for grandchildren143 73.1% Not responsible for grandchildrenWhite alone, not Hispanic / Latino 4 11.0% Responsible for grandchildren36 89.0% Not responsible for grandchildrenHispanic or Latino 76 14.4% Responsible for grandchildren454 85.6% Not responsible for grandchildren