Races in Reidsville, North Carolina (NC) Detailed Stats
Data:
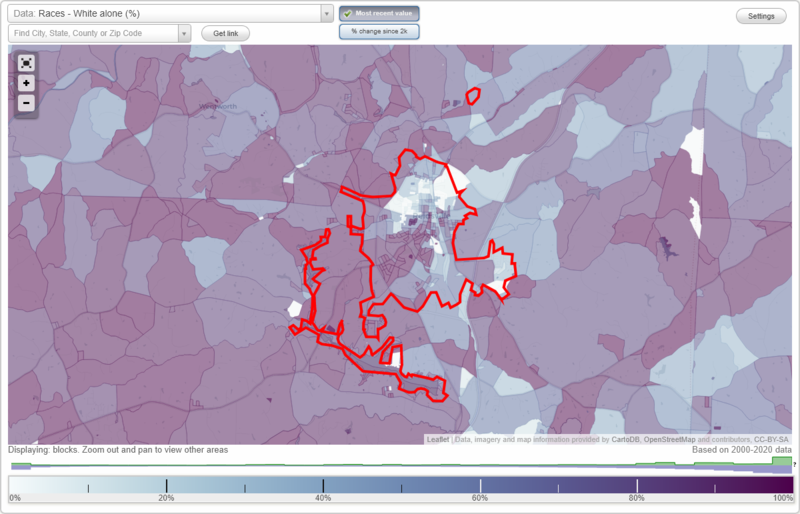
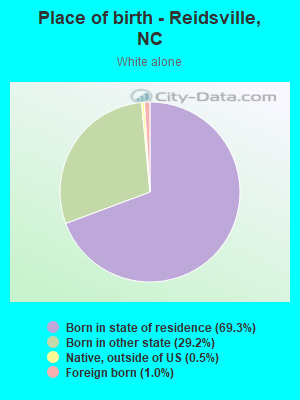
Races - White alone (%)
Races - White alone (% change since 2000)
Races - Black alone (%)
Races - Black alone (% change since 2000)
Races - American Indian alone (%)
Races - American Indian alone (% change since 2000)
Races - Asian alone (%)
Races - Asian alone (% change since 2000)
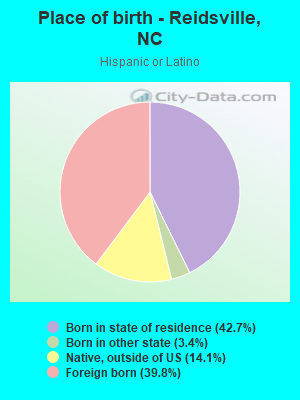
Races - Hispanic (%)
Races - Hispanic (% change since 2000)
Races - Native Hawaiian and Other Pacific Islander alone (%)
Races - Native Hawaiian and Other Pacific Islander alone (% change since 2000)
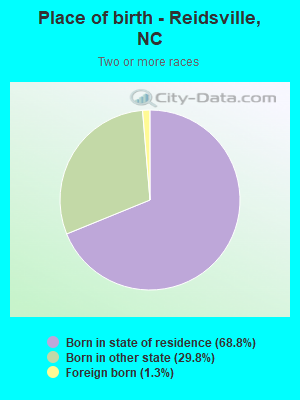
Races - Two or more races(%)
Races - Two or more races(% change since 2000)
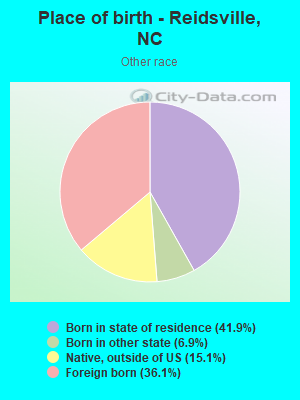
Races - Other race alone (%)
Races - Other race alone (% change since 2000)
Racial diversity
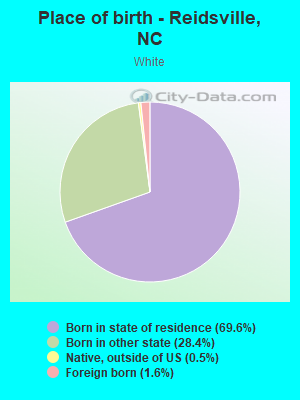
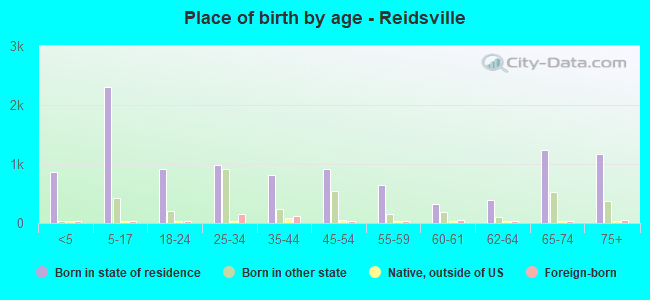
Place of birth - Born in state of residence (%)
Place of birth - Born in state of residence (%) - White
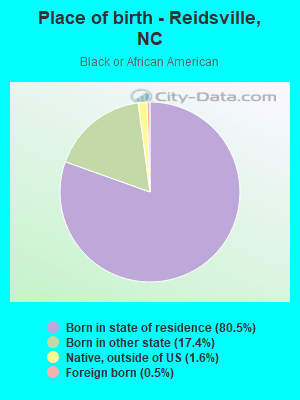
Place of birth - Born in state of residence (%) - Black or African American
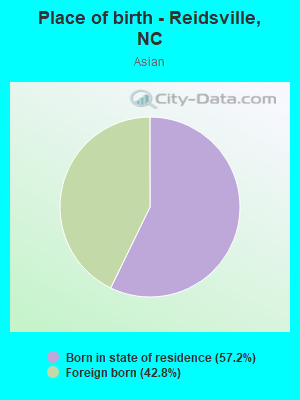
Place of birth - Born in state of residence (%) - Asian
Place of birth - Born in state of residence (%) - Hispanic or Latino
Place of birth - Born in state of residence (%) - American Indian and Alaska Native
Place of birth - Born in state of residence (%) - Multirace
Place of birth - Born in state of residence (%) - Other Race
Place of birth - Born in other state (%)
Place of birth - Born in other state (%) - White
Place of birth - Born in other state (%) - Black or African American
Place of birth - Born in other state (%) - Asian
Place of birth - Born in other state (%) - Hispanic or Latino
Place of birth - Born in other state (%) - American Indian and Alaska Native
Place of birth - Born in other state (%) - Multirace
Place of birth - Born in other state (%) - Other Race
Place of birth - Native, outside of US (%)
Place of birth - Native, outside of US (%) - White
Place of birth - Native, outside of US (%) - Black or African American
Place of birth - Native, outside of US (%) - Asian
Place of birth - Native, outside of US (%) - Hispanic or Latino
Place of birth - Native, outside of US (%) - American Indian and Alaska Native
Place of birth - Native, outside of US (%) - Multirace
Place of birth - Native, outside of US (%) - Other Race
Place of birth - Foreign born (%)
Place of birth - Foreign born (%) - White
Place of birth - Foreign born (%) - Black or African American
Place of birth - Foreign born (%) - Asian
Place of birth - Foreign born (%) - Hispanic or Latino
Place of birth - Foreign born (%) - American Indian and Alaska Native
Place of birth - Foreign born (%) - Multirace
Place of birth - Foreign born (%) - Other Race
Residents speaking English at home (%)
Residents speaking English at home - Born in the United States (%)
Residents speaking English at home - Native, born elsewhere (%)
Residents speaking English at home - Foreign born (%)
Residents speaking Spanish at home (%)
Residents speaking Spanish at home - Born in the United States (%)
Residents speaking Spanish at home - Native, born elsewhere (%)
Residents speaking Spanish at home - Foreign born (%)
Residents speaking other language at home (%)
Residents speaking other language at home - Born in the United States (%)
Residents speaking other language at home - Native, born elsewhere (%)
Residents speaking other language at home - Foreign born (%)
Marital status - Never married (%)
Marital status - Now married (%)
Marital status - Separated (%)
Marital status - Widowed (%)
Marital status - Divorced (%)
Ancestries Reported - Arab (%)
Ancestries Reported - Czech (%)
Ancestries Reported - Danish (%)
Ancestries Reported - Dutch (%)
Ancestries Reported - English (%)
Ancestries Reported - French (%)
Ancestries Reported - French Canadian (%)
Ancestries Reported - German (%)
Ancestries Reported - Greek (%)
Ancestries Reported - Hungarian (%)
Ancestries Reported - Irish (%)
Ancestries Reported - Italian (%)
Ancestries Reported - Lithuanian (%)
Ancestries Reported - Norwegian (%)
Ancestries Reported - Polish (%)
Ancestries Reported - Portuguese (%)
Ancestries Reported - Russian (%)
Ancestries Reported - Scotch-Irish (%)
Ancestries Reported - Scottish (%)
Ancestries Reported - Slovak (%)
Ancestries Reported - Subsaharan African (%)
Ancestries Reported - Swedish (%)
Ancestries Reported - Swiss (%)
Ancestries Reported - Ukrainian (%)
Ancestries Reported - United States (%)
Ancestries Reported - Welsh (%)
Ancestries Reported - West Indian (%)
Ancestries Reported - Other (%)
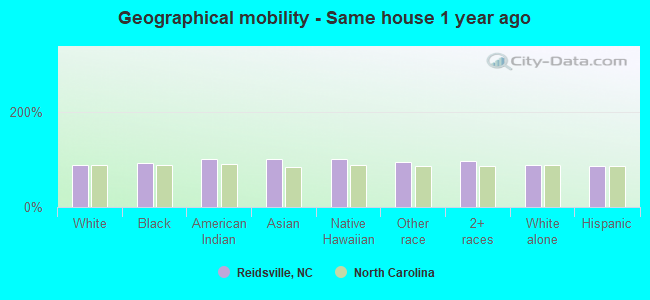
Geographical mobility - Same house 1 year ago (%)
Geographical mobility - Same house 1 year ago (%) - White
Geographical mobility - Same house 1 year ago (%) - Black or African American
Geographical mobility - Same house 1 year ago (%) - Asian
Geographical mobility - Same house 1 year ago (%) - Hispanic or Latino
Geographical mobility - Same house 1 year ago (%) - American Indian and Alaska Native
Geographical mobility - Same house 1 year ago (%) - Multirace
Geographical mobility - Same house 1 year ago (%) - Other Race
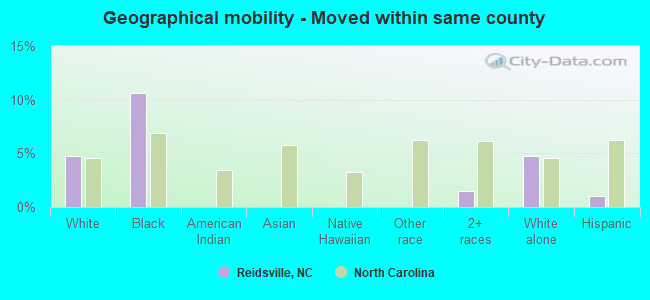
Geographical mobility - Moved within same county (%)
Geographical mobility - Moved within same county (%) - White
Geographical mobility - Moved within same county (%) - Black or African American
Geographical mobility - Moved within same county (%) - Asian
Geographical mobility - Moved within same county (%) - Hispanic or Latino
Geographical mobility - Moved within same county (%) - American Indian and Alaska Native
Geographical mobility - Moved within same county (%) - Multirace
Geographical mobility - Moved within same county (%) - Other Race
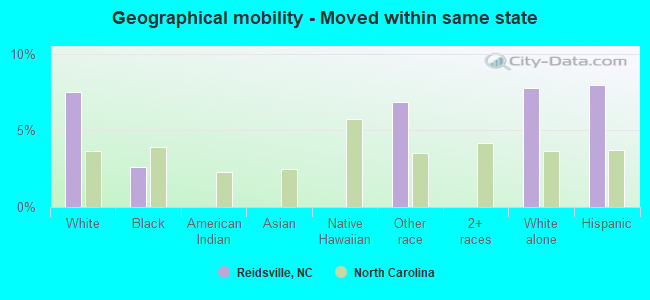
Geographical mobility - Moved from different county within same state (%)
Geographical mobility - Moved from different county within same state (%) - White
Geographical mobility - Moved from different county within same state (%) - Black or African American
Geographical mobility - Moved from different county within same state (%) - Asian
Geographical mobility - Moved from different county within same state (%) - Hispanic or Latino
Geographical mobility - Moved from different county within same state (%) - American Indian and Alaska Native
Geographical mobility - Moved from different county within same state (%) - Multirace
Geographical mobility - Moved from different county within same state (%) - Other Race
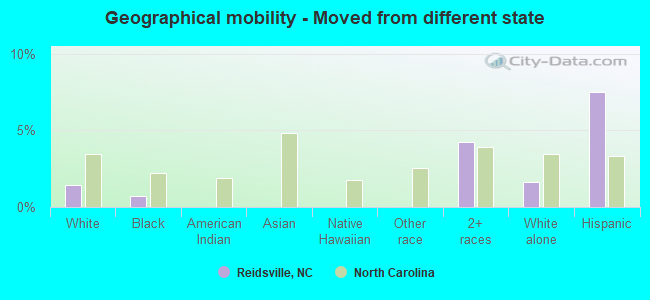
Geographical mobility - Moved from different state (%)
Geographical mobility - Moved from different state (%) - White
Geographical mobility - Moved from different state (%) - Black or African American
Geographical mobility - Moved from different state (%) - Asian
Geographical mobility - Moved from different state (%) - Hispanic or Latino
Geographical mobility - Moved from different state (%) - American Indian and Alaska Native
Geographical mobility - Moved from different state (%) - Multirace
Geographical mobility - Moved from different state (%) - Other Race
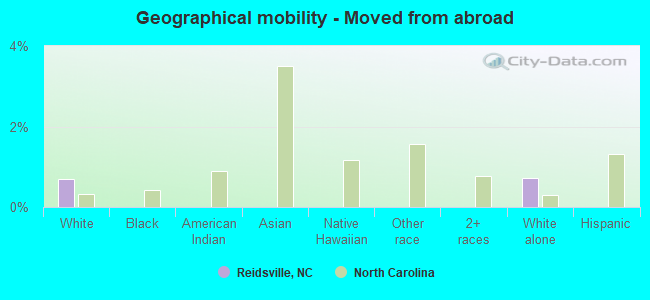
Geographical mobility - Moved from abroad (%)
Geographical mobility - Moved from abroad (%) - White
Geographical mobility - Moved from abroad (%) - Black or African American
Geographical mobility - Moved from abroad (%) - Asian
Geographical mobility - Moved from abroad (%) - Hispanic or Latino
Geographical mobility - Moved from abroad (%) - American Indian and Alaska Native
Geographical mobility - Moved from abroad (%) - Multirace
Geographical mobility - Moved from abroad (%) - Other Race
Place of birth for the foreign-born population - Ireland (%)
Place of birth for the foreign-born population - Denmark (%)
Place of birth for the foreign-born population - Norway (%)
Place of birth for the foreign-born population - Sweden (%)
Place of birth for the foreign-born population - United Kingdom (%)
Place of birth for the foreign-born population - England (%)
Place of birth for the foreign-born population - Scotland (%)
Place of birth for the foreign-born population - Other Northern Europe (%)
Place of birth for the foreign-born population - Austria (%)
Place of birth for the foreign-born population - Belgium (%)
Place of birth for the foreign-born population - France (%)
Place of birth for the foreign-born population - Germany (%)
Place of birth for the foreign-born population - Netherlands (%)
Place of birth for the foreign-born population - Switzerland (%)
Place of birth for the foreign-born population - Other Western Europe (%)
Place of birth for the foreign-born population - Greece (%)
Place of birth for the foreign-born population - Italy (%)
Place of birth for the foreign-born population - Portugal (%)
Place of birth for the foreign-born population - Spain (%)
Place of birth for the foreign-born population - Other Southern Europe (%)
Place of birth for the foreign-born population - Albania (%)
Place of birth for the foreign-born population - Belarus (%)
Place of birth for the foreign-born population - Bosnia and Herzegovina (%)
Place of birth for the foreign-born population - Bulgaria (%)
Place of birth for the foreign-born population - Croatia (%)
Place of birth for the foreign-born population - Czechoslovakia (%)
Place of birth for the foreign-born population - Hungary (%)
Place of birth for the foreign-born population - Latvia (%)
Place of birth for the foreign-born population - Lithuania (%)
Place of birth for the foreign-born population - North Macedonia (Macedonia) (%)
Place of birth for the foreign-born population - Moldova (%)
Place of birth for the foreign-born population - Poland (%)
Place of birth for the foreign-born population - Romania (%)
Place of birth for the foreign-born population - Russia (%)
Place of birth for the foreign-born population - Serbia (%)
Place of birth for the foreign-born population - Ukraine (%)
Place of birth for the foreign-born population - Other Eastern Europe (%)
Place of birth for the foreign-born population - China (%)
Place of birth for the foreign-born population - Hong Kong (%)
Place of birth for the foreign-born population - Taiwan (%)
Place of birth for the foreign-born population - Japan (%)
Place of birth for the foreign-born population - Korea (%)
Place of birth for the foreign-born population - Other Eastern Asia (%)
Place of birth for the foreign-born population - Afghanistan (%)
Place of birth for the foreign-born population - Bangladesh (%)
Place of birth for the foreign-born population - India (%)
Place of birth for the foreign-born population - Iran (%)
Place of birth for the foreign-born population - Kazakhstan (%)
Place of birth for the foreign-born population - Nepal (%)
Place of birth for the foreign-born population - Pakistan (%)
Place of birth for the foreign-born population - Sri Lanka (%)
Place of birth for the foreign-born population - Uzbekistan (%)
Place of birth for the foreign-born population - Other South Central Asia (%)
Place of birth for the foreign-born population - Burma (%)
Place of birth for the foreign-born population - Cambodia (%)
Place of birth for the foreign-born population - Indonesia (%)
Place of birth for the foreign-born population - Laos (%)
Place of birth for the foreign-born population - Malaysia (%)
Place of birth for the foreign-born population - Philippines (%)
Place of birth for the foreign-born population - Singapore (%)
Place of birth for the foreign-born population - Thailand (%)
Place of birth for the foreign-born population - Vietnam (%)
Place of birth for the foreign-born population - Other South Eastern Asia (%)
Place of birth for the foreign-born population - Armenia (%)
Place of birth for the foreign-born population - Iraq (%)
Place of birth for the foreign-born population - Israel (%)
Place of birth for the foreign-born population - Jordan (%)
Place of birth for the foreign-born population - Kuwait (%)
Place of birth for the foreign-born population - Lebanon (%)
Place of birth for the foreign-born population - Saudi Arabia (%)
Place of birth for the foreign-born population - Syria (%)
Place of birth for the foreign-born population - Turkey (%)
Place of birth for the foreign-born population - Yemen (%)
Place of birth for the foreign-born population - Other Western Asia (%)
Place of birth for the foreign-born population - Eritrea (%)
Place of birth for the foreign-born population - Ethiopia (%)
Place of birth for the foreign-born population - Kenya (%)
Place of birth for the foreign-born population - Somalia (%)
Place of birth for the foreign-born population - Uganda (%)
Place of birth for the foreign-born population - Zimbabwe (%)
Place of birth for the foreign-born population - Other Eastern Africa (%)
Place of birth for the foreign-born population - Cameroon (%)
Place of birth for the foreign-born population - Congo (%)
Place of birth for the foreign-born population - Democratic Republic of Congo (Zaire) (%)
Place of birth for the foreign-born population - Other Middle Africa (%)
Place of birth for the foreign-born population - Egypt (%)
Place of birth for the foreign-born population - Morocco (%)
Place of birth for the foreign-born population - Sudan (%)
Place of birth for the foreign-born population - Other Northern Africa (%)
Place of birth for the foreign-born population - South Africa (%)
Place of birth for the foreign-born population - Other Southern Africa (%)
Place of birth for the foreign-born population - Cabo Verde (%)
Place of birth for the foreign-born population - Ghana (%)
Place of birth for the foreign-born population - Liberia (%)
Place of birth for the foreign-born population - Nigeria (%)
Place of birth for the foreign-born population - Senegal (%)
Place of birth for the foreign-born population - Sierra Leone (%)
Place of birth for the foreign-born population - Other Western Africa (%)
Place of birth for the foreign-born population - Australia (%)
Place of birth for the foreign-born population - New Zealand (%)
Place of birth for the foreign-born population - Fiji (%)
Place of birth for the foreign-born population - Micronesia (%)
Place of birth for the foreign-born population - Bahamas (%)
Place of birth for the foreign-born population - Barbados (%)
Place of birth for the foreign-born population - Cuba (%)
Place of birth for the foreign-born population - Dominica (%)
Place of birth for the foreign-born population - Dominican Republic (%)
Place of birth for the foreign-born population - Grenada (%)
Place of birth for the foreign-born population - Haiti (%)
Place of birth for the foreign-born population - Jamaica (%)
Place of birth for the foreign-born population - St. Vincent and the Grenadines (%)
Place of birth for the foreign-born population - Trinidad and Tobago (%)
Place of birth for the foreign-born population - West Indies (%)
Place of birth for the foreign-born population - Other Caribbean (%)
Place of birth for the foreign-born population - Belize (%)
Place of birth for the foreign-born population - Costa Rica (%)
Place of birth for the foreign-born population - El Salvador (%)
Place of birth for the foreign-born population - Guatemala (%)
Place of birth for the foreign-born population - Honduras (%)
Place of birth for the foreign-born population - Mexico (%)
Place of birth for the foreign-born population - Nicaragua (%)
Place of birth for the foreign-born population - Panama (%)
Place of birth for the foreign-born population - Other Central America (%)
Place of birth for the foreign-born population - Argentina (%)
Place of birth for the foreign-born population - Bolivia (%)
Place of birth for the foreign-born population - Brazil (%)
Place of birth for the foreign-born population - Chile (%)
Place of birth for the foreign-born population - Colombia (%)
Place of birth for the foreign-born population - Ecuador (%)
Place of birth for the foreign-born population - Guyana (%)
Place of birth for the foreign-born population - Peru (%)
Place of birth for the foreign-born population - Uruguay (%)
Place of birth for the foreign-born population - Venezuela (%)
Place of birth for the foreign-born population - Other South America (%)
Place of birth for the foreign-born population - Canada (%)
Place of birth for the foreign-born population - Other Northern America (%)
Place of birth for the foreign-born population - Other (%)
Latest news about races in Reidsville, NC collected exclusively by city-data.com from local newspapers, TV, and radio stations
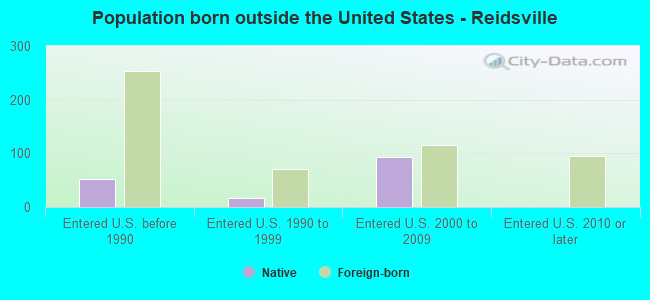
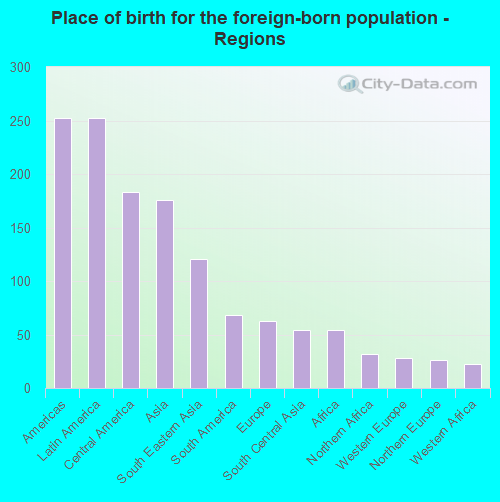
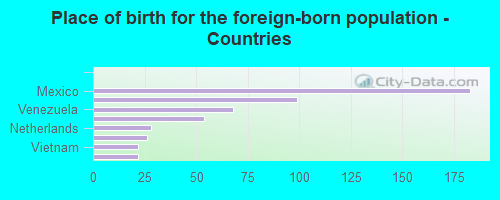
According to 2022 data, the most numerous races in Reidsville, NC are White alone (7,321 residents), Black alone (5,355 residents), and Hispanic (581 residents). 94.6% of Reidsville residents speak English at home. 3.7% of Reidsville, NC residents are foreign-born (1.6% born in Latin America, 1.1% born in Asia, 0.4% born in Europe), which is 114.2% less than the foreign-born rate of 8.0% across the entire state of North Carolina.
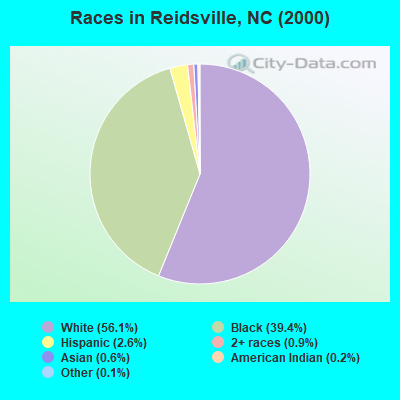
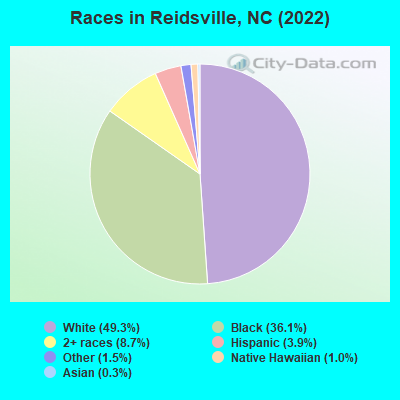
Race distribution in Reidsville
2000 2022
5,647,155 70.2% White alone 1,723,301 21.4% Black alone 378,963 4.7% Hispanic 112,416 1.4% Asian alone 95,333 1.2% American Indian alone 79,965 1.0% Two or more races 9,015 0.1% Other race alone 3,165 0.04% Native Hawaiian and Other
6,497,519 60.7% White alone 2,155,650 20.1% Black alone 1,114,799 10.4% Hispanic 438,061 4.1% Two or more races 341,052 3.2% Asian alone 91,758 0.9% American Indian alone 50,180 0.5% Other race alone 9,954 0.09% Native Hawaiian and Other
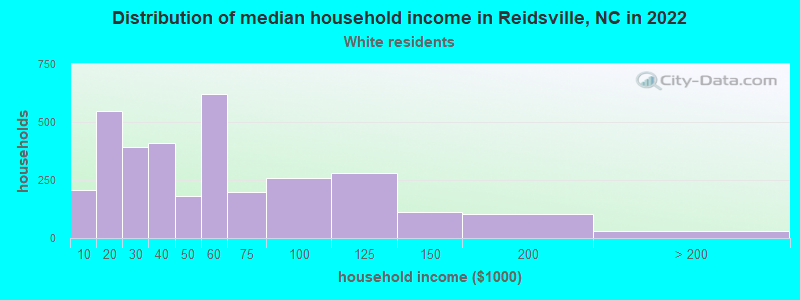
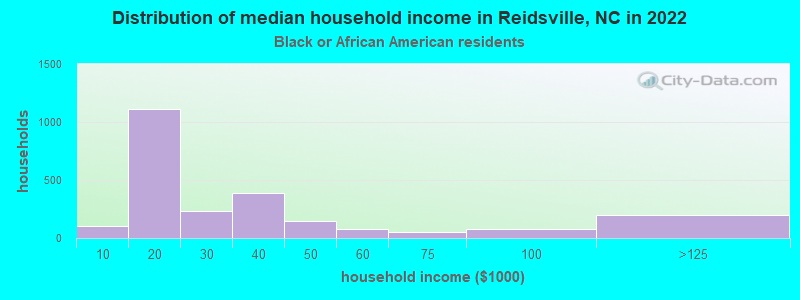
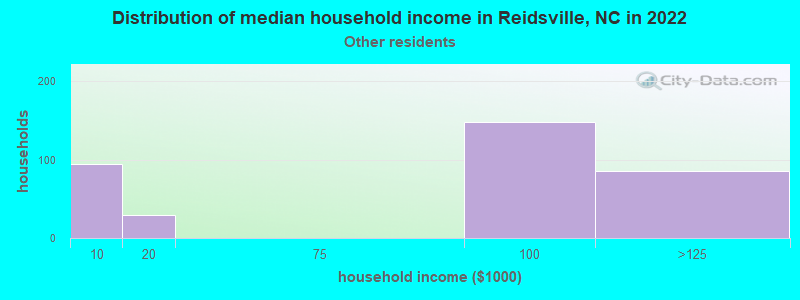
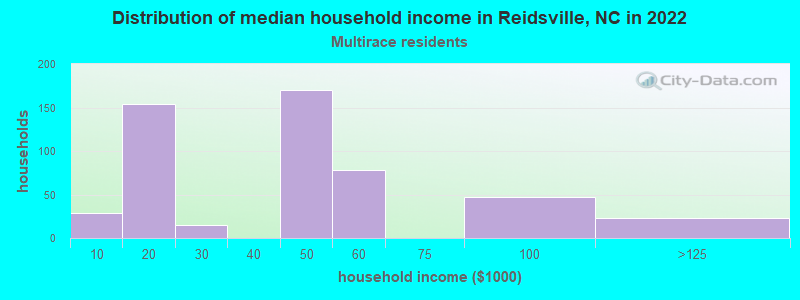
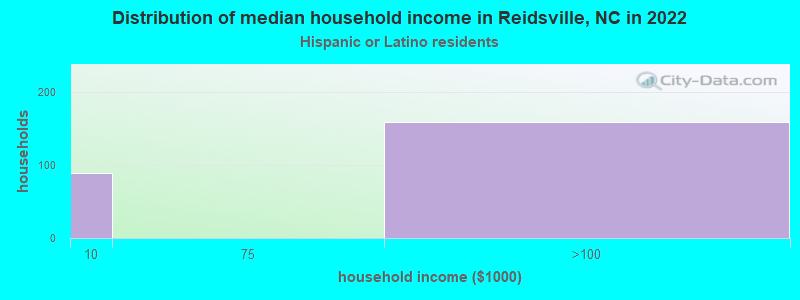
Income and house value in Reidsville Median household income in 2022 $43,701 White non-Hispanic householders$22,077 Black householders$83,551 Some other race householders$52,364 Two or more races householders$109,675 Hispanic or Latino race householdersMedian 2022 house value $171,268 White Non-Hispanic householders$113,041 Black or African American householders$180,182 Some other race householders$136,938 Two or more races householders$180,182 Hispanic or Latino householders
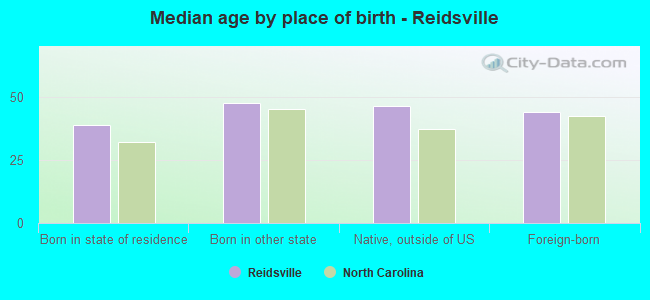
Median age by race in Reidsville
50.8 Median age for White residents47.2 52.6 46.8 Median age for Black or African American residents35.9 51.3 -923,220,972.9 Median age for American Indian / Alaska Native residents-852,216,747.9 -1,029,350,103.8 -685,606,059.9 Median age for Asian residents-682,080,924.2 -689,075,629.6 -609,884,331.7 Median age for Native Hawaiian / Pacific Islander residents-666,666,666.0 -612,403,100.2 50.1 Median age for Other race residents37.8 51.8 18.6 Median age for Two or more races residents14.7 16.8 51.1 Median age for White alone residents47.4 52.2 28.8 Median age for Hispanic or Latino residents21.4 56.0
Owner/renter occupied households by race in Reidsville
House owners and renters - White residents 2,052 62.9% Owner occupied1,211 37.1% Renter occupiedHouse owners and renters - Black or African American residents 889 39.1% Owner occupied1,387 60.9% Renter occupiedHouse owners and renters - Native Hawaiian / Pacific Islander residents 140 100.0% Owner occupiedHouse owners and renters - Other race residents 124 35.2% Owner occupied230 64.8% Renter occupiedHouse owners and renters - Two or more races residents 147 24.0% Owner occupied465 76.0% Renter occupiedHouse owners and renters - White alone residents 2,059 62.6% Owner occupied1,230 37.4% Renter occupiedHouse owners and renters - Hispanic or Latino residents 152 53.9% Owner occupied130 46.1% Renter occupied
Language usage in Reidsville
English speakers - Total 94.6% of residents of Reidsville speak English at home.
3.8% of residents speak Spanish at home 347 65.3% Speak English very well184 34.7% Speak English less than very well1.2% of residents speak other language at home 53 32.7% Speak English very well109 67.3% Speak English less than very well
English speakers - Born in the United States 97.5% of residents of Reidsville speak English at home.
2.3% of residents speak Spanish at home 83 100.0% Speak English very well
English speakers - Native, born elsewhere 43.4% of residents of Reidsville speak English at home.
52.0% of residents speak Spanish at home 90 100.0% Speak English very well
English speakers - Foreign-born 32.8% of residents of Reidsville speak English at home.
44.3% of residents speak Spanish at home 64 26.4% Speak English very well178 73.6% Speak English less than very well22.0% of residents speak other language at home 31 25.8% Speak English very well89 74.2% Speak English less than very well
White (Caucasian) - Speak only English Native:
100.0% (6,690)Foreign-born:
51.6% (53)
White (Caucasian) - Speak another language Native:
0.5% (33)Foreign-born:
53.1% (55)
Black or African American - Speak only English Native:
99.1% (5,110)Foreign-born:
100.0% (23)
Other race - Speak another language Native:
60.0% (236)Foreign-born:
100.0% (285)
Two or more races - Speak another language Native:
4.7% (48)Foreign-born:
100.0% (19)
White alone - Speak only English Native:
99.2% (6,716)Foreign-born:
36.4% (55)
White alone - Speak another language Native:
0.7% (49)Foreign-born:
63.6% (97)
Hispanic or Latino - Speak another language Native:
64.7% (211)Foreign-born:
100.0% (254)
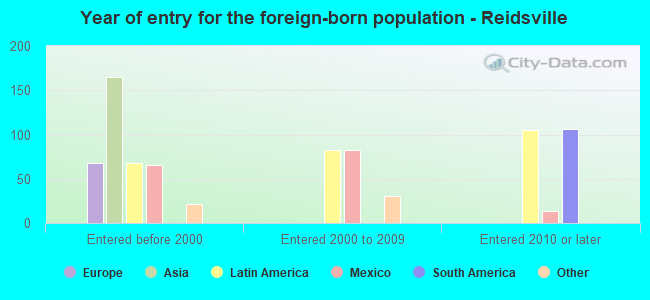
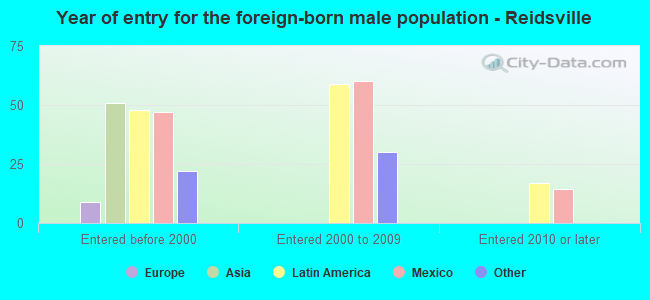
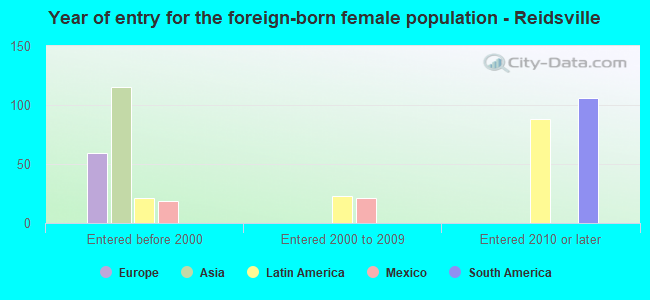
Foreign-born residents in Reidsville 547 residents are foreign born (1.6% Latin America , 1.1% Asia , 0.4% Europe ).
This city:
3.7%North Carolina:
8.3%
Marital status for residents in Reidsville Marital status - White (Caucasian) population 15 years and over
Males 23.2% Never married57.3% Now married0.4% Separated4.1% Widowed15.1% DivorcedFemales 15.8% Never married42.0% Now married6.8% Separated12.3% Widowed23.1% DivorcedWomen who gave birth in the past 12 months Now married:
82.1% (89)Unmarried:
17.9% (19)
Women who did not give birth in the past 12 months Now married:
48.0% (585)Unmarried:
52.0% (634)
Marital status - Black or African American population 15 years and over
Males 51.8% Never married18.6% Now married8.1% Separated3.6% Widowed17.8% DivorcedFemales 40.8% Never married17.1% Now married4.8% Separated15.0% Widowed22.3% DivorcedWomen who did not give birth in the past 12 months Now married:
21.9% (324)Unmarried:
78.1% (1,159)
Marital status - Asian population 15 years and over
Males 100.0% Never married0.0% Now married0.0% Separated0.0% Widowed0.0% DivorcedFemales 0.0% Never married100.0% Now married0.0% Separated0.0% Widowed0.0% DivorcedMarital status - Other race population 15 years and over
Males 45.3% Never married54.7% Now married0.0% Separated0.0% Widowed0.0% DivorcedFemales 0.0% Never married58.7% Now married11.6% Separated0.0% Widowed29.6% DivorcedWomen who did not give birth in the past 12 months Now married:
100.0% (152)Unmarried:
0.0% (0)
Marital status - Two or more races population 15 years and over
Males 53.0% Never married2.7% Now married0.0% Separated35.2% Widowed9.1% DivorcedFemales 87.0% Never married0.6% Now married0.0% Separated12.4% Widowed0.0% DivorcedWomen who did not give birth in the past 12 months Now married:
0.7% (3)Unmarried:
99.3% (372)
Marital status - White alone, not Hispanic / Latino population 15 years and over
Males 23.2% Never married57.3% Now married0.4% Separated4.1% Widowed15.1% DivorcedFemales 15.4% Never married42.2% Now married6.9% Separated12.4% Widowed23.2% DivorcedWomen who gave birth in the past 12 months Now married:
82.1% (89)Unmarried:
17.9% (19)
Women who did not give birth in the past 12 months Now married:
48.7% (586)Unmarried:
51.3% (618)
Marital status - Hispanic or Latino population 15 years and over
Males 51.3% Never married48.7% Now married0.0% Separated0.0% Widowed0.0% DivorcedFemales 13.3% Never married86.7% Now married0.0% Separated0.0% Widowed0.0% DivorcedWomen who did not give birth in the past 12 months Now married:
86.7% (120)Unmarried:
13.3% (18)
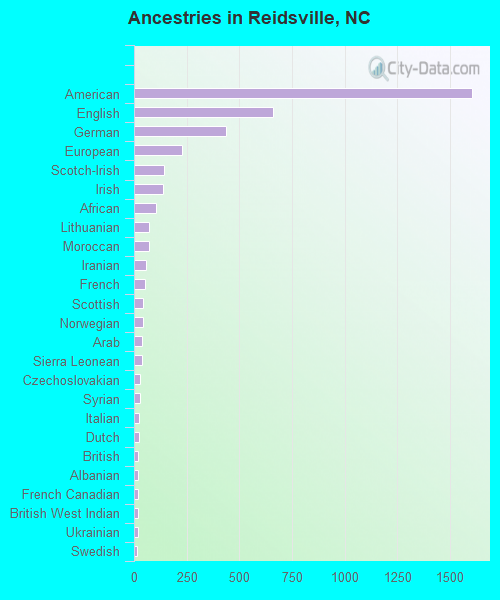
Ancestries in Reidsville
1,606 17.2% American660 7.1% English439 4.7% German226 2.4% European141 1.5% Scotch-Irish137 1.5% Irish106 1.1% African71 0.8% Lithuanian69 0.7% Moroccan57 0.6% Iranian54 0.6% French43 0.5% Scottish41 0.4% Norwegian39 0.4% Arab38 0.4% Sierra Leonean30 0.3% Czechoslovakian27 0.3% Syrian26 0.3% Italian24 0.3% Dutch20 0.2% British19 0.2% Albanian19 0.2% French Canadian19 0.2% British West Indian17 0.2% Ukrainian16 0.2% Swedish15 0.2% Polish8 0.09% Hungarian6 0.06% Welsh
Children Nativity (place of birth) in Reidsville
Children under 6 years - Living with two parents Both parents native 295 100.0% NativeBoth parents foreign-born 29 100.0% NativeOne native, one foreign-born parent 129 100.0% NativeChildren under 6 years - Living with one parent Native parent 530 100.0% NativeChildren 6 to 17 years - Living with two parents Both parents native 535 100.0% NativeBoth parents foreign-born 29 100.0% NativeChildren 6 to 17 years - Living with one parent Native parent 1,166 100.0% NativeForeign-born parent 24 51.0% Native23 49.0% Foreign-born
Grandparents responsible for own grandchildren in Reidsville
Grandparents (30 to 59 years) White / Caucasian 67 31.4% Responsible for grandchildren147 68.6% Not responsible for grandchildrenBlack or African American 7 13.1% Responsible for grandchildren44 86.9% Not responsible for grandchildrenTwo or more races 25 100.0% Not responsible for grandchildrenWhite alone, not Hispanic / Latino 72 32.7% Responsible for grandchildren147 67.3% Not responsible for grandchildrenGrandparents (60 years and over) White / Caucasian 62 68.7% Responsible for grandchildren28 31.3% Not responsible for grandchildrenBlack or African American 104 84.5% Responsible for grandchildren19 15.5% Not responsible for grandchildrenWhite alone, not Hispanic / Latino 64 69.3% Responsible for grandchildren28 30.7% Not responsible for grandchildren