Races in Richmond, Texas (TX) Detailed Stats
Data:
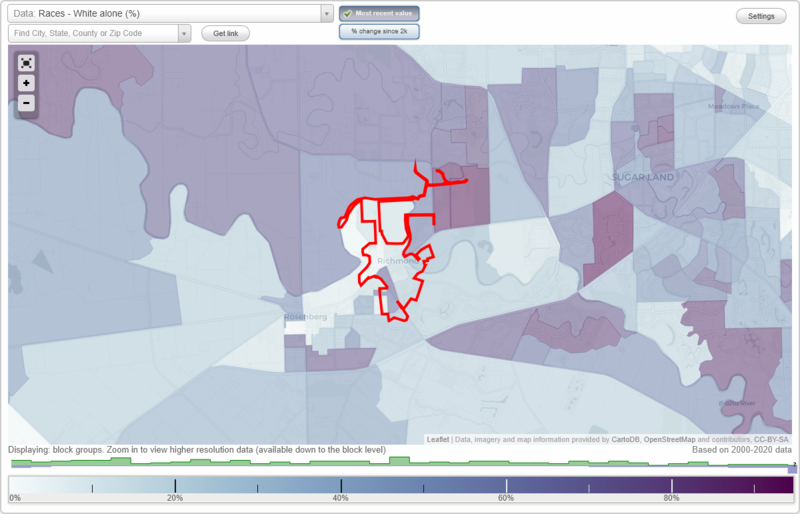
Races - White alone (%)
Races - White alone (% change since 2000)
Races - Black alone (%)
Races - Black alone (% change since 2000)
Races - American Indian alone (%)
Races - American Indian alone (% change since 2000)
Races - Asian alone (%)
Races - Asian alone (% change since 2000)
Races - Hispanic (%)
Races - Hispanic (% change since 2000)
Races - Native Hawaiian and Other Pacific Islander alone (%)
Races - Native Hawaiian and Other Pacific Islander alone (% change since 2000)
Races - Two or more races(%)
Races - Two or more races(% change since 2000)
Races - Other race alone (%)
Races - Other race alone (% change since 2000)
Racial diversity
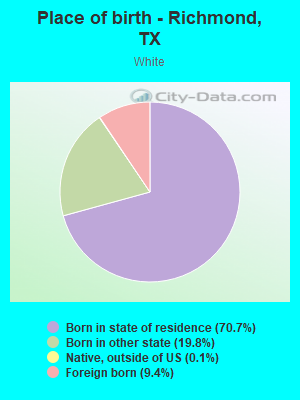
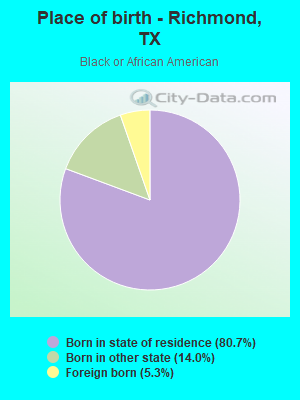
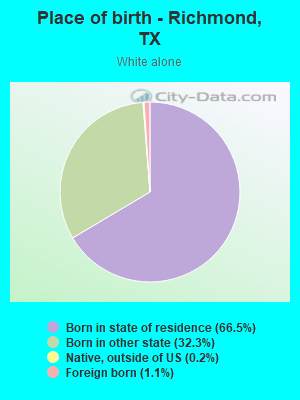
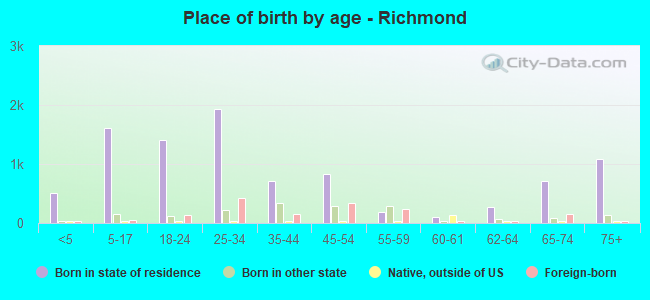
Place of birth - Born in state of residence (%)
Place of birth - Born in state of residence (%) - White
Place of birth - Born in state of residence (%) - Black or African American
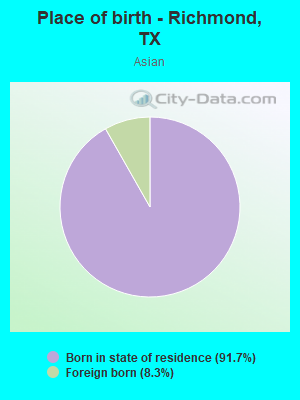
Place of birth - Born in state of residence (%) - Asian
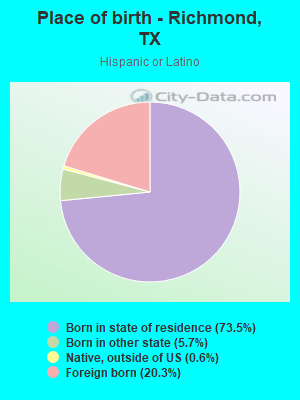
Place of birth - Born in state of residence (%) - Hispanic or Latino
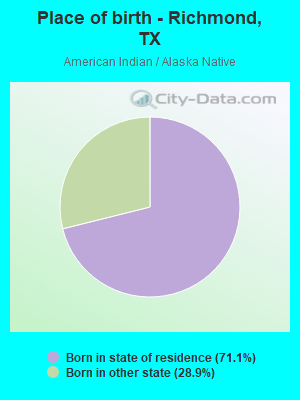
Place of birth - Born in state of residence (%) - American Indian and Alaska Native
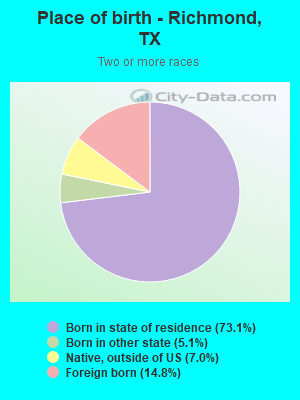
Place of birth - Born in state of residence (%) - Multirace
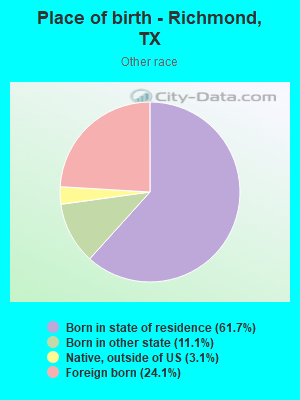
Place of birth - Born in state of residence (%) - Other Race
Place of birth - Born in other state (%)
Place of birth - Born in other state (%) - White
Place of birth - Born in other state (%) - Black or African American
Place of birth - Born in other state (%) - Asian
Place of birth - Born in other state (%) - Hispanic or Latino
Place of birth - Born in other state (%) - American Indian and Alaska Native
Place of birth - Born in other state (%) - Multirace
Place of birth - Born in other state (%) - Other Race
Place of birth - Native, outside of US (%)
Place of birth - Native, outside of US (%) - White
Place of birth - Native, outside of US (%) - Black or African American
Place of birth - Native, outside of US (%) - Asian
Place of birth - Native, outside of US (%) - Hispanic or Latino
Place of birth - Native, outside of US (%) - American Indian and Alaska Native
Place of birth - Native, outside of US (%) - Multirace
Place of birth - Native, outside of US (%) - Other Race
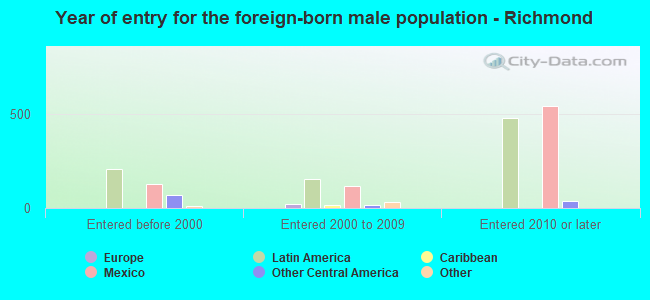
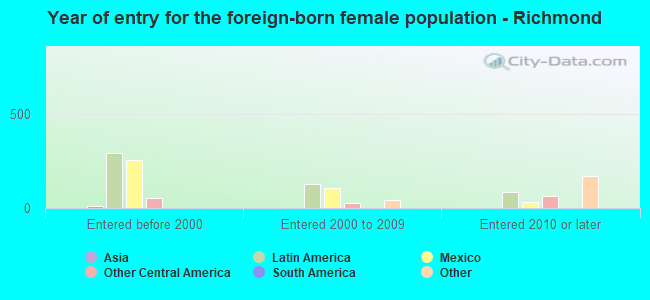
Place of birth - Foreign born (%)
Place of birth - Foreign born (%) - White
Place of birth - Foreign born (%) - Black or African American
Place of birth - Foreign born (%) - Asian
Place of birth - Foreign born (%) - Hispanic or Latino
Place of birth - Foreign born (%) - American Indian and Alaska Native
Place of birth - Foreign born (%) - Multirace
Place of birth - Foreign born (%) - Other Race
Residents speaking English at home (%)
Residents speaking English at home - Born in the United States (%)
Residents speaking English at home - Native, born elsewhere (%)
Residents speaking English at home - Foreign born (%)
Residents speaking Spanish at home (%)
Residents speaking Spanish at home - Born in the United States (%)
Residents speaking Spanish at home - Native, born elsewhere (%)
Residents speaking Spanish at home - Foreign born (%)
Residents speaking other language at home (%)
Residents speaking other language at home - Born in the United States (%)
Residents speaking other language at home - Native, born elsewhere (%)
Residents speaking other language at home - Foreign born (%)
Marital status - Never married (%)
Marital status - Now married (%)
Marital status - Separated (%)
Marital status - Widowed (%)
Marital status - Divorced (%)
Ancestries Reported - Arab (%)
Ancestries Reported - Czech (%)
Ancestries Reported - Danish (%)
Ancestries Reported - Dutch (%)
Ancestries Reported - English (%)
Ancestries Reported - French (%)
Ancestries Reported - French Canadian (%)
Ancestries Reported - German (%)
Ancestries Reported - Greek (%)
Ancestries Reported - Hungarian (%)
Ancestries Reported - Irish (%)
Ancestries Reported - Italian (%)
Ancestries Reported - Lithuanian (%)
Ancestries Reported - Norwegian (%)
Ancestries Reported - Polish (%)
Ancestries Reported - Portuguese (%)
Ancestries Reported - Russian (%)
Ancestries Reported - Scotch-Irish (%)
Ancestries Reported - Scottish (%)
Ancestries Reported - Slovak (%)
Ancestries Reported - Subsaharan African (%)
Ancestries Reported - Swedish (%)
Ancestries Reported - Swiss (%)
Ancestries Reported - Ukrainian (%)
Ancestries Reported - United States (%)
Ancestries Reported - Welsh (%)
Ancestries Reported - West Indian (%)
Ancestries Reported - Other (%)
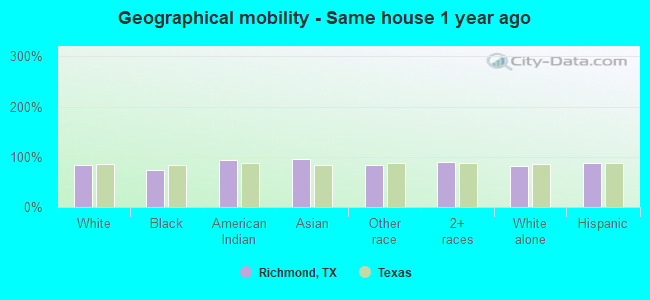
Geographical mobility - Same house 1 year ago (%)
Geographical mobility - Same house 1 year ago (%) - White
Geographical mobility - Same house 1 year ago (%) - Black or African American
Geographical mobility - Same house 1 year ago (%) - Asian
Geographical mobility - Same house 1 year ago (%) - Hispanic or Latino
Geographical mobility - Same house 1 year ago (%) - American Indian and Alaska Native
Geographical mobility - Same house 1 year ago (%) - Multirace
Geographical mobility - Same house 1 year ago (%) - Other Race
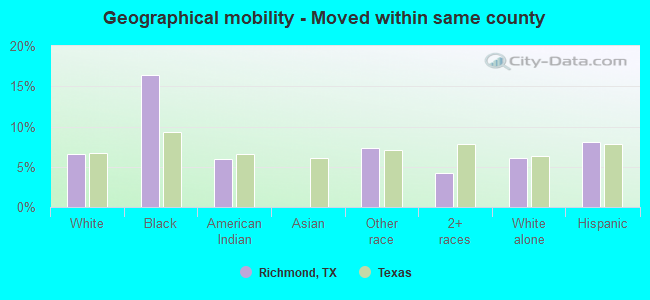
Geographical mobility - Moved within same county (%)
Geographical mobility - Moved within same county (%) - White
Geographical mobility - Moved within same county (%) - Black or African American
Geographical mobility - Moved within same county (%) - Asian
Geographical mobility - Moved within same county (%) - Hispanic or Latino
Geographical mobility - Moved within same county (%) - American Indian and Alaska Native
Geographical mobility - Moved within same county (%) - Multirace
Geographical mobility - Moved within same county (%) - Other Race
Geographical mobility - Moved from different county within same state (%)
Geographical mobility - Moved from different county within same state (%) - White
Geographical mobility - Moved from different county within same state (%) - Black or African American
Geographical mobility - Moved from different county within same state (%) - Asian
Geographical mobility - Moved from different county within same state (%) - Hispanic or Latino
Geographical mobility - Moved from different county within same state (%) - American Indian and Alaska Native
Geographical mobility - Moved from different county within same state (%) - Multirace
Geographical mobility - Moved from different county within same state (%) - Other Race
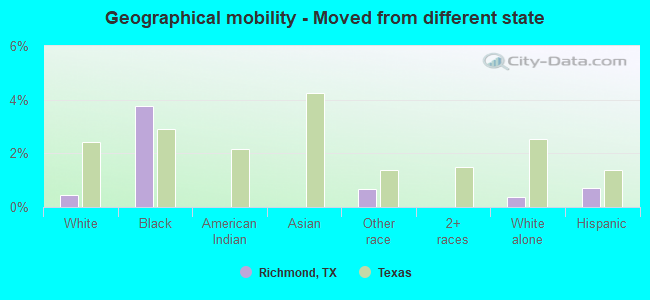
Geographical mobility - Moved from different state (%)
Geographical mobility - Moved from different state (%) - White
Geographical mobility - Moved from different state (%) - Black or African American
Geographical mobility - Moved from different state (%) - Asian
Geographical mobility - Moved from different state (%) - Hispanic or Latino
Geographical mobility - Moved from different state (%) - American Indian and Alaska Native
Geographical mobility - Moved from different state (%) - Multirace
Geographical mobility - Moved from different state (%) - Other Race
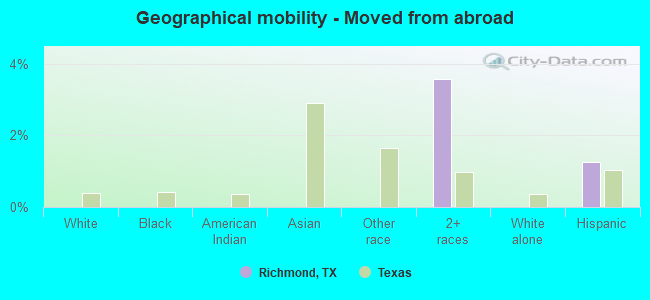
Geographical mobility - Moved from abroad (%)
Geographical mobility - Moved from abroad (%) - White
Geographical mobility - Moved from abroad (%) - Black or African American
Geographical mobility - Moved from abroad (%) - Asian
Geographical mobility - Moved from abroad (%) - Hispanic or Latino
Geographical mobility - Moved from abroad (%) - American Indian and Alaska Native
Geographical mobility - Moved from abroad (%) - Multirace
Geographical mobility - Moved from abroad (%) - Other Race
Place of birth for the foreign-born population - Ireland (%)
Place of birth for the foreign-born population - Denmark (%)
Place of birth for the foreign-born population - Norway (%)
Place of birth for the foreign-born population - Sweden (%)
Place of birth for the foreign-born population - United Kingdom (%)
Place of birth for the foreign-born population - England (%)
Place of birth for the foreign-born population - Scotland (%)
Place of birth for the foreign-born population - Other Northern Europe (%)
Place of birth for the foreign-born population - Austria (%)
Place of birth for the foreign-born population - Belgium (%)
Place of birth for the foreign-born population - France (%)
Place of birth for the foreign-born population - Germany (%)
Place of birth for the foreign-born population - Netherlands (%)
Place of birth for the foreign-born population - Switzerland (%)
Place of birth for the foreign-born population - Other Western Europe (%)
Place of birth for the foreign-born population - Greece (%)
Place of birth for the foreign-born population - Italy (%)
Place of birth for the foreign-born population - Portugal (%)
Place of birth for the foreign-born population - Spain (%)
Place of birth for the foreign-born population - Other Southern Europe (%)
Place of birth for the foreign-born population - Albania (%)
Place of birth for the foreign-born population - Belarus (%)
Place of birth for the foreign-born population - Bosnia and Herzegovina (%)
Place of birth for the foreign-born population - Bulgaria (%)
Place of birth for the foreign-born population - Croatia (%)
Place of birth for the foreign-born population - Czechoslovakia (%)
Place of birth for the foreign-born population - Hungary (%)
Place of birth for the foreign-born population - Latvia (%)
Place of birth for the foreign-born population - Lithuania (%)
Place of birth for the foreign-born population - North Macedonia (Macedonia) (%)
Place of birth for the foreign-born population - Moldova (%)
Place of birth for the foreign-born population - Poland (%)
Place of birth for the foreign-born population - Romania (%)
Place of birth for the foreign-born population - Russia (%)
Place of birth for the foreign-born population - Serbia (%)
Place of birth for the foreign-born population - Ukraine (%)
Place of birth for the foreign-born population - Other Eastern Europe (%)
Place of birth for the foreign-born population - China (%)
Place of birth for the foreign-born population - Hong Kong (%)
Place of birth for the foreign-born population - Taiwan (%)
Place of birth for the foreign-born population - Japan (%)
Place of birth for the foreign-born population - Korea (%)
Place of birth for the foreign-born population - Other Eastern Asia (%)
Place of birth for the foreign-born population - Afghanistan (%)
Place of birth for the foreign-born population - Bangladesh (%)
Place of birth for the foreign-born population - India (%)
Place of birth for the foreign-born population - Iran (%)
Place of birth for the foreign-born population - Kazakhstan (%)
Place of birth for the foreign-born population - Nepal (%)
Place of birth for the foreign-born population - Pakistan (%)
Place of birth for the foreign-born population - Sri Lanka (%)
Place of birth for the foreign-born population - Uzbekistan (%)
Place of birth for the foreign-born population - Other South Central Asia (%)
Place of birth for the foreign-born population - Burma (%)
Place of birth for the foreign-born population - Cambodia (%)
Place of birth for the foreign-born population - Indonesia (%)
Place of birth for the foreign-born population - Laos (%)
Place of birth for the foreign-born population - Malaysia (%)
Place of birth for the foreign-born population - Philippines (%)
Place of birth for the foreign-born population - Singapore (%)
Place of birth for the foreign-born population - Thailand (%)
Place of birth for the foreign-born population - Vietnam (%)
Place of birth for the foreign-born population - Other South Eastern Asia (%)
Place of birth for the foreign-born population - Armenia (%)
Place of birth for the foreign-born population - Iraq (%)
Place of birth for the foreign-born population - Israel (%)
Place of birth for the foreign-born population - Jordan (%)
Place of birth for the foreign-born population - Kuwait (%)
Place of birth for the foreign-born population - Lebanon (%)
Place of birth for the foreign-born population - Saudi Arabia (%)
Place of birth for the foreign-born population - Syria (%)
Place of birth for the foreign-born population - Turkey (%)
Place of birth for the foreign-born population - Yemen (%)
Place of birth for the foreign-born population - Other Western Asia (%)
Place of birth for the foreign-born population - Eritrea (%)
Place of birth for the foreign-born population - Ethiopia (%)
Place of birth for the foreign-born population - Kenya (%)
Place of birth for the foreign-born population - Somalia (%)
Place of birth for the foreign-born population - Uganda (%)
Place of birth for the foreign-born population - Zimbabwe (%)
Place of birth for the foreign-born population - Other Eastern Africa (%)
Place of birth for the foreign-born population - Cameroon (%)
Place of birth for the foreign-born population - Congo (%)
Place of birth for the foreign-born population - Democratic Republic of Congo (Zaire) (%)
Place of birth for the foreign-born population - Other Middle Africa (%)
Place of birth for the foreign-born population - Egypt (%)
Place of birth for the foreign-born population - Morocco (%)
Place of birth for the foreign-born population - Sudan (%)
Place of birth for the foreign-born population - Other Northern Africa (%)
Place of birth for the foreign-born population - South Africa (%)
Place of birth for the foreign-born population - Other Southern Africa (%)
Place of birth for the foreign-born population - Cabo Verde (%)
Place of birth for the foreign-born population - Ghana (%)
Place of birth for the foreign-born population - Liberia (%)
Place of birth for the foreign-born population - Nigeria (%)
Place of birth for the foreign-born population - Senegal (%)
Place of birth for the foreign-born population - Sierra Leone (%)
Place of birth for the foreign-born population - Other Western Africa (%)
Place of birth for the foreign-born population - Australia (%)
Place of birth for the foreign-born population - New Zealand (%)
Place of birth for the foreign-born population - Fiji (%)
Place of birth for the foreign-born population - Micronesia (%)
Place of birth for the foreign-born population - Bahamas (%)
Place of birth for the foreign-born population - Barbados (%)
Place of birth for the foreign-born population - Cuba (%)
Place of birth for the foreign-born population - Dominica (%)
Place of birth for the foreign-born population - Dominican Republic (%)
Place of birth for the foreign-born population - Grenada (%)
Place of birth for the foreign-born population - Haiti (%)
Place of birth for the foreign-born population - Jamaica (%)
Place of birth for the foreign-born population - St. Vincent and the Grenadines (%)
Place of birth for the foreign-born population - Trinidad and Tobago (%)
Place of birth for the foreign-born population - West Indies (%)
Place of birth for the foreign-born population - Other Caribbean (%)
Place of birth for the foreign-born population - Belize (%)
Place of birth for the foreign-born population - Costa Rica (%)
Place of birth for the foreign-born population - El Salvador (%)
Place of birth for the foreign-born population - Guatemala (%)
Place of birth for the foreign-born population - Honduras (%)
Place of birth for the foreign-born population - Mexico (%)
Place of birth for the foreign-born population - Nicaragua (%)
Place of birth for the foreign-born population - Panama (%)
Place of birth for the foreign-born population - Other Central America (%)
Place of birth for the foreign-born population - Argentina (%)
Place of birth for the foreign-born population - Bolivia (%)
Place of birth for the foreign-born population - Brazil (%)
Place of birth for the foreign-born population - Chile (%)
Place of birth for the foreign-born population - Colombia (%)
Place of birth for the foreign-born population - Ecuador (%)
Place of birth for the foreign-born population - Guyana (%)
Place of birth for the foreign-born population - Peru (%)
Place of birth for the foreign-born population - Uruguay (%)
Place of birth for the foreign-born population - Venezuela (%)
Place of birth for the foreign-born population - Other South America (%)
Place of birth for the foreign-born population - Canada (%)
Place of birth for the foreign-born population - Other Northern America (%)
Place of birth for the foreign-born population - Other (%)
Latest news about races in Richmond, TX collected exclusively by city-data.com from local newspapers, TV, and radio stations
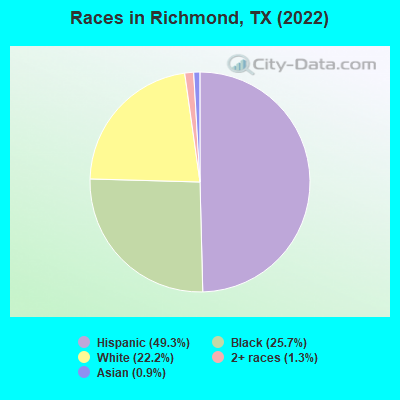
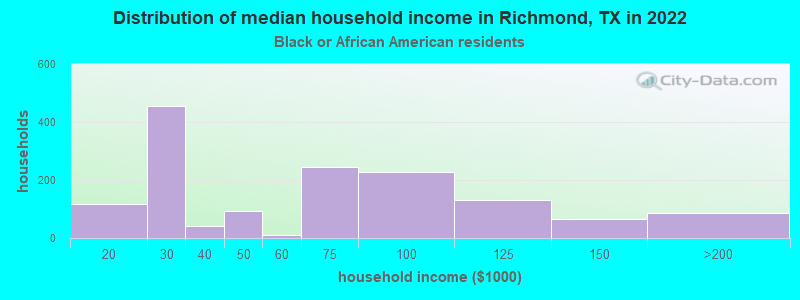
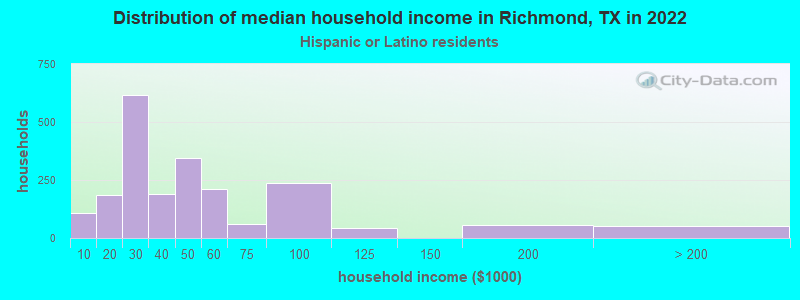
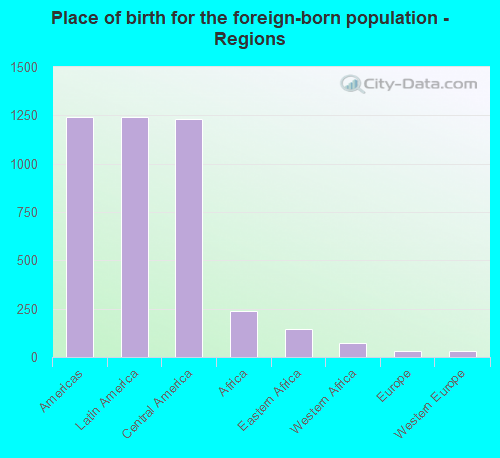
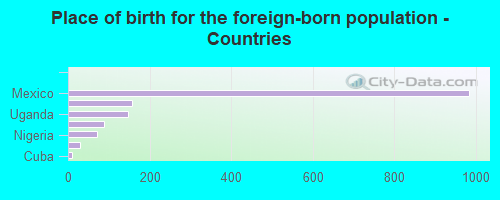
According to 2022 data, the most numerous races in Richmond, TX are Hispanic (6,285 residents), White alone (2,834 residents), and Black alone (3,275 residents). 65.5% of Richmond residents speak English at home. 11.9% of Richmond, TX residents are foreign-born (10.0% born in Latin America, 1.9% born in Africa), which is 42.9% less than the foreign-born rate of 17.0% across the entire state of Texas.
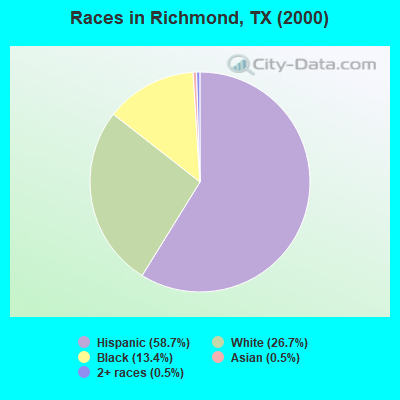
Race distribution in Richmond
2000 2022
10,933,313 52.4% White alone 6,669,666 32.0% Hispanic 2,364,255 11.3% Black alone 554,445 2.7% Asian alone 230,567 1.1% Two or more races 68,859 0.3% American Indian alone 19,958 0.10% Other race alone 10,757 0.05% Native Hawaiian and Other
12,070,642 40.2% Hispanic 11,683,430 38.9% White alone 3,508,706 11.7% Black alone 1,608,173 5.4% Asian alone 956,560 3.2% Two or more races 125,763 0.4% Other race alone 47,023 0.2% American Indian alone 29,275 0.10% Native Hawaiian and Other
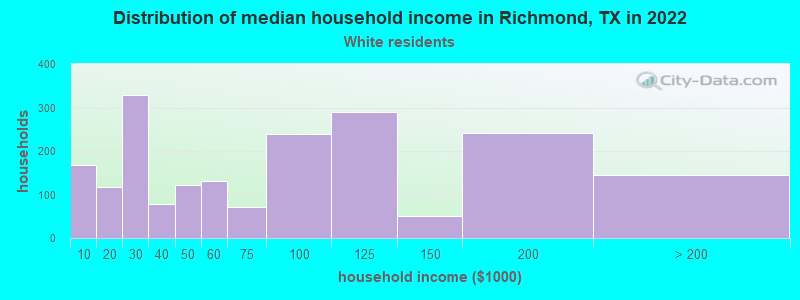
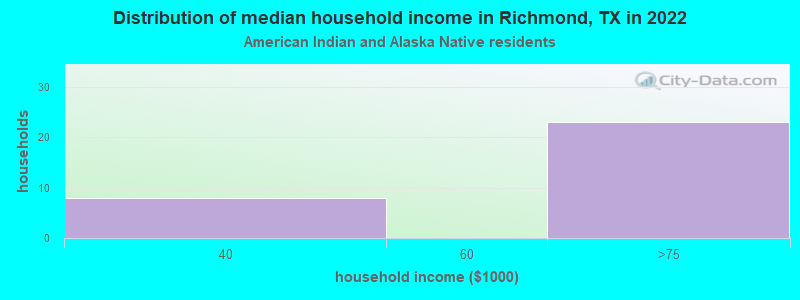
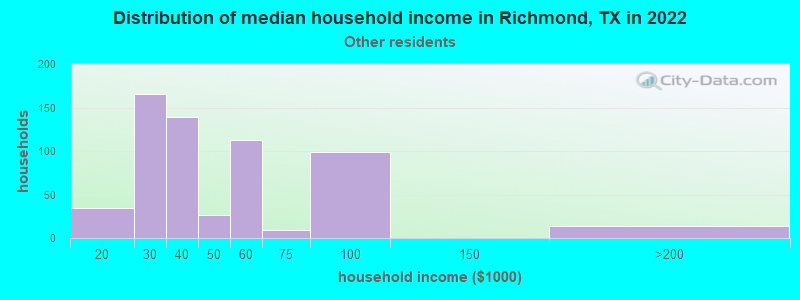
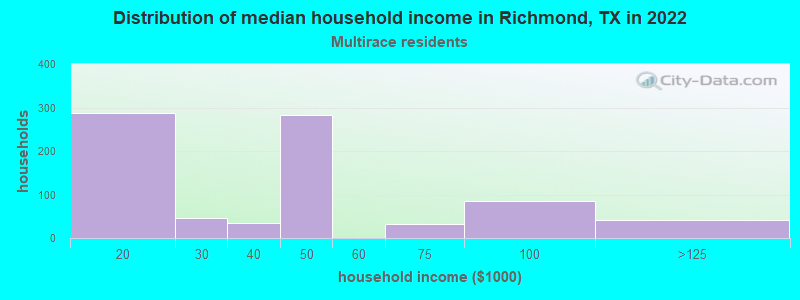
Income and house value in Richmond Median household income in 2022 $94,771 White non-Hispanic householders$66,059 Black householders$38,468 Some other race householders$41,552 Two or more races householders$35,576 Hispanic or Latino race householdersMedian 2022 house value $325,647 White Non-Hispanic householders$134,887 Black or African American householders$90,916 American Indian or Alaska Native householders $181,833 Asian householders$150,425 Some other race householders$245,971 Two or more races householders$155,054 Hispanic or Latino householders
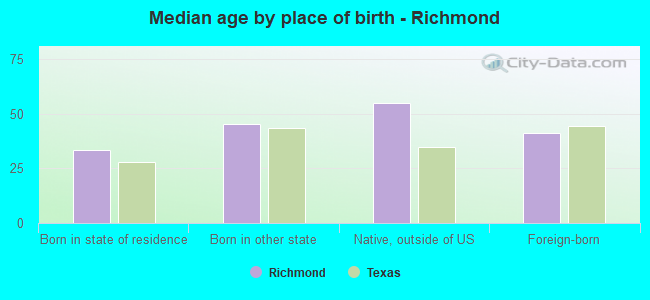
Median age by race in Richmond
35.7 Median age for White residents34.1 39.9 41.4 Median age for Black or African American residents33.5 45.8 63.1 Median age for American Indian / Alaska Native residents30.7 81.7 32.0 Median age for Asian residents-670,166,228.6 -680,555,554.9 -581,560,283.1 Median age for Native Hawaiian / Pacific Islander residents-612,729,233.5 -577,777,777.2 31.5 Median age for Other race residents30.7 38.9 27.9 Median age for Two or more races residents27.3 28.5 43.2 Median age for White alone residents38.9 55.9 28.7 Median age for Hispanic or Latino residents29.2 28.3
Owner/renter occupied households by race in Richmond
House owners and renters - White residents 1,147 59.4% Owner occupied783 40.6% Renter occupiedHouse owners and renters - Black or African American residents 754 54.9% Owner occupied620 45.1% Renter occupiedHouse owners and renters - American Indian / Alaska Native residents 23 100.0% Owner occupiedHouse owners and renters - Asian residents 9 100.0% Owner occupiedHouse owners and renters - Other race residents 299 49.0% Owner occupied311 51.0% Renter occupiedHouse owners and renters - Two or more races residents 375 44.9% Owner occupied460 55.1% Renter occupiedHouse owners and renters - White alone residents 894 65.6% Owner occupied468 34.4% Renter occupiedHouse owners and renters - Hispanic or Latino residents 905 49.4% Owner occupied925 50.6% Renter occupied
Language usage in Richmond
English speakers - Total 65.5% of residents of Richmond speak English at home.
32.0% of residents speak Spanish at home 2,591 66.4% Speak English very well1,311 33.6% Speak English less than very well3.0% of residents speak other language at home 360 97.8% Speak English very well8 2.2% Speak English less than very well
English speakers - Born in the United States 86.0% of residents of Richmond speak English at home.
17.5% of residents speak Spanish at home 157 52.3% Speak English very well143 47.7% Speak English less than very well
English speakers - Native, born elsewhere 74.8% of residents of Richmond speak English at home.
17.8% of residents speak Spanish at home 29 100.0% Speak English very well
English speakers - Foreign-born 3.4% of residents of Richmond speak English at home.
77.2% of residents speak Spanish at home 396 32.6% Speak English very well820 67.4% Speak English less than very well15.4% of residents speak other language at home 235 96.7% Speak English very well8 3.3% Speak English less than very well
White (Caucasian) - Speak only English Native:
80.5% (3,327)Foreign-born:
6.8% (30)
White (Caucasian) - Speak another language Native:
14.5% (600)Foreign-born:
84.3% (375)
Black or African American - Speak only English Native:
100.0% (3,111)Foreign-born:
7.5% (14)
Black or African American - Speak another language Native:
0.5% (14)Foreign-born:
91.7% (170)
Asian - Speak another language Native:
91.5% (100)Foreign-born:
99.0% (9)
Other race - Speak another language Native:
58.6% (882)Foreign-born:
93.1% (433)
Two or more races - Speak another language Native:
55.7% (1,137)Foreign-born:
94.8% (373)
White alone - Speak only English Native:
92.3% (2,587)Foreign-born:
100.0% (31)
Hispanic or Latino - Speak only English Native:
44.7% (2,068)Foreign-born:
0.2% (2)
Hispanic or Latino - Speak another language Native:
55.4% (2,559)Foreign-born:
95.3% (1,205)
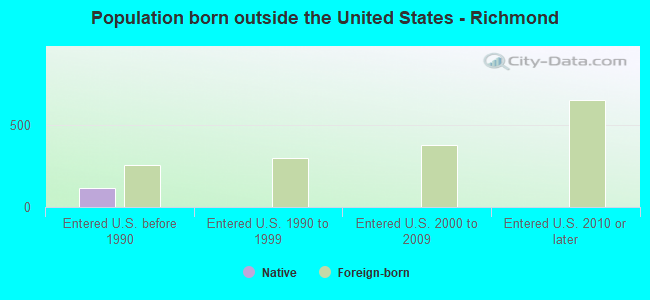
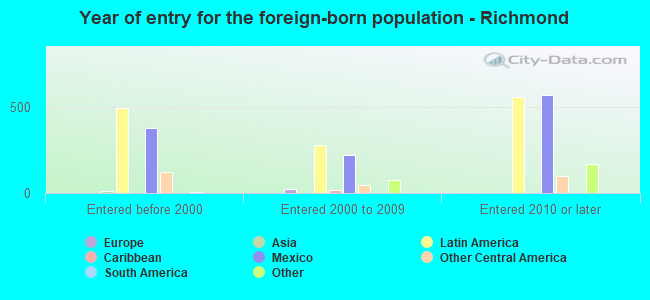
Foreign-born residents in Richmond 1,516 residents are foreign born (10.0% Latin America , 1.9% Africa ).
This city:
11.9%Texas:
17.1%
Marital status for residents in Richmond Marital status - White (Caucasian) population 15 years and over
Males 50.6% Never married34.6% Now married2.2% Separated1.5% Widowed11.1% DivorcedFemales 41.1% Never married27.8% Now married3.5% Separated10.1% Widowed17.5% DivorcedWomen who gave birth in the past 12 months Now married:
0.0% (0)Unmarried:
100.0% (13)
Women who did not give birth in the past 12 months Now married:
28.1% (277)Unmarried:
71.9% (711)
Marital status - Black or African American population 15 years and over
Males 61.3% Never married28.7% Now married1.4% Separated0.7% Widowed7.9% DivorcedFemales 54.4% Never married14.5% Now married1.0% Separated20.7% Widowed9.4% DivorcedWomen who gave birth in the past 12 months Now married:
0.0% (0)Unmarried:
100.0% (79)
Women who did not give birth in the past 12 months Now married:
14.9% (123)Unmarried:
85.1% (700)
Marital status - American Indian / Alaska Native population 15 years and over
Males 75.4% Never married24.6% Now married0.0% Separated0.0% Widowed0.0% DivorcedFemales 0.0% Never married42.9% Now married0.0% Separated42.9% Widowed14.3% DivorcedMarital status - Asian population 15 years and over
Males 100.0% Never married0.0% Now married0.0% Separated0.0% Widowed0.0% DivorcedFemales 0.0% Never married0.0% Now married0.0% Separated8.0% Widowed92.0% DivorcedWomen who did not give birth in the past 12 months Now married:
0.0% (0)Unmarried:
100.0% (101)
Marital status - Other race population 15 years and over
Males 54.0% Never married36.6% Now married1.0% Separated1.0% Widowed7.5% DivorcedFemales 26.6% Never married48.8% Now married6.4% Separated9.1% Widowed9.1% DivorcedWomen who gave birth in the past 12 months Now married:
100.0% (25)Unmarried:
0.0% (0)
Women who did not give birth in the past 12 months Now married:
47.2% (207)Unmarried:
52.8% (232)
Marital status - Two or more races population 15 years and over
Males 30.2% Never married48.0% Now married1.2% Separated0.0% Widowed20.5% DivorcedFemales 42.3% Never married27.0% Now married0.0% Separated23.9% Widowed6.8% DivorcedWomen who gave birth in the past 12 months Now married:
0.0% (0)Unmarried:
100.0% (28)
Women who did not give birth in the past 12 months Now married:
25.9% (145)Unmarried:
74.1% (417)
Marital status - White alone, not Hispanic / Latino population 15 years and over
Males 44.4% Never married38.5% Now married0.7% Separated0.5% Widowed15.9% DivorcedFemales 24.3% Never married33.5% Now married1.7% Separated11.8% Widowed28.7% DivorcedWomen who did not give birth in the past 12 months Now married:
33.4% (147)Unmarried:
66.6% (292)
Marital status - Hispanic or Latino population 15 years and over
Males 52.8% Never married37.7% Now married2.4% Separated1.5% Widowed5.6% DivorcedFemales 47.6% Never married28.8% Now married4.1% Separated13.0% Widowed6.4% DivorcedWomen who gave birth in the past 12 months Now married:
32.7% (17)Unmarried:
67.3% (36)
Women who did not give birth in the past 12 months Now married:
29.4% (451)Unmarried:
70.6% (1,086)
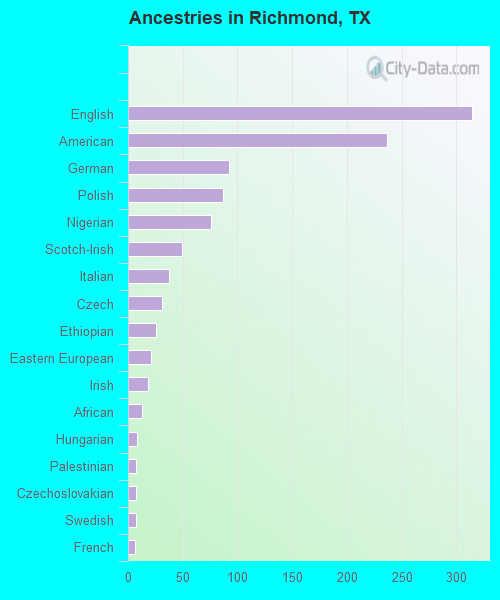
Ancestries in Richmond
314 4.0% English237 3.0% American92 1.2% German87 1.1% Polish76 1.0% Nigerian49 0.6% Scotch-Irish37 0.5% Italian31 0.4% Czech26 0.3% Ethiopian21 0.3% Eastern European18 0.2% Irish13 0.2% African8 0.1% Hungarian7 0.09% Palestinian7 0.09% Czechoslovakian7 0.09% Swedish6 0.08% French
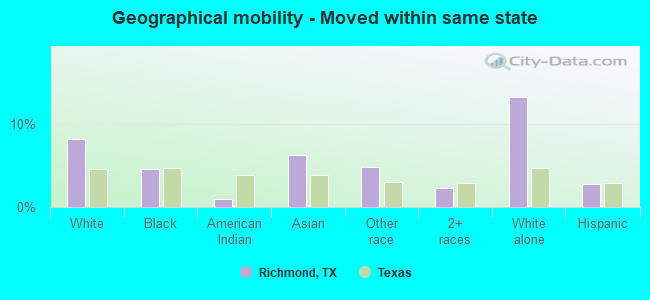
Geographical mobility in Richmond Same house 1 year ago 3,958 84.1% White (Caucasian)2,376 73.1% Black or African American132 94.1% American Indian / Alaska Native113 95.1% Asian1,583 83.0% Other race2,442 90.1% Two or more races2,310 81.6% White alone, not Hispanic / Latino5,454 87.0% Hispanic or LatinoMoved within same county 309 6.6% White / Caucasian534 16.4% Black or African American8 5.9% American Indian / Alaska Native139 7.3% Other race116 4.3% Two or more races172 6.1% White alone, not Hispanic / Latino509 8.1% Hispanic or LatinoMoved within same state 385 8.2% White / Caucasian151 4.7% Black or African American1 0.9% American Indian / Alaska Native7 6.3% Asian93 4.9% Other race62 2.3% Two or more races378 13.3% White alone, not Hispanic / Latino172 2.7% Hispanic or LatinoMoved from different state 22 0.5% White / Caucasian122 3.8% Black or African American12 0.7% Other race11 0.4% White alone, not Hispanic / Latino43 0.7% Hispanic or LatinoMoved from abroad 97 3.6% Two or more races78 1.3% Hispanic or Latino
Children Nativity (place of birth) in Richmond
Children under 6 years - Living with two parents Both parents native 309 100.0% NativeBoth parents foreign-born 20 100.0% NativeChildren under 6 years - Living with one parent Native parent 432 100.0% NativeForeign-born parent 36 100.0% NativeChildren 6 to 17 years - Living with two parents Both parents native 396 100.0% NativeBoth parents foreign-born 114 100.0% NativeOne native, one foreign-born parent 89 100.0% NativeChildren 6 to 17 years - Living with one parent Native parent 742 100.0% NativeForeign-born parent 97 51.2% Native93 48.8% Foreign-born
Grandparents responsible for own grandchildren in Richmond
Grandparents (30 to 59 years) White / Caucasian 35 100.0% Not responsible for grandchildrenOther race 13 18.4% Responsible for grandchildren58 81.6% Not responsible for grandchildrenWhite alone, not Hispanic / Latino 27 100.0% Not responsible for grandchildrenHispanic or Latino 16 14.6% Responsible for grandchildren95 85.4% Not responsible for grandchildrenGrandparents (60 years and over) White / Caucasian 17 26.4% Responsible for grandchildren46 73.6% Not responsible for grandchildrenOther race 65 100.0% Not responsible for grandchildrenHispanic or Latino 19 10.8% Responsible for grandchildren160 89.2% Not responsible for grandchildren