Races in Ridgewood, New Jersey (NJ) Detailed Stats
Data:
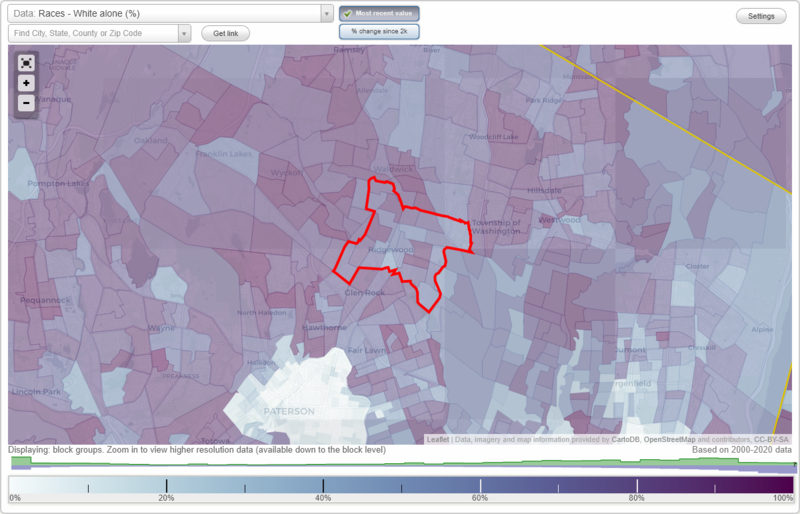
Races - White alone (%)
Races - White alone (% change since 2000)
Races - Black alone (%)
Races - Black alone (% change since 2000)
Races - American Indian alone (%)
Races - American Indian alone (% change since 2000)
Races - Asian alone (%)
Races - Asian alone (% change since 2000)
Races - Hispanic (%)
Races - Hispanic (% change since 2000)
Races - Native Hawaiian and Other Pacific Islander alone (%)
Races - Native Hawaiian and Other Pacific Islander alone (% change since 2000)
Races - Two or more races(%)
Races - Two or more races(% change since 2000)
Races - Other race alone (%)
Races - Other race alone (% change since 2000)
Racial diversity
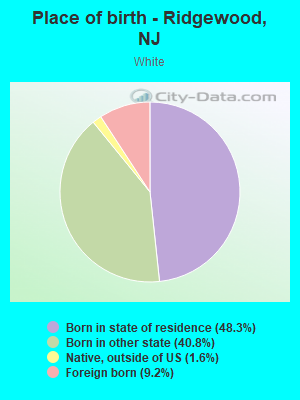
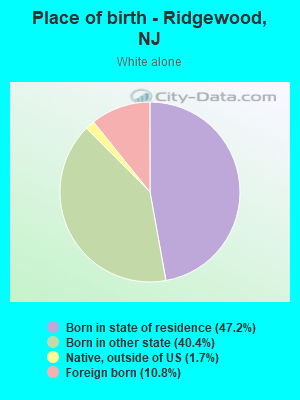
Place of birth - Born in state of residence (%)
Place of birth - Born in state of residence (%) - White
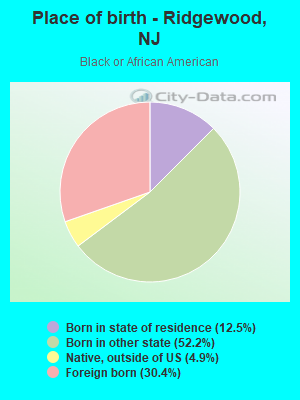
Place of birth - Born in state of residence (%) - Black or African American
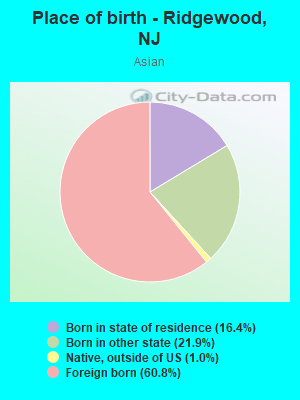
Place of birth - Born in state of residence (%) - Asian
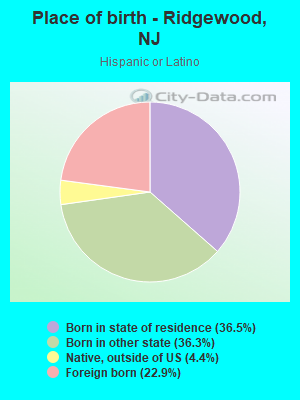
Place of birth - Born in state of residence (%) - Hispanic or Latino
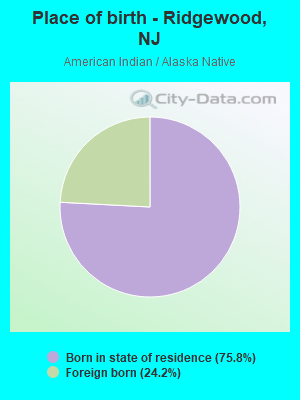
Place of birth - Born in state of residence (%) - American Indian and Alaska Native
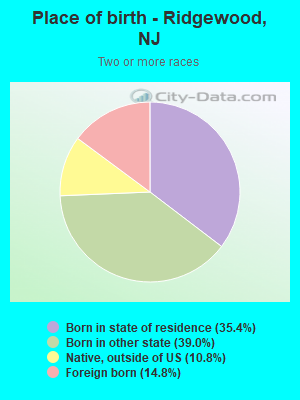
Place of birth - Born in state of residence (%) - Multirace
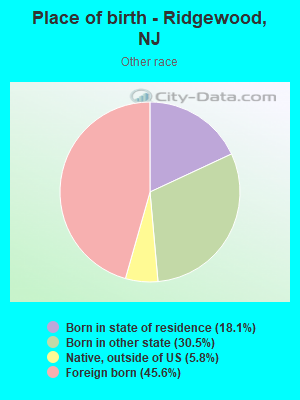
Place of birth - Born in state of residence (%) - Other Race
Place of birth - Born in other state (%)
Place of birth - Born in other state (%) - White
Place of birth - Born in other state (%) - Black or African American
Place of birth - Born in other state (%) - Asian
Place of birth - Born in other state (%) - Hispanic or Latino
Place of birth - Born in other state (%) - American Indian and Alaska Native
Place of birth - Born in other state (%) - Multirace
Place of birth - Born in other state (%) - Other Race
Place of birth - Native, outside of US (%)
Place of birth - Native, outside of US (%) - White
Place of birth - Native, outside of US (%) - Black or African American
Place of birth - Native, outside of US (%) - Asian
Place of birth - Native, outside of US (%) - Hispanic or Latino
Place of birth - Native, outside of US (%) - American Indian and Alaska Native
Place of birth - Native, outside of US (%) - Multirace
Place of birth - Native, outside of US (%) - Other Race
Place of birth - Foreign born (%)
Place of birth - Foreign born (%) - White
Place of birth - Foreign born (%) - Black or African American
Place of birth - Foreign born (%) - Asian
Place of birth - Foreign born (%) - Hispanic or Latino
Place of birth - Foreign born (%) - American Indian and Alaska Native
Place of birth - Foreign born (%) - Multirace
Place of birth - Foreign born (%) - Other Race
Residents speaking English at home (%)
Residents speaking English at home - Born in the United States (%)
Residents speaking English at home - Native, born elsewhere (%)
Residents speaking English at home - Foreign born (%)
Residents speaking Spanish at home (%)
Residents speaking Spanish at home - Born in the United States (%)
Residents speaking Spanish at home - Native, born elsewhere (%)
Residents speaking Spanish at home - Foreign born (%)
Residents speaking other language at home (%)
Residents speaking other language at home - Born in the United States (%)
Residents speaking other language at home - Native, born elsewhere (%)
Residents speaking other language at home - Foreign born (%)
Marital status - Never married (%)
Marital status - Now married (%)
Marital status - Separated (%)
Marital status - Widowed (%)
Marital status - Divorced (%)
Ancestries Reported - Arab (%)
Ancestries Reported - Czech (%)
Ancestries Reported - Danish (%)
Ancestries Reported - Dutch (%)
Ancestries Reported - English (%)
Ancestries Reported - French (%)
Ancestries Reported - French Canadian (%)
Ancestries Reported - German (%)
Ancestries Reported - Greek (%)
Ancestries Reported - Hungarian (%)
Ancestries Reported - Irish (%)
Ancestries Reported - Italian (%)
Ancestries Reported - Lithuanian (%)
Ancestries Reported - Norwegian (%)
Ancestries Reported - Polish (%)
Ancestries Reported - Portuguese (%)
Ancestries Reported - Russian (%)
Ancestries Reported - Scotch-Irish (%)
Ancestries Reported - Scottish (%)
Ancestries Reported - Slovak (%)
Ancestries Reported - Subsaharan African (%)
Ancestries Reported - Swedish (%)
Ancestries Reported - Swiss (%)
Ancestries Reported - Ukrainian (%)
Ancestries Reported - United States (%)
Ancestries Reported - Welsh (%)
Ancestries Reported - West Indian (%)
Ancestries Reported - Other (%)
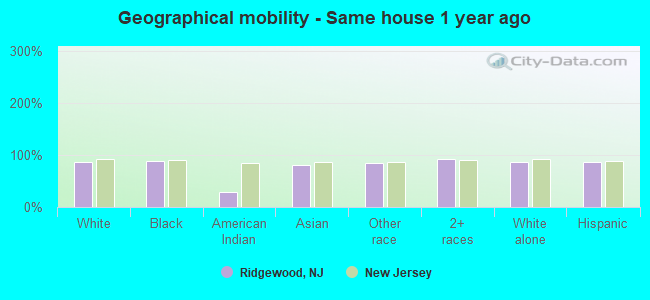
Geographical mobility - Same house 1 year ago (%)
Geographical mobility - Same house 1 year ago (%) - White
Geographical mobility - Same house 1 year ago (%) - Black or African American
Geographical mobility - Same house 1 year ago (%) - Asian
Geographical mobility - Same house 1 year ago (%) - Hispanic or Latino
Geographical mobility - Same house 1 year ago (%) - American Indian and Alaska Native
Geographical mobility - Same house 1 year ago (%) - Multirace
Geographical mobility - Same house 1 year ago (%) - Other Race
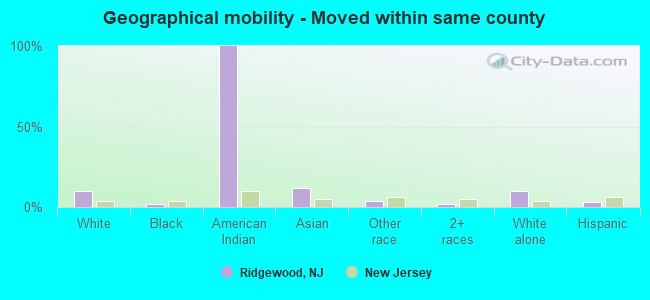
Geographical mobility - Moved within same county (%)
Geographical mobility - Moved within same county (%) - White
Geographical mobility - Moved within same county (%) - Black or African American
Geographical mobility - Moved within same county (%) - Asian
Geographical mobility - Moved within same county (%) - Hispanic or Latino
Geographical mobility - Moved within same county (%) - American Indian and Alaska Native
Geographical mobility - Moved within same county (%) - Multirace
Geographical mobility - Moved within same county (%) - Other Race
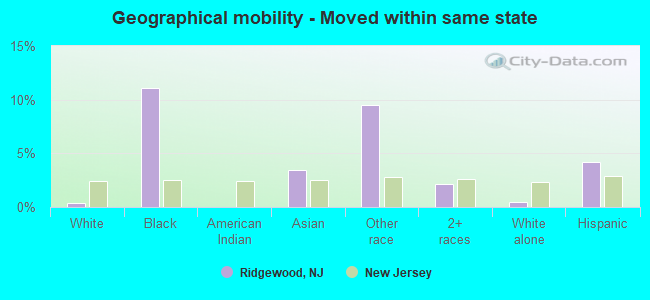
Geographical mobility - Moved from different county within same state (%)
Geographical mobility - Moved from different county within same state (%) - White
Geographical mobility - Moved from different county within same state (%) - Black or African American
Geographical mobility - Moved from different county within same state (%) - Asian
Geographical mobility - Moved from different county within same state (%) - Hispanic or Latino
Geographical mobility - Moved from different county within same state (%) - American Indian and Alaska Native
Geographical mobility - Moved from different county within same state (%) - Multirace
Geographical mobility - Moved from different county within same state (%) - Other Race
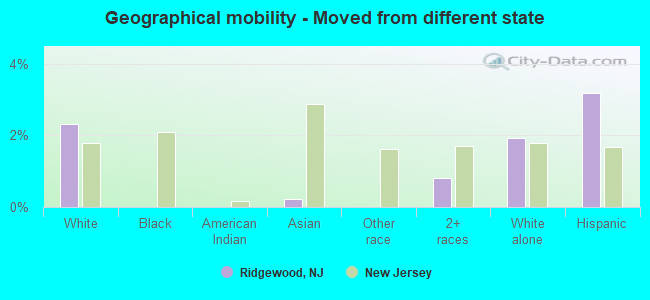
Geographical mobility - Moved from different state (%)
Geographical mobility - Moved from different state (%) - White
Geographical mobility - Moved from different state (%) - Black or African American
Geographical mobility - Moved from different state (%) - Asian
Geographical mobility - Moved from different state (%) - Hispanic or Latino
Geographical mobility - Moved from different state (%) - American Indian and Alaska Native
Geographical mobility - Moved from different state (%) - Multirace
Geographical mobility - Moved from different state (%) - Other Race
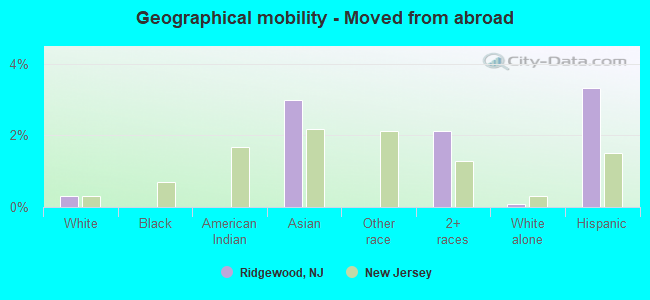
Geographical mobility - Moved from abroad (%)
Geographical mobility - Moved from abroad (%) - White
Geographical mobility - Moved from abroad (%) - Black or African American
Geographical mobility - Moved from abroad (%) - Asian
Geographical mobility - Moved from abroad (%) - Hispanic or Latino
Geographical mobility - Moved from abroad (%) - American Indian and Alaska Native
Geographical mobility - Moved from abroad (%) - Multirace
Geographical mobility - Moved from abroad (%) - Other Race
Place of birth for the foreign-born population - Ireland (%)
Place of birth for the foreign-born population - Denmark (%)
Place of birth for the foreign-born population - Norway (%)
Place of birth for the foreign-born population - Sweden (%)
Place of birth for the foreign-born population - United Kingdom (%)
Place of birth for the foreign-born population - England (%)
Place of birth for the foreign-born population - Scotland (%)
Place of birth for the foreign-born population - Other Northern Europe (%)
Place of birth for the foreign-born population - Austria (%)
Place of birth for the foreign-born population - Belgium (%)
Place of birth for the foreign-born population - France (%)
Place of birth for the foreign-born population - Germany (%)
Place of birth for the foreign-born population - Netherlands (%)
Place of birth for the foreign-born population - Switzerland (%)
Place of birth for the foreign-born population - Other Western Europe (%)
Place of birth for the foreign-born population - Greece (%)
Place of birth for the foreign-born population - Italy (%)
Place of birth for the foreign-born population - Portugal (%)
Place of birth for the foreign-born population - Spain (%)
Place of birth for the foreign-born population - Other Southern Europe (%)
Place of birth for the foreign-born population - Albania (%)
Place of birth for the foreign-born population - Belarus (%)
Place of birth for the foreign-born population - Bosnia and Herzegovina (%)
Place of birth for the foreign-born population - Bulgaria (%)
Place of birth for the foreign-born population - Croatia (%)
Place of birth for the foreign-born population - Czechoslovakia (%)
Place of birth for the foreign-born population - Hungary (%)
Place of birth for the foreign-born population - Latvia (%)
Place of birth for the foreign-born population - Lithuania (%)
Place of birth for the foreign-born population - North Macedonia (Macedonia) (%)
Place of birth for the foreign-born population - Moldova (%)
Place of birth for the foreign-born population - Poland (%)
Place of birth for the foreign-born population - Romania (%)
Place of birth for the foreign-born population - Russia (%)
Place of birth for the foreign-born population - Serbia (%)
Place of birth for the foreign-born population - Ukraine (%)
Place of birth for the foreign-born population - Other Eastern Europe (%)
Place of birth for the foreign-born population - China (%)
Place of birth for the foreign-born population - Hong Kong (%)
Place of birth for the foreign-born population - Taiwan (%)
Place of birth for the foreign-born population - Japan (%)
Place of birth for the foreign-born population - Korea (%)
Place of birth for the foreign-born population - Other Eastern Asia (%)
Place of birth for the foreign-born population - Afghanistan (%)
Place of birth for the foreign-born population - Bangladesh (%)
Place of birth for the foreign-born population - India (%)
Place of birth for the foreign-born population - Iran (%)
Place of birth for the foreign-born population - Kazakhstan (%)
Place of birth for the foreign-born population - Nepal (%)
Place of birth for the foreign-born population - Pakistan (%)
Place of birth for the foreign-born population - Sri Lanka (%)
Place of birth for the foreign-born population - Uzbekistan (%)
Place of birth for the foreign-born population - Other South Central Asia (%)
Place of birth for the foreign-born population - Burma (%)
Place of birth for the foreign-born population - Cambodia (%)
Place of birth for the foreign-born population - Indonesia (%)
Place of birth for the foreign-born population - Laos (%)
Place of birth for the foreign-born population - Malaysia (%)
Place of birth for the foreign-born population - Philippines (%)
Place of birth for the foreign-born population - Singapore (%)
Place of birth for the foreign-born population - Thailand (%)
Place of birth for the foreign-born population - Vietnam (%)
Place of birth for the foreign-born population - Other South Eastern Asia (%)
Place of birth for the foreign-born population - Armenia (%)
Place of birth for the foreign-born population - Iraq (%)
Place of birth for the foreign-born population - Israel (%)
Place of birth for the foreign-born population - Jordan (%)
Place of birth for the foreign-born population - Kuwait (%)
Place of birth for the foreign-born population - Lebanon (%)
Place of birth for the foreign-born population - Saudi Arabia (%)
Place of birth for the foreign-born population - Syria (%)
Place of birth for the foreign-born population - Turkey (%)
Place of birth for the foreign-born population - Yemen (%)
Place of birth for the foreign-born population - Other Western Asia (%)
Place of birth for the foreign-born population - Eritrea (%)
Place of birth for the foreign-born population - Ethiopia (%)
Place of birth for the foreign-born population - Kenya (%)
Place of birth for the foreign-born population - Somalia (%)
Place of birth for the foreign-born population - Uganda (%)
Place of birth for the foreign-born population - Zimbabwe (%)
Place of birth for the foreign-born population - Other Eastern Africa (%)
Place of birth for the foreign-born population - Cameroon (%)
Place of birth for the foreign-born population - Congo (%)
Place of birth for the foreign-born population - Democratic Republic of Congo (Zaire) (%)
Place of birth for the foreign-born population - Other Middle Africa (%)
Place of birth for the foreign-born population - Egypt (%)
Place of birth for the foreign-born population - Morocco (%)
Place of birth for the foreign-born population - Sudan (%)
Place of birth for the foreign-born population - Other Northern Africa (%)
Place of birth for the foreign-born population - South Africa (%)
Place of birth for the foreign-born population - Other Southern Africa (%)
Place of birth for the foreign-born population - Cabo Verde (%)
Place of birth for the foreign-born population - Ghana (%)
Place of birth for the foreign-born population - Liberia (%)
Place of birth for the foreign-born population - Nigeria (%)
Place of birth for the foreign-born population - Senegal (%)
Place of birth for the foreign-born population - Sierra Leone (%)
Place of birth for the foreign-born population - Other Western Africa (%)
Place of birth for the foreign-born population - Australia (%)
Place of birth for the foreign-born population - New Zealand (%)
Place of birth for the foreign-born population - Fiji (%)
Place of birth for the foreign-born population - Micronesia (%)
Place of birth for the foreign-born population - Bahamas (%)
Place of birth for the foreign-born population - Barbados (%)
Place of birth for the foreign-born population - Cuba (%)
Place of birth for the foreign-born population - Dominica (%)
Place of birth for the foreign-born population - Dominican Republic (%)
Place of birth for the foreign-born population - Grenada (%)
Place of birth for the foreign-born population - Haiti (%)
Place of birth for the foreign-born population - Jamaica (%)
Place of birth for the foreign-born population - St. Vincent and the Grenadines (%)
Place of birth for the foreign-born population - Trinidad and Tobago (%)
Place of birth for the foreign-born population - West Indies (%)
Place of birth for the foreign-born population - Other Caribbean (%)
Place of birth for the foreign-born population - Belize (%)
Place of birth for the foreign-born population - Costa Rica (%)
Place of birth for the foreign-born population - El Salvador (%)
Place of birth for the foreign-born population - Guatemala (%)
Place of birth for the foreign-born population - Honduras (%)
Place of birth for the foreign-born population - Mexico (%)
Place of birth for the foreign-born population - Nicaragua (%)
Place of birth for the foreign-born population - Panama (%)
Place of birth for the foreign-born population - Other Central America (%)
Place of birth for the foreign-born population - Argentina (%)
Place of birth for the foreign-born population - Bolivia (%)
Place of birth for the foreign-born population - Brazil (%)
Place of birth for the foreign-born population - Chile (%)
Place of birth for the foreign-born population - Colombia (%)
Place of birth for the foreign-born population - Ecuador (%)
Place of birth for the foreign-born population - Guyana (%)
Place of birth for the foreign-born population - Peru (%)
Place of birth for the foreign-born population - Uruguay (%)
Place of birth for the foreign-born population - Venezuela (%)
Place of birth for the foreign-born population - Other South America (%)
Place of birth for the foreign-born population - Canada (%)
Place of birth for the foreign-born population - Other Northern America (%)
Place of birth for the foreign-born population - Other (%)
Latest news about races in Ridgewood, NJ collected exclusively by city-data.com from local newspapers, TV, and radio stations
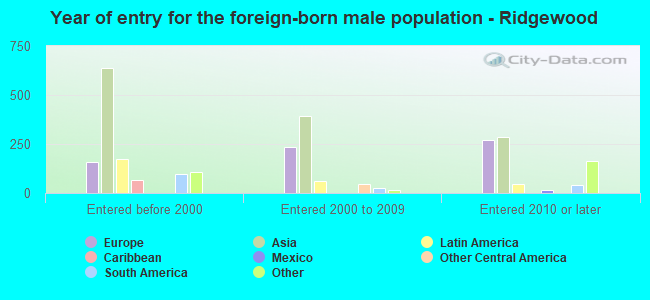
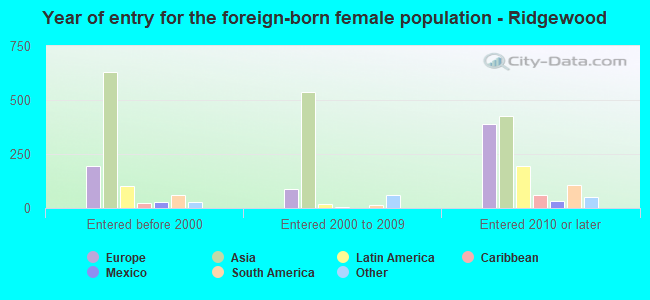
According to 2022 data, the most numerous races in Ridgewood, NJ are White alone (17,717 residents), Hispanic (2,194 residents), and Black alone (436 residents). 75.1% of Ridgewood residents speak English at home. 20.1% of Ridgewood, NJ residents are foreign-born (10.6% born in Asia, 5.4% born in Europe, 2.2% born in Latin America), which is 14.4% less than the foreign-born rate of 23.0% across the entire state of New Jersey.
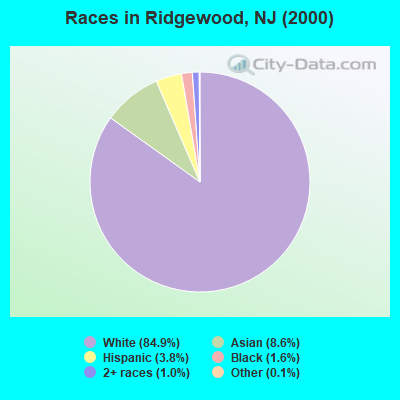
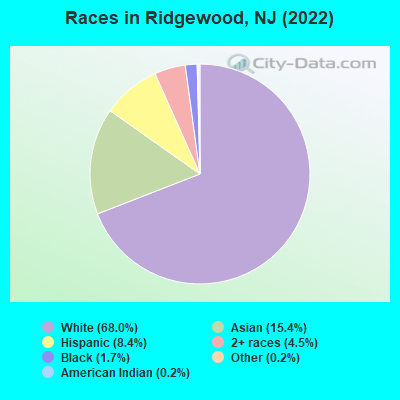
Race distribution in Ridgewood
2000 2022
5,557,209 66.0% White alone 1,117,191 13.3% Hispanic 1,096,171 13.0% Black alone 477,012 5.7% Asian alone 133,689 1.6% Two or more races 19,565 0.2% Other race alone 11,338 0.1% American Indian alone 2,175 0.03% Native Hawaiian and Other
4,766,476 51.5% White alone 2,028,470 21.9% Hispanic 1,111,632 12.0% Black alone 923,546 10.0% Asian alone 332,237 3.6% Two or more races 89,847 1.0% Other race alone 8,557 0.09% American Indian alone 934 0.01% Native Hawaiian and Other
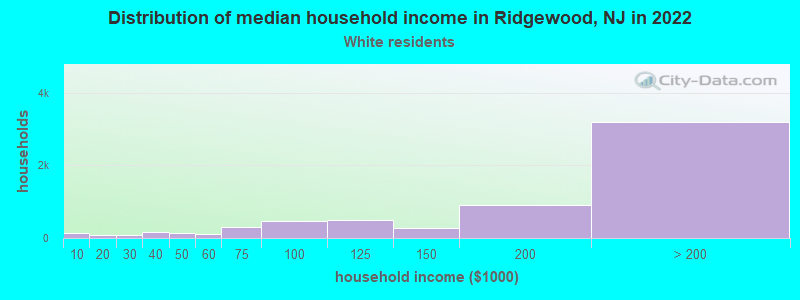
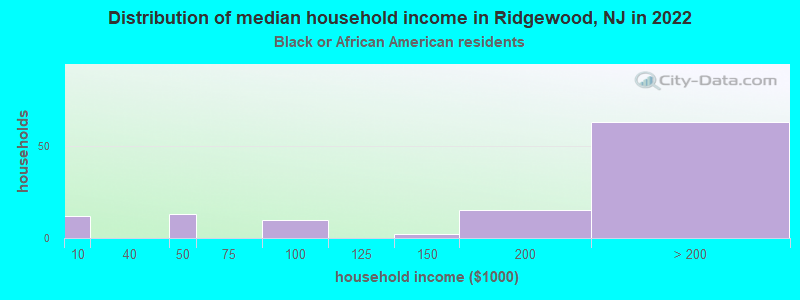
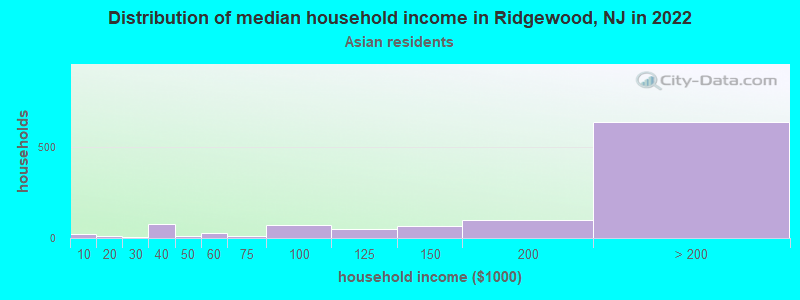
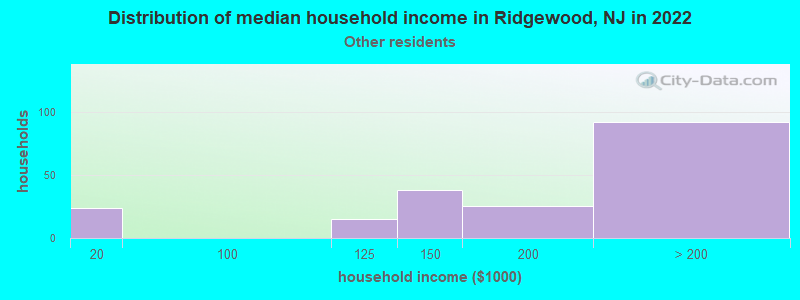
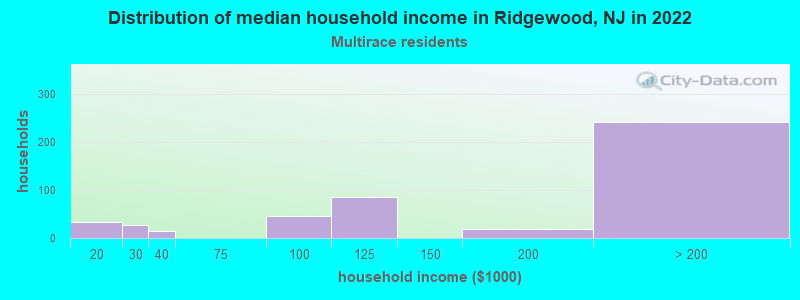
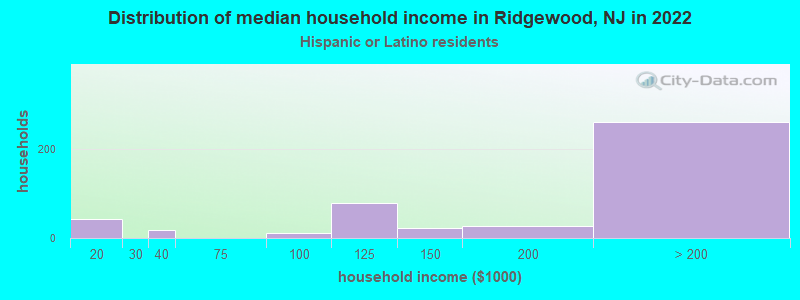
Income and house value in Ridgewood Median household income in 2022 over $200,000 White non-Hispanic householdersover $200,000 Black householdersover $200,000 Asian householdersover $200,000 Some other race householders$192,745 Two or more races householdersover $200,000 Hispanic or Latino race householdersMedian 2022 house value $914,250 White Non-Hispanic householders$554,434 Black or African American householders $744,189 Asian householders$810,916 Some other race householders$553,971 Two or more races householders$743,957 Hispanic or Latino householders
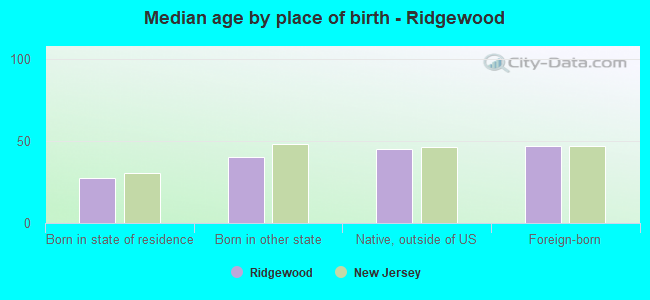
Median age by race in Ridgewood
45.3 Median age for White residents44.8 45.7 40.0 Median age for Black or African American residents40.7 44.6 49.1 Median age for American Indian / Alaska Native residents-686,322,685.6 48.2 40.7 Median age for Asian residents40.3 42.0 -510,460,250.5 Median age for Native Hawaiian / Pacific Islander residents-514,767,932.0 -713,070,378.3 45.6 Median age for Other race residents50.9 43.8 20.7 Median age for Two or more races residents18.8 28.3 44.8 Median age for White alone residents44.3 45.3 28.6 Median age for Hispanic or Latino residents31.1 18.9
Owner/renter occupied households by race in Ridgewood
House owners and renters - White residents 5,608 85.8% Owner occupied928 14.2% Renter occupiedHouse owners and renters - Black or African American residents 96 87.1% Owner occupied14 12.9% Renter occupiedHouse owners and renters - American Indian / Alaska Native residents 55 100.0% Owner occupiedHouse owners and renters - Asian residents 893 80.7% Owner occupied213 19.3% Renter occupiedHouse owners and renters - Other race residents 146 74.2% Owner occupied51 25.8% Renter occupiedHouse owners and renters - Two or more races residents 310 65.9% Owner occupied160 34.1% Renter occupiedHouse owners and renters - White alone residents 5,740 84.4% Owner occupied1,061 15.6% Renter occupiedHouse owners and renters - Hispanic or Latino residents 364 76.1% Owner occupied114 23.9% Renter occupied
Language usage in Ridgewood
English speakers - Total 75.1% of residents of Ridgewood speak English at home.
3.5% of residents speak Spanish at home 627 72.2% Speak English very well242 27.8% Speak English less than very well19.9% of residents speak other language at home 3,505 71.7% Speak English very well1,383 28.3% Speak English less than very well
English speakers - Born in the United States 84.9% of residents of Ridgewood speak English at home.
2.7% of residents speak Spanish at home 175 71.1% Speak English very well71 28.9% Speak English less than very well11.1% of residents speak other language at home 1,007 97.9% Speak English very well22 2.1% Speak English less than very well
English speakers - Native, born elsewhere 71.4% of residents of Ridgewood speak English at home.
7.3% of residents speak Spanish at home 58 100.0% Speak English very well17.5% of residents speak other language at home 67 48.2% Speak English very well72 51.8% Speak English less than very well
English speakers - Foreign-born 27.8% of residents of Ridgewood speak English at home.
6.5% of residents speak Spanish at home 252 75.4% Speak English very well82 24.6% Speak English less than very well63.9% of residents speak other language at home 2,018 61.5% Speak English very well1,264 38.5% Speak English less than very well
White (Caucasian) - Speak only English Native:
95.7% (14,201)Foreign-born:
51.5% (785)
White (Caucasian) - Speak another language Native:
5.7% (845)Foreign-born:
55.5% (846)
Black or African American - Speak only English Native:
99.9% (286)Foreign-born:
100.0% (125)
American Indian / Alaska Native - Speak only English Native:
5.8% (3)Foreign-born:
13.4% (2)
American Indian / Alaska Native - Speak another language Native:
100.0% (51)Foreign-born:
83.5% (11)
Asian - Speak only English Native:
61.2% (720)Foreign-born:
14.4% (351)
Asian - Speak another language Native:
39.5% (465)Foreign-born:
85.5% (2,085)
Other race - Speak another language Native:
42.5% (98)Foreign-born:
100.0% (213)
Two or more races - Speak only English Native:
73.7% (1,590)Foreign-born:
29.8% (119)
Two or more races - Speak another language Native:
24.2% (523)Foreign-born:
67.2% (268)
White alone - Speak only English Native:
93.4% (14,136)Foreign-born:
42.1% (777)
White alone - Speak another language Native:
6.7% (1,007)Foreign-born:
57.3% (1,057)
Hispanic or Latino - Speak only English Native:
65.1% (939)Foreign-born:
19.9% (99)
Hispanic or Latino - Speak another language Native:
29.4% (424)Foreign-born:
81.9% (406)
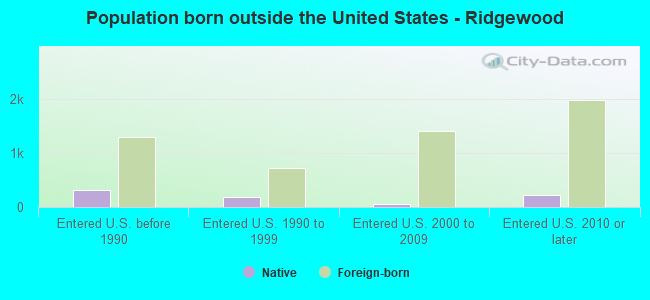
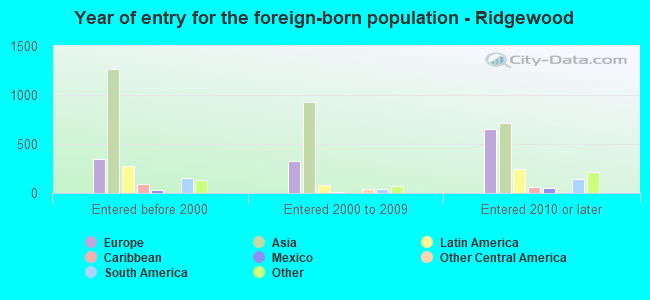
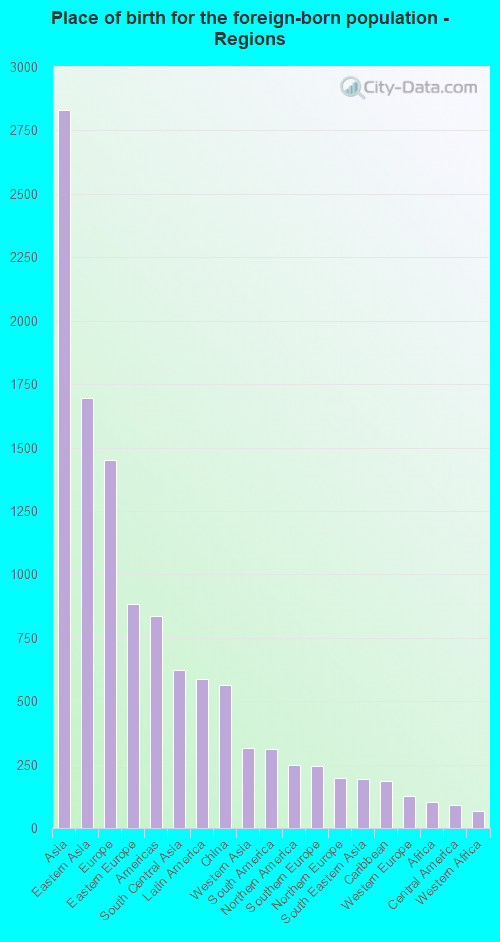
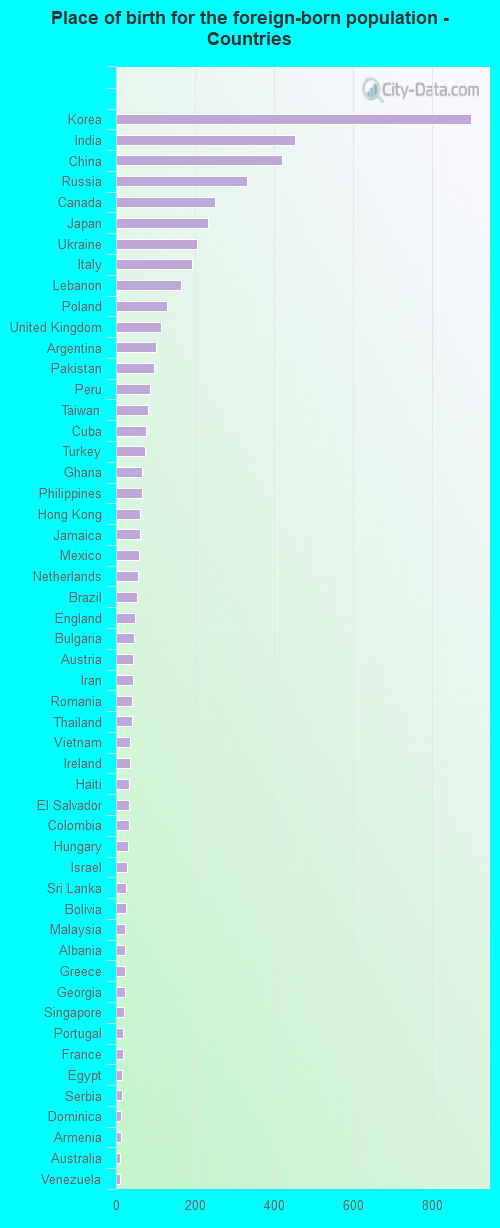
Foreign-born residents in Ridgewood 5,234 residents are foreign born (10.6% Asia , 5.4% Europe , 2.2% Latin America ).
This city:
20.1%New Jersey:
23.2%
Marital status for residents in Ridgewood Marital status - White (Caucasian) population 15 years and over
Males 28.1% Never married61.6% Now married0.7% Separated5.8% Widowed3.7% DivorcedFemales 25.7% Never married58.1% Now married0.9% Separated6.9% Widowed8.5% DivorcedWomen who gave birth in the past 12 months Now married:
100.0% (59)Unmarried:
0.0% (0)
Women who did not give birth in the past 12 months Now married:
51.9% (1,626)Unmarried:
48.1% (1,510)
Marital status - Black or African American population 15 years and over
Males 64.0% Never married26.7% Now married0.0% Separated9.3% Widowed0.0% DivorcedFemales 29.2% Never married41.6% Now married1.3% Separated1.7% Widowed26.2% DivorcedWomen who did not give birth in the past 12 months Now married:
53.0% (63)Unmarried:
47.0% (56)
Marital status - American Indian / Alaska Native population 15 years and over
Males 100.0% Never married0.0% Now married0.0% Separated0.0% Widowed0.0% DivorcedFemales 0.0% Never married100.0% Now married0.0% Separated0.0% Widowed0.0% DivorcedWomen who did not give birth in the past 12 months Now married:
100.0% (63)Unmarried:
0.0% (0)
Marital status - Asian population 15 years and over
Males 14.1% Never married84.0% Now married1.2% Separated0.0% Widowed0.6% DivorcedFemales 20.1% Never married67.6% Now married2.0% Separated4.3% Widowed6.1% DivorcedWomen who gave birth in the past 12 months Now married:
100.0% (64)Unmarried:
0.0% (0)
Women who did not give birth in the past 12 months Now married:
67.2% (734)Unmarried:
32.8% (358)
Marital status - Other race population 15 years and over
Males 0.9% Never married90.0% Now married0.0% Separated0.0% Widowed9.1% DivorcedFemales 10.9% Never married89.1% Now married0.0% Separated0.0% Widowed0.0% DivorcedWomen who did not give birth in the past 12 months Now married:
80.0% (85)Unmarried:
20.0% (21)
Marital status - Two or more races population 15 years and over
Males 49.8% Never married50.2% Now married0.0% Separated0.0% Widowed0.0% DivorcedFemales 36.7% Never married57.6% Now married1.2% Separated0.0% Widowed4.5% DivorcedWomen who gave birth in the past 12 months Now married:
100.0% (25)Unmarried:
0.0% (0)
Women who did not give birth in the past 12 months Now married:
54.4% (496)Unmarried:
45.6% (416)
Marital status - White alone, not Hispanic / Latino population 15 years and over
Males 28.5% Never married60.9% Now married0.8% Separated6.0% Widowed3.8% DivorcedFemales 25.1% Never married58.5% Now married0.9% Separated7.1% Widowed8.4% DivorcedWomen who gave birth in the past 12 months Now married:
100.0% (68)Unmarried:
0.0% (0)
Women who did not give birth in the past 12 months Now married:
52.6% (1,809)Unmarried:
47.4% (1,627)
Marital status - Hispanic or Latino population 15 years and over
Males 22.1% Never married76.3% Now married0.0% Separated0.0% Widowed1.7% DivorcedFemales 34.2% Never married57.3% Now married0.0% Separated0.0% Widowed8.5% DivorcedWomen who gave birth in the past 12 months Now married:
100.0% (18)Unmarried:
0.0% (0)
Women who did not give birth in the past 12 months Now married:
48.0% (268)Unmarried:
52.0% (290)
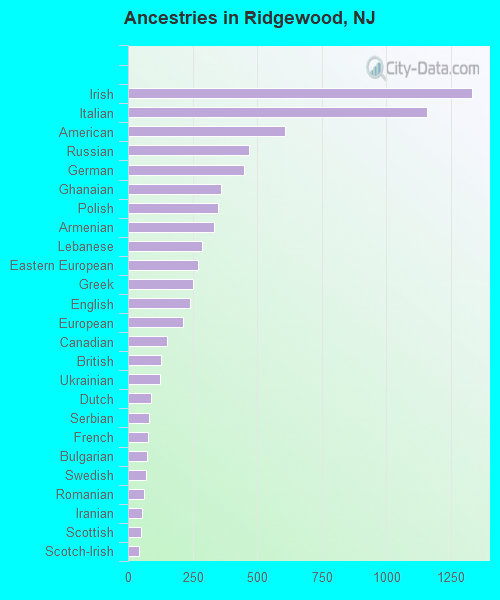
Ancestries in Ridgewood
1,332 10.5% Irish1,160 9.2% Italian607 4.8% American467 3.7% Russian449 3.6% German361 2.9% Ghanaian347 2.7% Polish333 2.6% Armenian285 2.3% Lebanese271 2.1% Eastern European253 2.0% Greek242 1.9% English213 1.7% European152 1.2% Canadian126 1.0% British123 1.0% Ukrainian90 0.7% Dutch83 0.7% Serbian79 0.6% French75 0.6% Bulgarian71 0.6% Swedish63 0.5% Romanian56 0.4% Iranian50 0.4% Scottish44 0.3% Scotch-Irish44 0.3% Jamaican43 0.3% Slovene41 0.3% Austrian33 0.3% Albanian26 0.2% Turkish24 0.2% Norwegian24 0.2% Brazilian20 0.2% Czech20 0.2% Croatian19 0.2% Hungarian19 0.2% Northern European18 0.1% Portuguese15 0.1% Scandinavian13 0.1% Syrian13 0.1% Israeli13 0.1% Slovak12 0.10% Lithuanian10 0.08% Sierra Leonean10 0.08% Czechoslovakian9 0.07% Palestinian8 0.06% Danish8 0.06% Maltese8 0.06% West Indian6 0.05% Guyanese4 0.03% French Canadian2 0.02% Egyptian2 0.02% Australian
Geographical mobility in Ridgewood Same house 1 year ago 14,628 87.4% White (Caucasian)407 89.6% Black or African American24 28.3% American Indian / Alaska Native3,194 81.3% Asian392 85.1% Other race2,747 92.8% Two or more races15,475 87.6% White alone, not Hispanic / Latino1,880 86.2% Hispanic or LatinoMoved within same county 1,739 10.4% White / Caucasian9 2.0% Black or African American87 100.0% American Indian / Alaska Native456 11.6% Asian18 4.0% Other race66 2.2% Two or more races1,852 10.5% White alone, not Hispanic / Latino69 3.1% Hispanic or LatinoMoved within same state 64 0.4% White / Caucasian50 11.0% Black or African American136 3.5% Asian44 9.5% Other race62 2.1% Two or more races75 0.4% White alone, not Hispanic / Latino91 4.2% Hispanic or LatinoMoved from different state 387 2.3% White / Caucasian9 0.2% Asian24 0.8% Two or more races340 1.9% White alone, not Hispanic / Latino69 3.2% Hispanic or LatinoMoved from abroad 53 0.3% White117 3.0% Asian63 2.1% Two or more races16 0.1% White alone, not Hispanic / Latino72 3.3% Hispanic or Latino
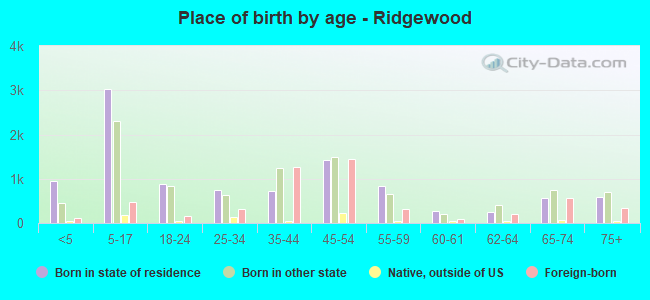
Children Nativity (place of birth) in Ridgewood
Children under 6 years - Living with two parents Both parents native 897 100.0% NativeBoth parents foreign-born 546 82.9% Native112 17.1% Foreign-bornOne native, one foreign-born parent 235 100.0% NativeChildren under 6 years - Living with one parent Native parent 78 100.0% NativeChildren 6 to 17 years - Living with two parents Both parents native 2,732 98.7% Native37 1.3% Foreign-bornBoth parents foreign-born 859 69.0% Native386 31.0% Foreign-bornOne native, one foreign-born parent 753 100.0% NativeChildren 6 to 17 years - Living with one parent Native parent 595 100.0% NativeForeign-born parent 64 49.5% Native66 50.5% Foreign-born