Races in Rio Rico Southeast, Arizona (AZ) Detailed Stats
Ancestries, Foreign-born residents, place of birth

Discuss Rio Rico Southeast, Arizona races on our local forum with over 2,400,000 registered users
43.9% of Rio Rico Southeast, AZ residents are foreign-born (43.9% born in Latin America), which is 70.4% greater than the foreign-born rate of 13.0% across the entire state of Arizona.
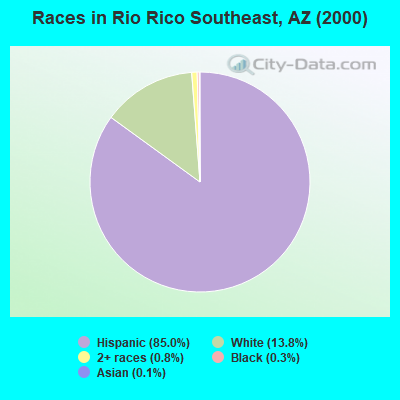
Race distribution in Rio Rico Southeast

- 1,35285.0%Hispanic
- 21913.8%White alone
- 130.8%Two or more races
- 40.3%Black alone
- 20.1%Asian alone
2000
2022
-
- 3,274,25863.8%White alone
- 1,295,61725.3%Hispanic
- 233,3704.5%American Indian alone
- 149,9412.9%Black alone
- 89,3151.7%Asian alone
- 76,3721.5%Two or more races
- 6,1200.1%Other race alone
- 5,6390.1%Native Hawaiian and Other
Pacific Islander alone

-
- 3,814,58751.8%White alone
- 2,388,52032.5%Hispanic
- 322,4594.4%Black alone
- 284,9943.9%Two or more races
- 257,0203.5%Asian alone
- 241,6883.3%American Indian alone
- 36,0420.5%Other race alone
- 13,8870.2%Native Hawaiian and Other
Pacific Islander alone

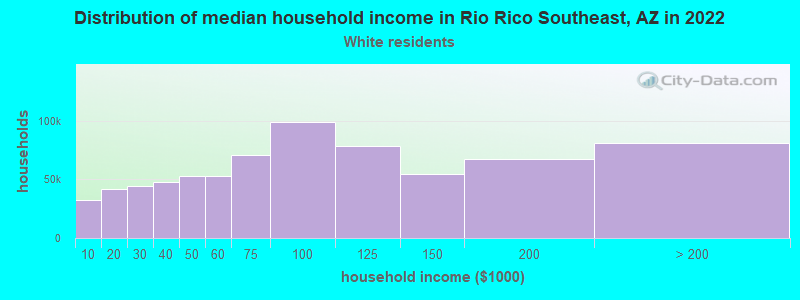
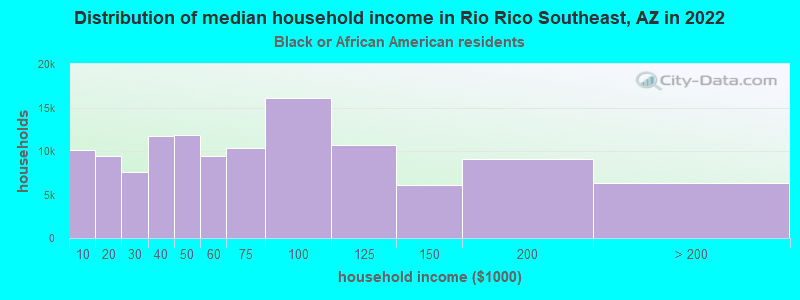
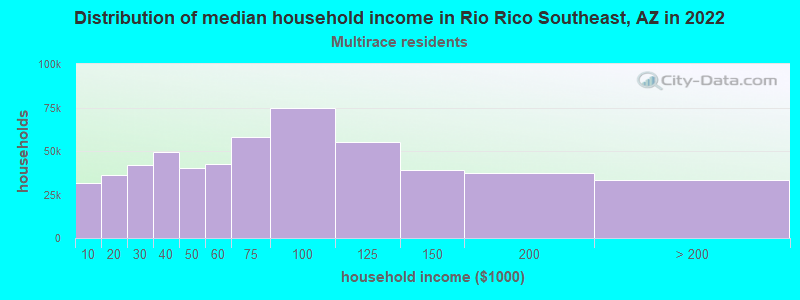
Income and house value in Rio Rico Southeast
- Median household income in 2022
- $80,546White non-Hispanic householders
- $82,624Black householders
- $73,215Some other race householders
- $179,631Two or more races householders
- $66,960Hispanic or Latino race householders
- Median 2022 house value
- $396,908White Non-Hispanic householders
- $329,161Black or African American householders
- $316,643Some other race householders
- $239,323Two or more races householders
- $342,048Hispanic or Latino householders
Household income for White non-Hispanic householders
Household income for Black householders
Household income for Two or more races householders
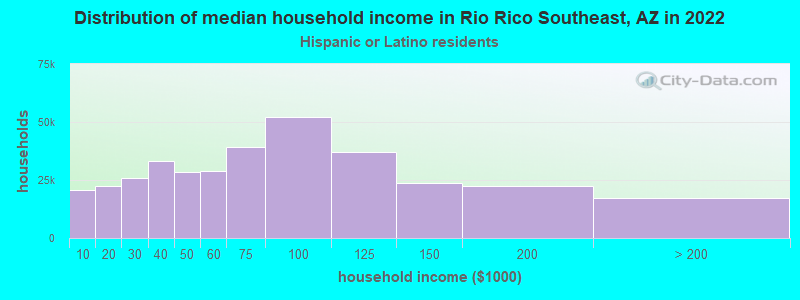
Household income for Hispanic or Latino race householders
Foreign-born residents in Rio Rico Southeast
698 residents are foreign born (43.9% Latin America).
| This city: | 43.9% |
| Arizona: | 12.8% |
Ancestries in Rio Rico Southeast

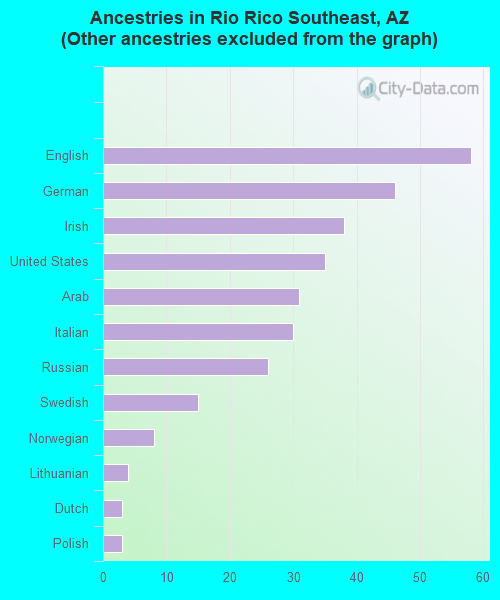
- 1,38582.3%Other
- 583.4%English
- 462.7%German
- 382.3%Irish
- 352.1%United States
- 311.8%Arab
- 301.8%Italian
- 261.5%Russian
- 150.9%Swedish
- 80.5%Norwegian
- 40.2%Lithuanian
- 30.2%Dutch
- 30.2%Polish
Zip codes: 85648.