Races in River Grove, Illinois (IL) Detailed Stats
Data:
Races - White alone (%)
Races - White alone (% change since 2000)
Races - Black alone (%)
Races - Black alone (% change since 2000)
Races - American Indian alone (%)
Races - American Indian alone (% change since 2000)
Races - Asian alone (%)
Races - Asian alone (% change since 2000)
Races - Hispanic (%)
Races - Hispanic (% change since 2000)
Races - Native Hawaiian and Other Pacific Islander alone (%)
Races - Native Hawaiian and Other Pacific Islander alone (% change since 2000)
Races - Two or more races(%)
Races - Two or more races(% change since 2000)
Races - Other race alone (%)
Races - Other race alone (% change since 2000)
Racial diversity
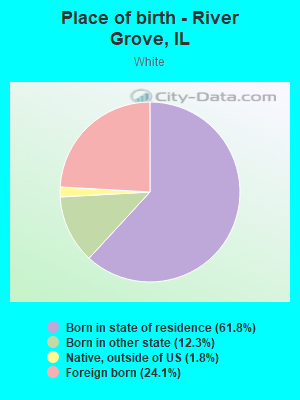
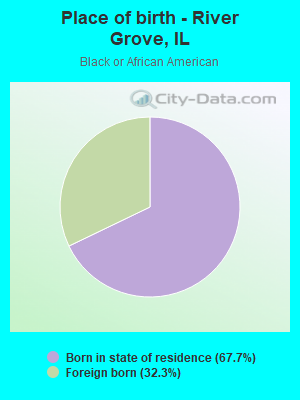
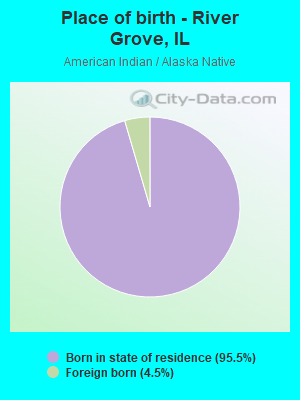
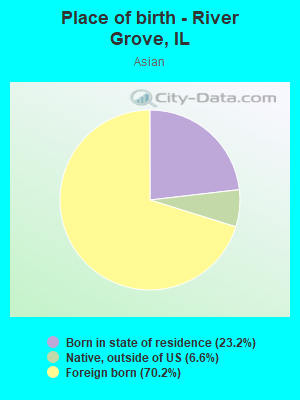
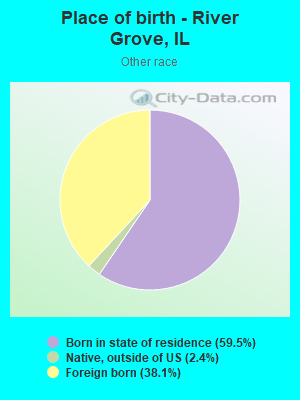
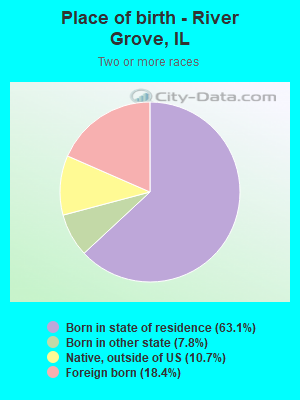
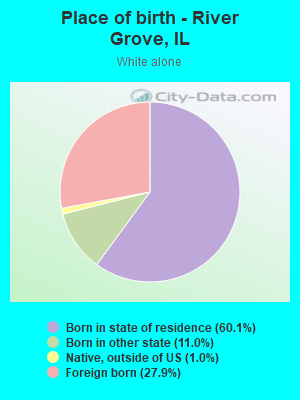
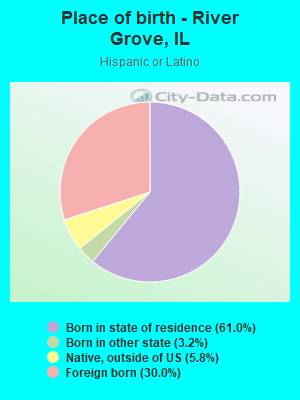
Place of birth - Born in state of residence (%)
Place of birth - Born in state of residence (%) - White
Place of birth - Born in state of residence (%) - Black or African American
Place of birth - Born in state of residence (%) - Asian
Place of birth - Born in state of residence (%) - Hispanic or Latino
Place of birth - Born in state of residence (%) - American Indian and Alaska Native
Place of birth - Born in state of residence (%) - Multirace
Place of birth - Born in state of residence (%) - Other Race
Place of birth - Born in other state (%)
Place of birth - Born in other state (%) - White
Place of birth - Born in other state (%) - Black or African American
Place of birth - Born in other state (%) - Asian
Place of birth - Born in other state (%) - Hispanic or Latino
Place of birth - Born in other state (%) - American Indian and Alaska Native
Place of birth - Born in other state (%) - Multirace
Place of birth - Born in other state (%) - Other Race
Place of birth - Native, outside of US (%)
Place of birth - Native, outside of US (%) - White
Place of birth - Native, outside of US (%) - Black or African American
Place of birth - Native, outside of US (%) - Asian
Place of birth - Native, outside of US (%) - Hispanic or Latino
Place of birth - Native, outside of US (%) - American Indian and Alaska Native
Place of birth - Native, outside of US (%) - Multirace
Place of birth - Native, outside of US (%) - Other Race
Place of birth - Foreign born (%)
Place of birth - Foreign born (%) - White
Place of birth - Foreign born (%) - Black or African American
Place of birth - Foreign born (%) - Asian
Place of birth - Foreign born (%) - Hispanic or Latino
Place of birth - Foreign born (%) - American Indian and Alaska Native
Place of birth - Foreign born (%) - Multirace
Place of birth - Foreign born (%) - Other Race
Residents speaking English at home (%)
Residents speaking English at home - Born in the United States (%)
Residents speaking English at home - Native, born elsewhere (%)
Residents speaking English at home - Foreign born (%)
Residents speaking Spanish at home (%)
Residents speaking Spanish at home - Born in the United States (%)
Residents speaking Spanish at home - Native, born elsewhere (%)
Residents speaking Spanish at home - Foreign born (%)
Residents speaking other language at home (%)
Residents speaking other language at home - Born in the United States (%)
Residents speaking other language at home - Native, born elsewhere (%)
Residents speaking other language at home - Foreign born (%)
Marital status - Never married (%)
Marital status - Now married (%)
Marital status - Separated (%)
Marital status - Widowed (%)
Marital status - Divorced (%)
Ancestries Reported - Arab (%)
Ancestries Reported - Czech (%)
Ancestries Reported - Danish (%)
Ancestries Reported - Dutch (%)
Ancestries Reported - English (%)
Ancestries Reported - French (%)
Ancestries Reported - French Canadian (%)
Ancestries Reported - German (%)
Ancestries Reported - Greek (%)
Ancestries Reported - Hungarian (%)
Ancestries Reported - Irish (%)
Ancestries Reported - Italian (%)
Ancestries Reported - Lithuanian (%)
Ancestries Reported - Norwegian (%)
Ancestries Reported - Polish (%)
Ancestries Reported - Portuguese (%)
Ancestries Reported - Russian (%)
Ancestries Reported - Scotch-Irish (%)
Ancestries Reported - Scottish (%)
Ancestries Reported - Slovak (%)
Ancestries Reported - Subsaharan African (%)
Ancestries Reported - Swedish (%)
Ancestries Reported - Swiss (%)
Ancestries Reported - Ukrainian (%)
Ancestries Reported - United States (%)
Ancestries Reported - Welsh (%)
Ancestries Reported - West Indian (%)
Ancestries Reported - Other (%)
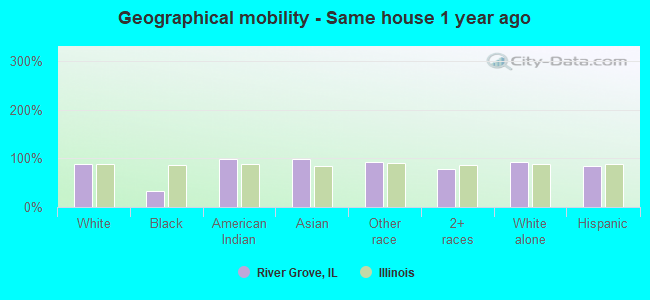
Geographical mobility - Same house 1 year ago (%)
Geographical mobility - Same house 1 year ago (%) - White
Geographical mobility - Same house 1 year ago (%) - Black or African American
Geographical mobility - Same house 1 year ago (%) - Asian
Geographical mobility - Same house 1 year ago (%) - Hispanic or Latino
Geographical mobility - Same house 1 year ago (%) - American Indian and Alaska Native
Geographical mobility - Same house 1 year ago (%) - Multirace
Geographical mobility - Same house 1 year ago (%) - Other Race
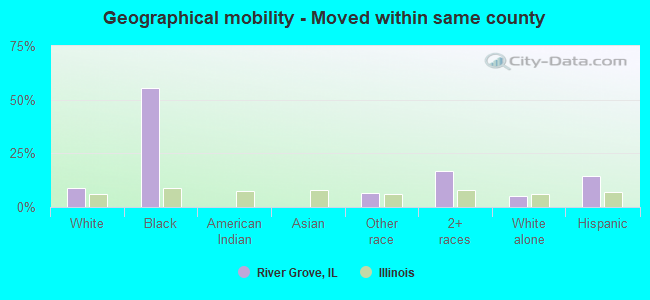
Geographical mobility - Moved within same county (%)
Geographical mobility - Moved within same county (%) - White
Geographical mobility - Moved within same county (%) - Black or African American
Geographical mobility - Moved within same county (%) - Asian
Geographical mobility - Moved within same county (%) - Hispanic or Latino
Geographical mobility - Moved within same county (%) - American Indian and Alaska Native
Geographical mobility - Moved within same county (%) - Multirace
Geographical mobility - Moved within same county (%) - Other Race
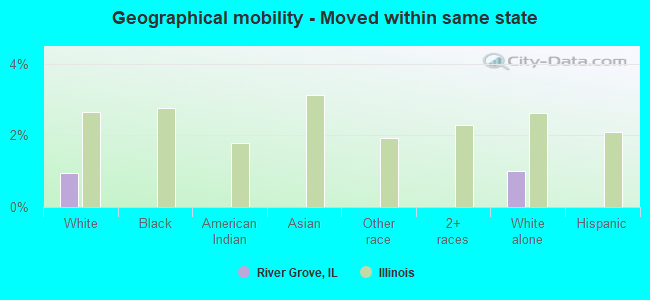
Geographical mobility - Moved from different county within same state (%)
Geographical mobility - Moved from different county within same state (%) - White
Geographical mobility - Moved from different county within same state (%) - Black or African American
Geographical mobility - Moved from different county within same state (%) - Asian
Geographical mobility - Moved from different county within same state (%) - Hispanic or Latino
Geographical mobility - Moved from different county within same state (%) - American Indian and Alaska Native
Geographical mobility - Moved from different county within same state (%) - Multirace
Geographical mobility - Moved from different county within same state (%) - Other Race
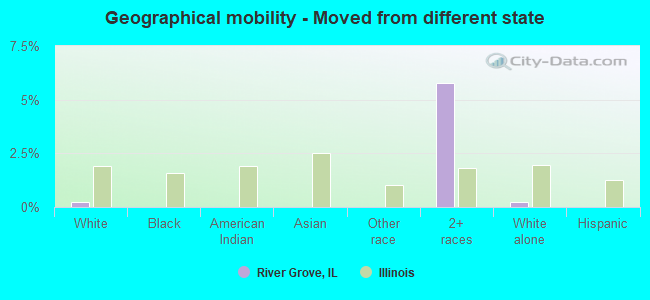
Geographical mobility - Moved from different state (%)
Geographical mobility - Moved from different state (%) - White
Geographical mobility - Moved from different state (%) - Black or African American
Geographical mobility - Moved from different state (%) - Asian
Geographical mobility - Moved from different state (%) - Hispanic or Latino
Geographical mobility - Moved from different state (%) - American Indian and Alaska Native
Geographical mobility - Moved from different state (%) - Multirace
Geographical mobility - Moved from different state (%) - Other Race
Geographical mobility - Moved from abroad (%)
Geographical mobility - Moved from abroad (%) - White
Geographical mobility - Moved from abroad (%) - Black or African American
Geographical mobility - Moved from abroad (%) - Asian
Geographical mobility - Moved from abroad (%) - Hispanic or Latino
Geographical mobility - Moved from abroad (%) - American Indian and Alaska Native
Geographical mobility - Moved from abroad (%) - Multirace
Geographical mobility - Moved from abroad (%) - Other Race
Place of birth for the foreign-born population - Ireland (%)
Place of birth for the foreign-born population - Denmark (%)
Place of birth for the foreign-born population - Norway (%)
Place of birth for the foreign-born population - Sweden (%)
Place of birth for the foreign-born population - United Kingdom (%)
Place of birth for the foreign-born population - England (%)
Place of birth for the foreign-born population - Scotland (%)
Place of birth for the foreign-born population - Other Northern Europe (%)
Place of birth for the foreign-born population - Austria (%)
Place of birth for the foreign-born population - Belgium (%)
Place of birth for the foreign-born population - France (%)
Place of birth for the foreign-born population - Germany (%)
Place of birth for the foreign-born population - Netherlands (%)
Place of birth for the foreign-born population - Switzerland (%)
Place of birth for the foreign-born population - Other Western Europe (%)
Place of birth for the foreign-born population - Greece (%)
Place of birth for the foreign-born population - Italy (%)
Place of birth for the foreign-born population - Portugal (%)
Place of birth for the foreign-born population - Spain (%)
Place of birth for the foreign-born population - Other Southern Europe (%)
Place of birth for the foreign-born population - Albania (%)
Place of birth for the foreign-born population - Belarus (%)
Place of birth for the foreign-born population - Bosnia and Herzegovina (%)
Place of birth for the foreign-born population - Bulgaria (%)
Place of birth for the foreign-born population - Croatia (%)
Place of birth for the foreign-born population - Czechoslovakia (%)
Place of birth for the foreign-born population - Hungary (%)
Place of birth for the foreign-born population - Latvia (%)
Place of birth for the foreign-born population - Lithuania (%)
Place of birth for the foreign-born population - North Macedonia (Macedonia) (%)
Place of birth for the foreign-born population - Moldova (%)
Place of birth for the foreign-born population - Poland (%)
Place of birth for the foreign-born population - Romania (%)
Place of birth for the foreign-born population - Russia (%)
Place of birth for the foreign-born population - Serbia (%)
Place of birth for the foreign-born population - Ukraine (%)
Place of birth for the foreign-born population - Other Eastern Europe (%)
Place of birth for the foreign-born population - China (%)
Place of birth for the foreign-born population - Hong Kong (%)
Place of birth for the foreign-born population - Taiwan (%)
Place of birth for the foreign-born population - Japan (%)
Place of birth for the foreign-born population - Korea (%)
Place of birth for the foreign-born population - Other Eastern Asia (%)
Place of birth for the foreign-born population - Afghanistan (%)
Place of birth for the foreign-born population - Bangladesh (%)
Place of birth for the foreign-born population - India (%)
Place of birth for the foreign-born population - Iran (%)
Place of birth for the foreign-born population - Kazakhstan (%)
Place of birth for the foreign-born population - Nepal (%)
Place of birth for the foreign-born population - Pakistan (%)
Place of birth for the foreign-born population - Sri Lanka (%)
Place of birth for the foreign-born population - Uzbekistan (%)
Place of birth for the foreign-born population - Other South Central Asia (%)
Place of birth for the foreign-born population - Burma (%)
Place of birth for the foreign-born population - Cambodia (%)
Place of birth for the foreign-born population - Indonesia (%)
Place of birth for the foreign-born population - Laos (%)
Place of birth for the foreign-born population - Malaysia (%)
Place of birth for the foreign-born population - Philippines (%)
Place of birth for the foreign-born population - Singapore (%)
Place of birth for the foreign-born population - Thailand (%)
Place of birth for the foreign-born population - Vietnam (%)
Place of birth for the foreign-born population - Other South Eastern Asia (%)
Place of birth for the foreign-born population - Armenia (%)
Place of birth for the foreign-born population - Iraq (%)
Place of birth for the foreign-born population - Israel (%)
Place of birth for the foreign-born population - Jordan (%)
Place of birth for the foreign-born population - Kuwait (%)
Place of birth for the foreign-born population - Lebanon (%)
Place of birth for the foreign-born population - Saudi Arabia (%)
Place of birth for the foreign-born population - Syria (%)
Place of birth for the foreign-born population - Turkey (%)
Place of birth for the foreign-born population - Yemen (%)
Place of birth for the foreign-born population - Other Western Asia (%)
Place of birth for the foreign-born population - Eritrea (%)
Place of birth for the foreign-born population - Ethiopia (%)
Place of birth for the foreign-born population - Kenya (%)
Place of birth for the foreign-born population - Somalia (%)
Place of birth for the foreign-born population - Uganda (%)
Place of birth for the foreign-born population - Zimbabwe (%)
Place of birth for the foreign-born population - Other Eastern Africa (%)
Place of birth for the foreign-born population - Cameroon (%)
Place of birth for the foreign-born population - Congo (%)
Place of birth for the foreign-born population - Democratic Republic of Congo (Zaire) (%)
Place of birth for the foreign-born population - Other Middle Africa (%)
Place of birth for the foreign-born population - Egypt (%)
Place of birth for the foreign-born population - Morocco (%)
Place of birth for the foreign-born population - Sudan (%)
Place of birth for the foreign-born population - Other Northern Africa (%)
Place of birth for the foreign-born population - South Africa (%)
Place of birth for the foreign-born population - Other Southern Africa (%)
Place of birth for the foreign-born population - Cabo Verde (%)
Place of birth for the foreign-born population - Ghana (%)
Place of birth for the foreign-born population - Liberia (%)
Place of birth for the foreign-born population - Nigeria (%)
Place of birth for the foreign-born population - Senegal (%)
Place of birth for the foreign-born population - Sierra Leone (%)
Place of birth for the foreign-born population - Other Western Africa (%)
Place of birth for the foreign-born population - Australia (%)
Place of birth for the foreign-born population - New Zealand (%)
Place of birth for the foreign-born population - Fiji (%)
Place of birth for the foreign-born population - Micronesia (%)
Place of birth for the foreign-born population - Bahamas (%)
Place of birth for the foreign-born population - Barbados (%)
Place of birth for the foreign-born population - Cuba (%)
Place of birth for the foreign-born population - Dominica (%)
Place of birth for the foreign-born population - Dominican Republic (%)
Place of birth for the foreign-born population - Grenada (%)
Place of birth for the foreign-born population - Haiti (%)
Place of birth for the foreign-born population - Jamaica (%)
Place of birth for the foreign-born population - St. Vincent and the Grenadines (%)
Place of birth for the foreign-born population - Trinidad and Tobago (%)
Place of birth for the foreign-born population - West Indies (%)
Place of birth for the foreign-born population - Other Caribbean (%)
Place of birth for the foreign-born population - Belize (%)
Place of birth for the foreign-born population - Costa Rica (%)
Place of birth for the foreign-born population - El Salvador (%)
Place of birth for the foreign-born population - Guatemala (%)
Place of birth for the foreign-born population - Honduras (%)
Place of birth for the foreign-born population - Mexico (%)
Place of birth for the foreign-born population - Nicaragua (%)
Place of birth for the foreign-born population - Panama (%)
Place of birth for the foreign-born population - Other Central America (%)
Place of birth for the foreign-born population - Argentina (%)
Place of birth for the foreign-born population - Bolivia (%)
Place of birth for the foreign-born population - Brazil (%)
Place of birth for the foreign-born population - Chile (%)
Place of birth for the foreign-born population - Colombia (%)
Place of birth for the foreign-born population - Ecuador (%)
Place of birth for the foreign-born population - Guyana (%)
Place of birth for the foreign-born population - Peru (%)
Place of birth for the foreign-born population - Uruguay (%)
Place of birth for the foreign-born population - Venezuela (%)
Place of birth for the foreign-born population - Other South America (%)
Place of birth for the foreign-born population - Canada (%)
Place of birth for the foreign-born population - Other Northern America (%)
Place of birth for the foreign-born population - Other (%)
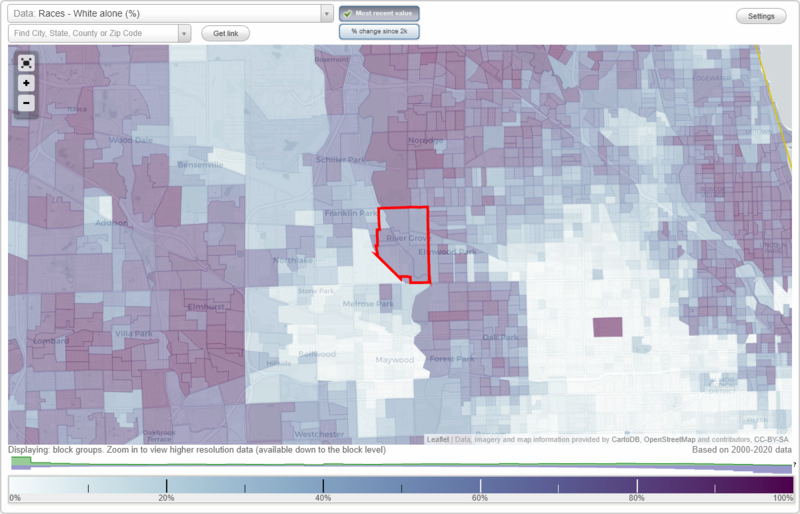
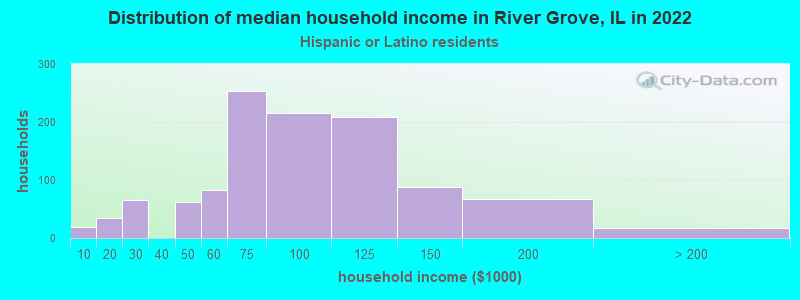
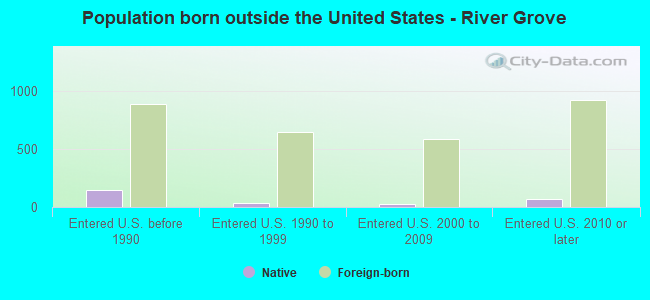
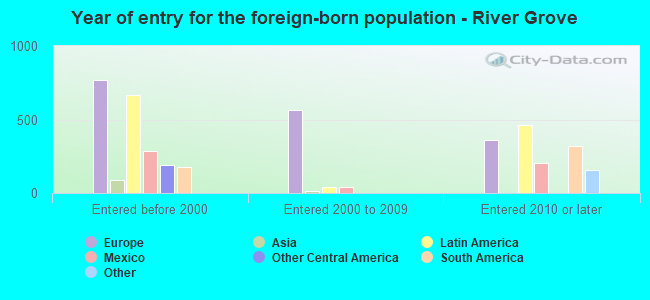
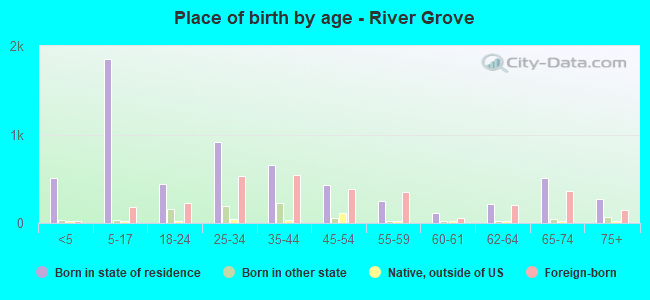
According to 2022 data, the most numerous races in River Grove, IL are White alone (6,343 residents), Hispanic (3,624 residents), and Black alone (2 residents). 50.9% of River Grove residents speak English at home. 29.4% of River Grove, IL residents are foreign-born (16.3% born in Europe, 10.3% born in Latin America), which is 52.3% greater than the foreign-born rate of 14.0% across the entire state of Illinois.
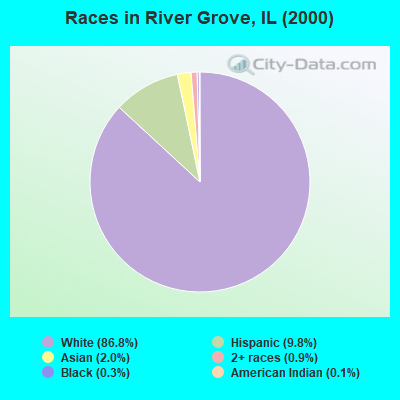
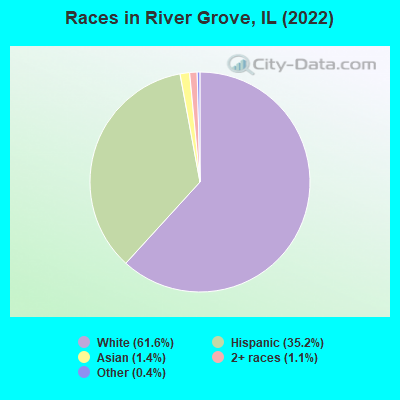
Race distribution in River Grove
2000 2022
8,424,140 67.8% White alone 1,856,152 14.9% Black alone 1,530,262 12.3% Hispanic 419,916 3.4% Asian alone 153,996 1.2% Two or more races 13,479 0.1% Other race alone 18,232 0.1% American Indian alone 3,116 0.03% Native Hawaiian and Other
7,356,301 58.5% White alone 2,299,726 18.3% Hispanic 1,660,423 13.2% Black alone 747,296 5.9% Asian alone 458,599 3.6% Two or more races 45,386 0.4% Other race alone 10,405 0.08% American Indian alone 3,896 0.03% Native Hawaiian and Other
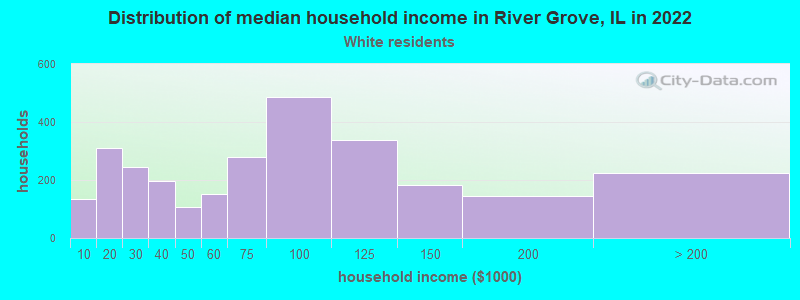
Income and house value in River Grove Median household income in 2022 $68,523 White non-Hispanic householders$67,537 Some other race householders$76,266 Two or more races householders$78,755 Hispanic or Latino race householdersMedian 2022 house value $253,160 White Non-Hispanic householders$145,199 Black or African American householders $277,587 Asian householders$269,559 Some other race householders$277,587 Two or more races householders$266,142 Hispanic or Latino householders
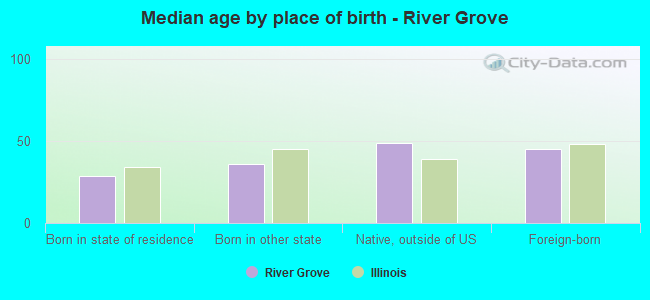
Median age by race in River Grove
37.9 Median age for White residents35.7 38.8 -672,028,596.3 Median age for Black or African American residents-674,418,604.0 -681,780,016.1 18.5 Median age for American Indian / Alaska Native residents17.2 17.7 57.1 Median age for Asian residents66.5 54.9 -687,999,999.3 Median age for Native Hawaiian / Pacific Islander residents-918,721,460.3 -610,229,276.3 29.3 Median age for Other race residents26.8 33.4 35.2 Median age for Two or more races residents27.8 41.1 37.1 Median age for White alone residents35.3 37.3 32.9 Median age for Hispanic or Latino residents29.7 34.5
Owner/renter occupied households by race in River Grove
House owners and renters - White residents 1,786 63.7% Owner occupied1,019 36.3% Renter occupiedHouse owners and renters - American Indian / Alaska Native residents 62 100.0% Owner occupiedHouse owners and renters - Asian residents 33 69.8% Owner occupied14 30.2% Renter occupiedHouse owners and renters - Other race residents 228 39.0% Owner occupied357 61.0% Renter occupiedHouse owners and renters - Two or more races residents 191 54.9% Owner occupied157 45.1% Renter occupiedHouse owners and renters - White alone residents 1,725 65.1% Owner occupied927 34.9% Renter occupiedHouse owners and renters - Hispanic or Latino residents 487 44.8% Owner occupied600 55.2% Renter occupied
Language usage in River Grove
English speakers - Total 50.9% of residents of River Grove speak English at home.
22.6% of residents speak Spanish at home 1,653 75.1% Speak English very well547 24.9% Speak English less than very well26.8% of residents speak other language at home 1,393 53.4% Speak English very well1,218 46.6% Speak English less than very well
English speakers - Born in the United States 82.9% of residents of River Grove speak English at home.
13.3% of residents speak Spanish at home 107 100.0% Speak English very well2.9% of residents speak other language at home 23 100.0% Speak English very well
English speakers - Native, born elsewhere 15.8% of residents of River Grove speak English at home.
59.0% of residents speak Spanish at home 124 75.6% Speak English very well40 24.4% Speak English less than very well24.5% of residents speak other language at home 50 73.5% Speak English very well18 26.5% Speak English less than very well
English speakers - Foreign-born 9.4% of residents of River Grove speak English at home.
29.5% of residents speak Spanish at home 420 47.1% Speak English very well472 52.9% Speak English less than very well60.9% of residents speak other language at home 739 40.2% Speak English very well1,101 59.8% Speak English less than very well
White (Caucasian) - Speak only English Native:
78.0% (3,614)Foreign-born:
3.8% (59)
White (Caucasian) - Speak another language Native:
18.9% (877)Foreign-born:
95.4% (1,466)
American Indian / Alaska Native - Speak only English Native:
50.9% (156)Foreign-born:
63.3% (9)
Asian - Speak another language Native:
19.0% (8)Foreign-born:
100.0% (104)
Other race - Speak only English Native:
67.2% (816)Foreign-born:
21.0% (196)
Other race - Speak another language Native:
36.4% (442)Foreign-born:
76.9% (716)
Two or more races - Speak only English Native:
24.8% (140)Foreign-born:
41.4% (52)
Two or more races - Speak another language Native:
78.0% (440)Foreign-born:
58.6% (74)
White alone - Speak only English Native:
81.8% (3,525)Foreign-born:
3.7% (65)
White alone - Speak another language Native:
19.2% (828)Foreign-born:
97.7% (1,729)
Hispanic or Latino - Speak only English Native:
46.5% (1,053)Foreign-born:
16.3% (177)
Hispanic or Latino - Speak another language Native:
54.3% (1,229)Foreign-born:
82.3% (895)
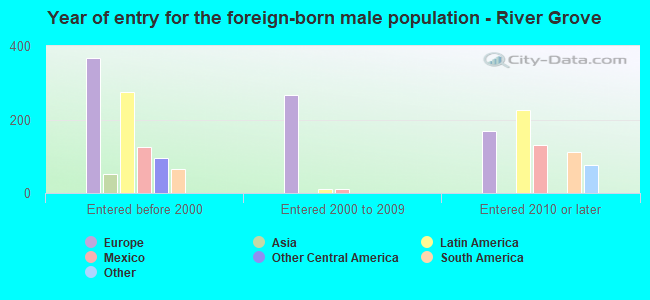
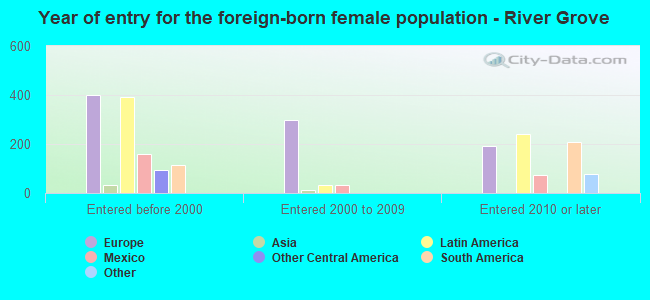
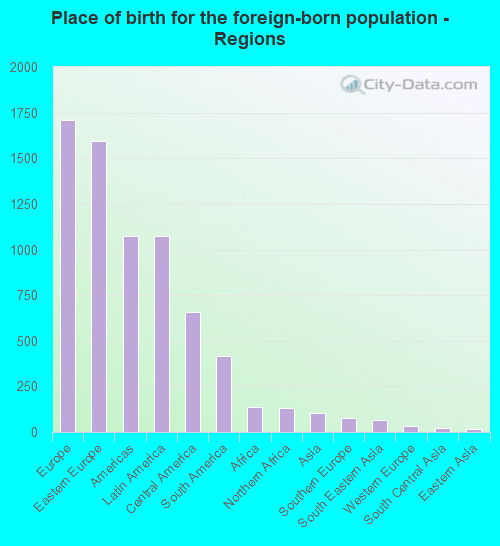
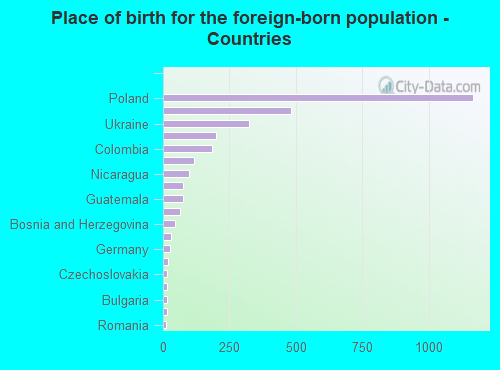
Foreign-born residents in River Grove 3,023 residents are foreign born (16.3% Europe , 10.3% Latin America ).
This city:
29.4%Illinois:
14.1%
Marital status for residents in River Grove Marital status - White (Caucasian) population 15 years and over
Males 33.4% Never married49.6% Now married1.8% Separated3.3% Widowed11.9% DivorcedFemales 30.8% Never married45.3% Now married0.6% Separated10.4% Widowed13.0% DivorcedWomen who gave birth in the past 12 months Now married:
43.8% (24)Unmarried:
56.2% (31)
Women who did not give birth in the past 12 months Now married:
46.6% (685)Unmarried:
53.4% (784)
Marital status - American Indian / Alaska Native population 15 years and over
Males 33.8% Never married66.2% Now married0.0% Separated0.0% Widowed0.0% DivorcedFemales 53.5% Never married14.1% Now married0.0% Separated0.0% Widowed32.4% DivorcedWomen who did not give birth in the past 12 months Now married:
14.1% (18)Unmarried:
85.9% (110)
Marital status - Asian population 15 years and over
Males 0.0% Never married81.9% Now married0.0% Separated0.0% Widowed18.1% DivorcedFemales 12.9% Never married77.4% Now married0.0% Separated0.0% Widowed9.7% DivorcedWomen who did not give birth in the past 12 months Now married:
63.6% (14)Unmarried:
36.4% (8)
Marital status - Other race population 15 years and over
Males 26.2% Never married67.3% Now married0.0% Separated0.0% Widowed6.5% DivorcedFemales 23.3% Never married58.3% Now married0.0% Separated9.1% Widowed9.3% DivorcedWomen who gave birth in the past 12 months Now married:
100.0% (47)Unmarried:
0.0% (0)
Women who did not give birth in the past 12 months Now married:
55.1% (325)Unmarried:
44.9% (265)
Marital status - Two or more races population 15 years and over
Males 71.8% Never married7.1% Now married0.0% Separated0.0% Widowed21.2% DivorcedFemales 58.7% Never married26.0% Now married0.0% Separated0.0% Widowed15.3% DivorcedWomen who did not give birth in the past 12 months Now married:
17.0% (25)Unmarried:
83.0% (122)
Marital status - White alone, not Hispanic / Latino population 15 years and over
Males 29.5% Never married53.3% Now married2.2% Separated3.9% Widowed11.0% DivorcedFemales 28.3% Never married46.1% Now married0.6% Separated11.9% Widowed13.1% DivorcedWomen who gave birth in the past 12 months Now married:
43.8% (27)Unmarried:
56.2% (34)
Women who did not give birth in the past 12 months Now married:
47.7% (641)Unmarried:
52.3% (704)
Marital status - Hispanic or Latino population 15 years and over
Males 43.0% Never married43.7% Now married0.0% Separated0.0% Widowed13.3% DivorcedFemales 34.8% Never married48.1% Now married0.0% Separated5.3% Widowed11.9% DivorcedWomen who gave birth in the past 12 months Now married:
100.0% (42)Unmarried:
0.0% (0)
Women who did not give birth in the past 12 months Now married:
44.5% (449)Unmarried:
55.5% (560)
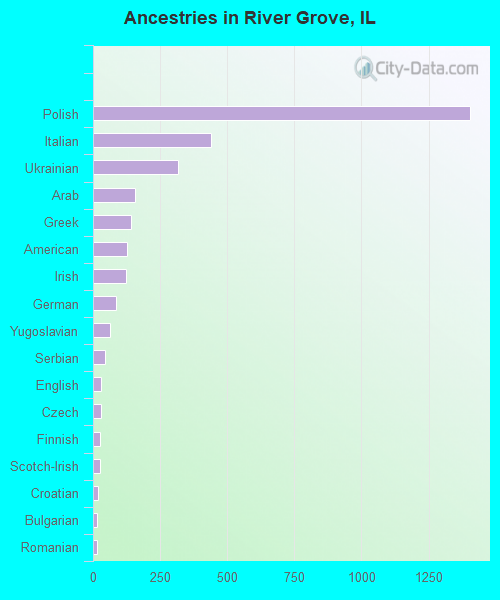
Ancestries in River Grove
1,405 22.1% Polish439 6.9% Italian318 5.0% Ukrainian158 2.5% Arab141 2.2% Greek125 2.0% American123 1.9% Irish86 1.4% German64 1.0% Yugoslavian46 0.7% Serbian31 0.5% English30 0.5% Czech26 0.4% Finnish25 0.4% Scotch-Irish18 0.3% Croatian16 0.3% Bulgarian16 0.3% Romanian8 0.1% Austrian8 0.1% Russian7 0.1% Danish3 0.05% French
Children Nativity (place of birth) in River Grove
Children under 6 years - Living with two parents Both parents native 368 100.0% NativeBoth parents foreign-born 241 100.0% NativeOne native, one foreign-born parent 11 100.0% NativeChildren under 6 years - Living with one parent Native parent 212 100.0% NativeForeign-born parent 148 100.0% NativeChildren 6 to 17 years - Living with two parents Both parents native 806 100.0% NativeBoth parents foreign-born 88 37.3% Native148 62.7% Foreign-bornOne native, one foreign-born parent 53 100.0% NativeChildren 6 to 17 years - Living with one parent Native parent 299 100.0% NativeForeign-born parent 165 50.1% Native165 49.9% Foreign-born
Grandparents responsible for own grandchildren in River Grove
Grandparents (30 to 59 years) White / Caucasian 7 100.0% Responsible for grandchildrenAsian 8 100.0% Responsible for grandchildrenOther race 146 100.0% Responsible for grandchildrenWhite alone, not Hispanic / Latino 10 100.0% Responsible for grandchildrenHispanic or Latino 99 100.0% Responsible for grandchildren
Grandparents (60 years and over) White / Caucasian 21 100.0% Not responsible for grandchildrenWhite alone, not Hispanic / Latino 27 100.0% Not responsible for grandchildren