Races in Riverhead, New York (NY) Detailed Stats
Data:
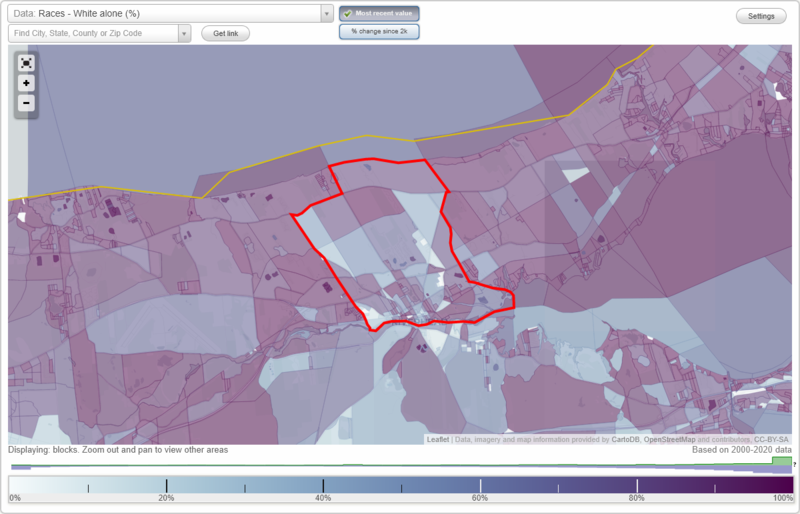
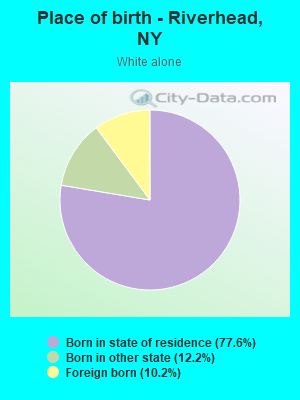
Races - White alone (%)
Races - White alone (% change since 2000)
Races - Black alone (%)
Races - Black alone (% change since 2000)
Races - American Indian alone (%)
Races - American Indian alone (% change since 2000)
Races - Asian alone (%)
Races - Asian alone (% change since 2000)
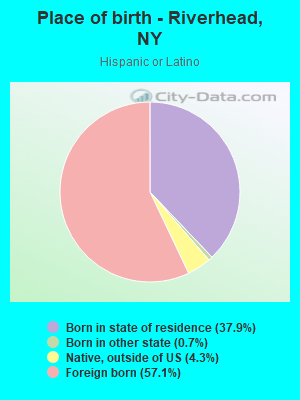
Races - Hispanic (%)
Races - Hispanic (% change since 2000)
Races - Native Hawaiian and Other Pacific Islander alone (%)
Races - Native Hawaiian and Other Pacific Islander alone (% change since 2000)
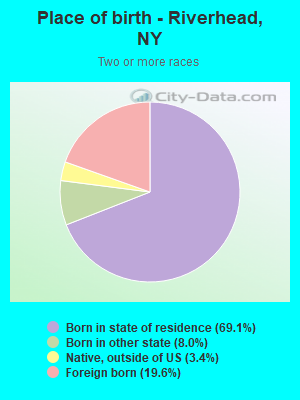
Races - Two or more races(%)
Races - Two or more races(% change since 2000)
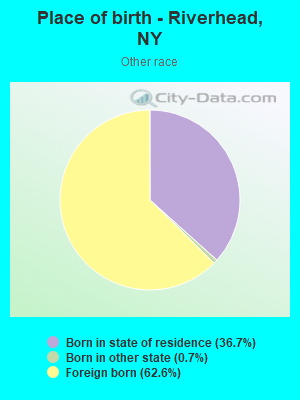
Races - Other race alone (%)
Races - Other race alone (% change since 2000)
Racial diversity
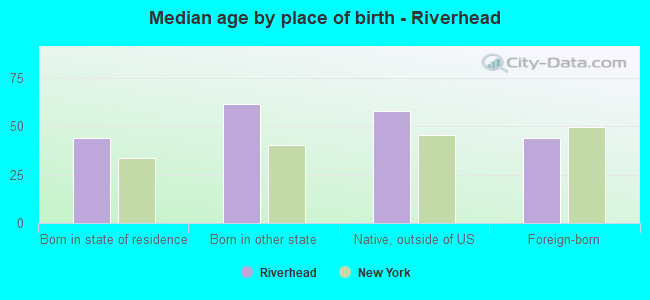
Place of birth - Born in state of residence (%)
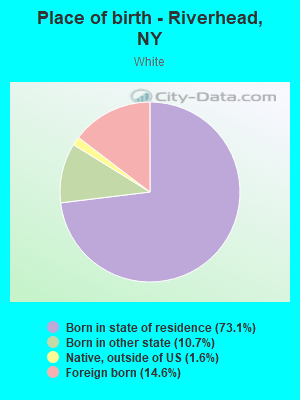
Place of birth - Born in state of residence (%) - White
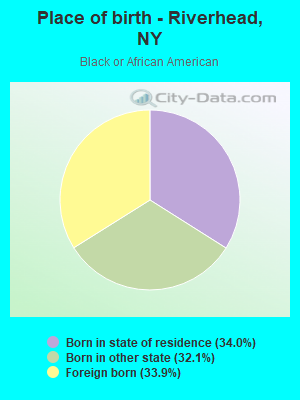
Place of birth - Born in state of residence (%) - Black or African American
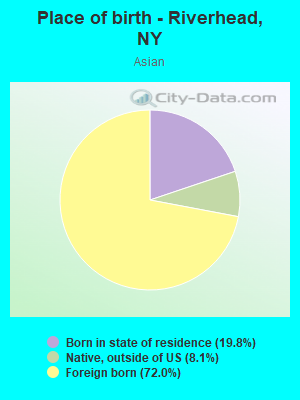
Place of birth - Born in state of residence (%) - Asian
Place of birth - Born in state of residence (%) - Hispanic or Latino
Place of birth - Born in state of residence (%) - American Indian and Alaska Native
Place of birth - Born in state of residence (%) - Multirace
Place of birth - Born in state of residence (%) - Other Race
Place of birth - Born in other state (%)
Place of birth - Born in other state (%) - White
Place of birth - Born in other state (%) - Black or African American
Place of birth - Born in other state (%) - Asian
Place of birth - Born in other state (%) - Hispanic or Latino
Place of birth - Born in other state (%) - American Indian and Alaska Native
Place of birth - Born in other state (%) - Multirace
Place of birth - Born in other state (%) - Other Race
Place of birth - Native, outside of US (%)
Place of birth - Native, outside of US (%) - White
Place of birth - Native, outside of US (%) - Black or African American
Place of birth - Native, outside of US (%) - Asian
Place of birth - Native, outside of US (%) - Hispanic or Latino
Place of birth - Native, outside of US (%) - American Indian and Alaska Native
Place of birth - Native, outside of US (%) - Multirace
Place of birth - Native, outside of US (%) - Other Race
Place of birth - Foreign born (%)
Place of birth - Foreign born (%) - White
Place of birth - Foreign born (%) - Black or African American
Place of birth - Foreign born (%) - Asian
Place of birth - Foreign born (%) - Hispanic or Latino
Place of birth - Foreign born (%) - American Indian and Alaska Native
Place of birth - Foreign born (%) - Multirace
Place of birth - Foreign born (%) - Other Race
Residents speaking English at home (%)
Residents speaking English at home - Born in the United States (%)
Residents speaking English at home - Native, born elsewhere (%)
Residents speaking English at home - Foreign born (%)
Residents speaking Spanish at home (%)
Residents speaking Spanish at home - Born in the United States (%)
Residents speaking Spanish at home - Native, born elsewhere (%)
Residents speaking Spanish at home - Foreign born (%)
Residents speaking other language at home (%)
Residents speaking other language at home - Born in the United States (%)
Residents speaking other language at home - Native, born elsewhere (%)
Residents speaking other language at home - Foreign born (%)
Marital status - Never married (%)
Marital status - Now married (%)
Marital status - Separated (%)
Marital status - Widowed (%)
Marital status - Divorced (%)
Ancestries Reported - Arab (%)
Ancestries Reported - Czech (%)
Ancestries Reported - Danish (%)
Ancestries Reported - Dutch (%)
Ancestries Reported - English (%)
Ancestries Reported - French (%)
Ancestries Reported - French Canadian (%)
Ancestries Reported - German (%)
Ancestries Reported - Greek (%)
Ancestries Reported - Hungarian (%)
Ancestries Reported - Irish (%)
Ancestries Reported - Italian (%)
Ancestries Reported - Lithuanian (%)
Ancestries Reported - Norwegian (%)
Ancestries Reported - Polish (%)
Ancestries Reported - Portuguese (%)
Ancestries Reported - Russian (%)
Ancestries Reported - Scotch-Irish (%)
Ancestries Reported - Scottish (%)
Ancestries Reported - Slovak (%)
Ancestries Reported - Subsaharan African (%)
Ancestries Reported - Swedish (%)
Ancestries Reported - Swiss (%)
Ancestries Reported - Ukrainian (%)
Ancestries Reported - United States (%)
Ancestries Reported - Welsh (%)
Ancestries Reported - West Indian (%)
Ancestries Reported - Other (%)
Geographical mobility - Same house 1 year ago (%)
Geographical mobility - Same house 1 year ago (%) - White
Geographical mobility - Same house 1 year ago (%) - Black or African American
Geographical mobility - Same house 1 year ago (%) - Asian
Geographical mobility - Same house 1 year ago (%) - Hispanic or Latino
Geographical mobility - Same house 1 year ago (%) - American Indian and Alaska Native
Geographical mobility - Same house 1 year ago (%) - Multirace
Geographical mobility - Same house 1 year ago (%) - Other Race
Geographical mobility - Moved within same county (%)
Geographical mobility - Moved within same county (%) - White
Geographical mobility - Moved within same county (%) - Black or African American
Geographical mobility - Moved within same county (%) - Asian
Geographical mobility - Moved within same county (%) - Hispanic or Latino
Geographical mobility - Moved within same county (%) - American Indian and Alaska Native
Geographical mobility - Moved within same county (%) - Multirace
Geographical mobility - Moved within same county (%) - Other Race
Geographical mobility - Moved from different county within same state (%)
Geographical mobility - Moved from different county within same state (%) - White
Geographical mobility - Moved from different county within same state (%) - Black or African American
Geographical mobility - Moved from different county within same state (%) - Asian
Geographical mobility - Moved from different county within same state (%) - Hispanic or Latino
Geographical mobility - Moved from different county within same state (%) - American Indian and Alaska Native
Geographical mobility - Moved from different county within same state (%) - Multirace
Geographical mobility - Moved from different county within same state (%) - Other Race
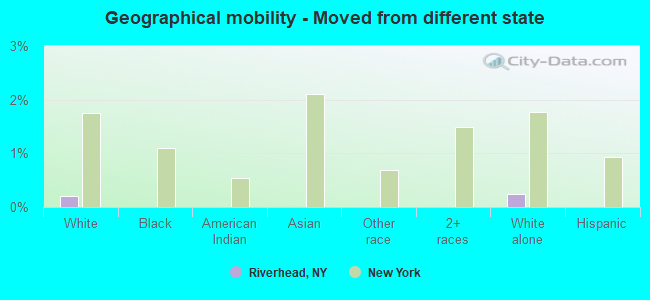
Geographical mobility - Moved from different state (%)
Geographical mobility - Moved from different state (%) - White
Geographical mobility - Moved from different state (%) - Black or African American
Geographical mobility - Moved from different state (%) - Asian
Geographical mobility - Moved from different state (%) - Hispanic or Latino
Geographical mobility - Moved from different state (%) - American Indian and Alaska Native
Geographical mobility - Moved from different state (%) - Multirace
Geographical mobility - Moved from different state (%) - Other Race
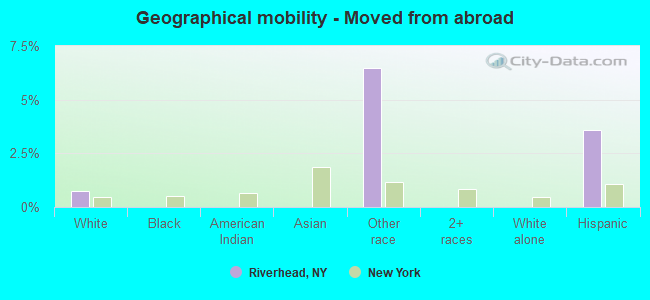
Geographical mobility - Moved from abroad (%)
Geographical mobility - Moved from abroad (%) - White
Geographical mobility - Moved from abroad (%) - Black or African American
Geographical mobility - Moved from abroad (%) - Asian
Geographical mobility - Moved from abroad (%) - Hispanic or Latino
Geographical mobility - Moved from abroad (%) - American Indian and Alaska Native
Geographical mobility - Moved from abroad (%) - Multirace
Geographical mobility - Moved from abroad (%) - Other Race
Place of birth for the foreign-born population - Ireland (%)
Place of birth for the foreign-born population - Denmark (%)
Place of birth for the foreign-born population - Norway (%)
Place of birth for the foreign-born population - Sweden (%)
Place of birth for the foreign-born population - United Kingdom (%)
Place of birth for the foreign-born population - England (%)
Place of birth for the foreign-born population - Scotland (%)
Place of birth for the foreign-born population - Other Northern Europe (%)
Place of birth for the foreign-born population - Austria (%)
Place of birth for the foreign-born population - Belgium (%)
Place of birth for the foreign-born population - France (%)
Place of birth for the foreign-born population - Germany (%)
Place of birth for the foreign-born population - Netherlands (%)
Place of birth for the foreign-born population - Switzerland (%)
Place of birth for the foreign-born population - Other Western Europe (%)
Place of birth for the foreign-born population - Greece (%)
Place of birth for the foreign-born population - Italy (%)
Place of birth for the foreign-born population - Portugal (%)
Place of birth for the foreign-born population - Spain (%)
Place of birth for the foreign-born population - Other Southern Europe (%)
Place of birth for the foreign-born population - Albania (%)
Place of birth for the foreign-born population - Belarus (%)
Place of birth for the foreign-born population - Bosnia and Herzegovina (%)
Place of birth for the foreign-born population - Bulgaria (%)
Place of birth for the foreign-born population - Croatia (%)
Place of birth for the foreign-born population - Czechoslovakia (%)
Place of birth for the foreign-born population - Hungary (%)
Place of birth for the foreign-born population - Latvia (%)
Place of birth for the foreign-born population - Lithuania (%)
Place of birth for the foreign-born population - North Macedonia (Macedonia) (%)
Place of birth for the foreign-born population - Moldova (%)
Place of birth for the foreign-born population - Poland (%)
Place of birth for the foreign-born population - Romania (%)
Place of birth for the foreign-born population - Russia (%)
Place of birth for the foreign-born population - Serbia (%)
Place of birth for the foreign-born population - Ukraine (%)
Place of birth for the foreign-born population - Other Eastern Europe (%)
Place of birth for the foreign-born population - China (%)
Place of birth for the foreign-born population - Hong Kong (%)
Place of birth for the foreign-born population - Taiwan (%)
Place of birth for the foreign-born population - Japan (%)
Place of birth for the foreign-born population - Korea (%)
Place of birth for the foreign-born population - Other Eastern Asia (%)
Place of birth for the foreign-born population - Afghanistan (%)
Place of birth for the foreign-born population - Bangladesh (%)
Place of birth for the foreign-born population - India (%)
Place of birth for the foreign-born population - Iran (%)
Place of birth for the foreign-born population - Kazakhstan (%)
Place of birth for the foreign-born population - Nepal (%)
Place of birth for the foreign-born population - Pakistan (%)
Place of birth for the foreign-born population - Sri Lanka (%)
Place of birth for the foreign-born population - Uzbekistan (%)
Place of birth for the foreign-born population - Other South Central Asia (%)
Place of birth for the foreign-born population - Burma (%)
Place of birth for the foreign-born population - Cambodia (%)
Place of birth for the foreign-born population - Indonesia (%)
Place of birth for the foreign-born population - Laos (%)
Place of birth for the foreign-born population - Malaysia (%)
Place of birth for the foreign-born population - Philippines (%)
Place of birth for the foreign-born population - Singapore (%)
Place of birth for the foreign-born population - Thailand (%)
Place of birth for the foreign-born population - Vietnam (%)
Place of birth for the foreign-born population - Other South Eastern Asia (%)
Place of birth for the foreign-born population - Armenia (%)
Place of birth for the foreign-born population - Iraq (%)
Place of birth for the foreign-born population - Israel (%)
Place of birth for the foreign-born population - Jordan (%)
Place of birth for the foreign-born population - Kuwait (%)
Place of birth for the foreign-born population - Lebanon (%)
Place of birth for the foreign-born population - Saudi Arabia (%)
Place of birth for the foreign-born population - Syria (%)
Place of birth for the foreign-born population - Turkey (%)
Place of birth for the foreign-born population - Yemen (%)
Place of birth for the foreign-born population - Other Western Asia (%)
Place of birth for the foreign-born population - Eritrea (%)
Place of birth for the foreign-born population - Ethiopia (%)
Place of birth for the foreign-born population - Kenya (%)
Place of birth for the foreign-born population - Somalia (%)
Place of birth for the foreign-born population - Uganda (%)
Place of birth for the foreign-born population - Zimbabwe (%)
Place of birth for the foreign-born population - Other Eastern Africa (%)
Place of birth for the foreign-born population - Cameroon (%)
Place of birth for the foreign-born population - Congo (%)
Place of birth for the foreign-born population - Democratic Republic of Congo (Zaire) (%)
Place of birth for the foreign-born population - Other Middle Africa (%)
Place of birth for the foreign-born population - Egypt (%)
Place of birth for the foreign-born population - Morocco (%)
Place of birth for the foreign-born population - Sudan (%)
Place of birth for the foreign-born population - Other Northern Africa (%)
Place of birth for the foreign-born population - South Africa (%)
Place of birth for the foreign-born population - Other Southern Africa (%)
Place of birth for the foreign-born population - Cabo Verde (%)
Place of birth for the foreign-born population - Ghana (%)
Place of birth for the foreign-born population - Liberia (%)
Place of birth for the foreign-born population - Nigeria (%)
Place of birth for the foreign-born population - Senegal (%)
Place of birth for the foreign-born population - Sierra Leone (%)
Place of birth for the foreign-born population - Other Western Africa (%)
Place of birth for the foreign-born population - Australia (%)
Place of birth for the foreign-born population - New Zealand (%)
Place of birth for the foreign-born population - Fiji (%)
Place of birth for the foreign-born population - Micronesia (%)
Place of birth for the foreign-born population - Bahamas (%)
Place of birth for the foreign-born population - Barbados (%)
Place of birth for the foreign-born population - Cuba (%)
Place of birth for the foreign-born population - Dominica (%)
Place of birth for the foreign-born population - Dominican Republic (%)
Place of birth for the foreign-born population - Grenada (%)
Place of birth for the foreign-born population - Haiti (%)
Place of birth for the foreign-born population - Jamaica (%)
Place of birth for the foreign-born population - St. Vincent and the Grenadines (%)
Place of birth for the foreign-born population - Trinidad and Tobago (%)
Place of birth for the foreign-born population - West Indies (%)
Place of birth for the foreign-born population - Other Caribbean (%)
Place of birth for the foreign-born population - Belize (%)
Place of birth for the foreign-born population - Costa Rica (%)
Place of birth for the foreign-born population - El Salvador (%)
Place of birth for the foreign-born population - Guatemala (%)
Place of birth for the foreign-born population - Honduras (%)
Place of birth for the foreign-born population - Mexico (%)
Place of birth for the foreign-born population - Nicaragua (%)
Place of birth for the foreign-born population - Panama (%)
Place of birth for the foreign-born population - Other Central America (%)
Place of birth for the foreign-born population - Argentina (%)
Place of birth for the foreign-born population - Bolivia (%)
Place of birth for the foreign-born population - Brazil (%)
Place of birth for the foreign-born population - Chile (%)
Place of birth for the foreign-born population - Colombia (%)
Place of birth for the foreign-born population - Ecuador (%)
Place of birth for the foreign-born population - Guyana (%)
Place of birth for the foreign-born population - Peru (%)
Place of birth for the foreign-born population - Uruguay (%)
Place of birth for the foreign-born population - Venezuela (%)
Place of birth for the foreign-born population - Other South America (%)
Place of birth for the foreign-born population - Canada (%)
Place of birth for the foreign-born population - Other Northern America (%)
Place of birth for the foreign-born population - Other (%)
Latest news about races in Riverhead, NY collected exclusively by city-data.com from local newspapers, TV, and radio stations
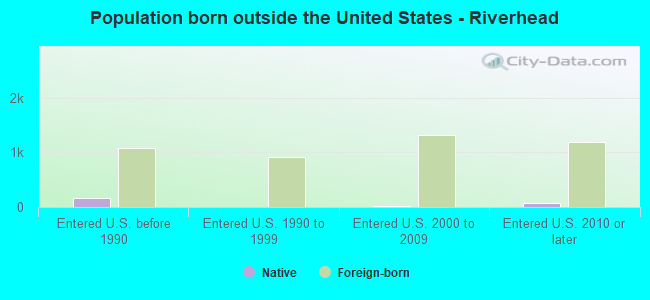
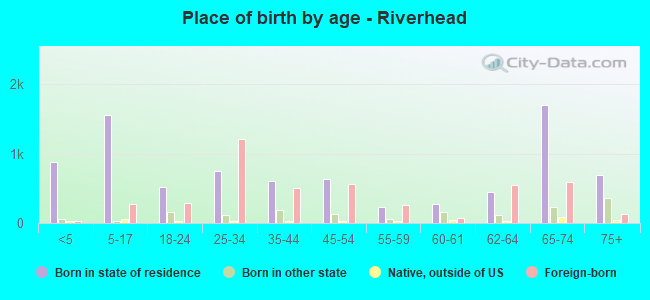
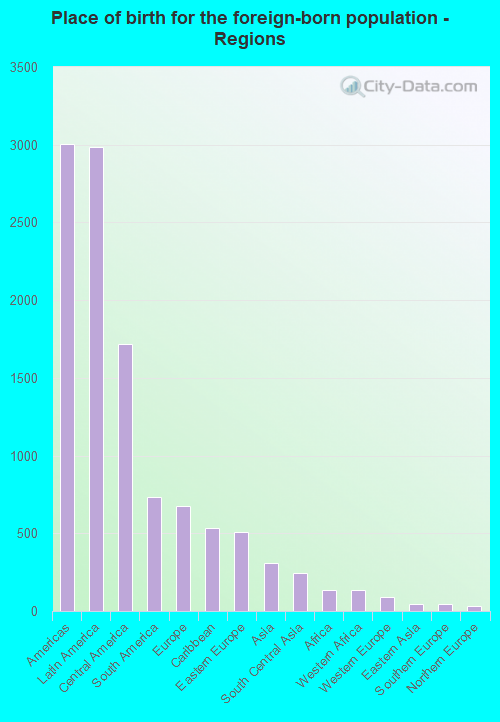
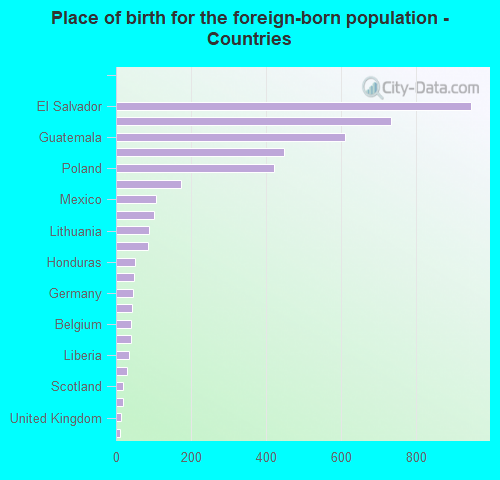
According to 2022 data, the most numerous races in Riverhead, NY are White alone (6,333 residents), Hispanic (4,887 residents), and Black alone (1,849 residents). 64.6% of Riverhead residents speak English at home. 28.7% of Riverhead, NY residents are foreign-born (21.0% born in Latin America, 4.7% born in Europe), which is 23.2% greater than the foreign-born rate of 22.0% across the entire state of New York.
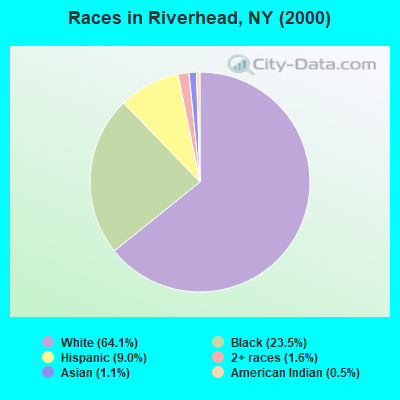
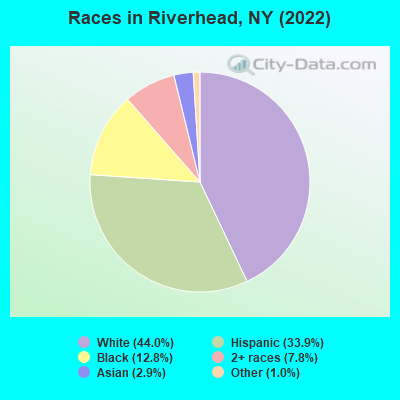
Race distribution in Riverhead
2000 2022
11,760,981 62.0% White alone 2,867,583 15.1% Hispanic 2,812,623 14.8% Black alone 1,035,926 5.5% Asian alone 366,116 1.9% Two or more races 75,499 0.4% Other race alone 52,499 0.3% American Indian alone 5,230 0.03% Native Hawaiian and Other
10,408,933 52.9% White alone 3,867,299 19.7% Hispanic 2,633,840 13.4% Black alone 1,776,286 9.0% Asian alone 732,670 3.7% Two or more races 216,110 1.1% Other race alone 35,082 0.2% American Indian alone 6,931 0.04% Native Hawaiian and Other
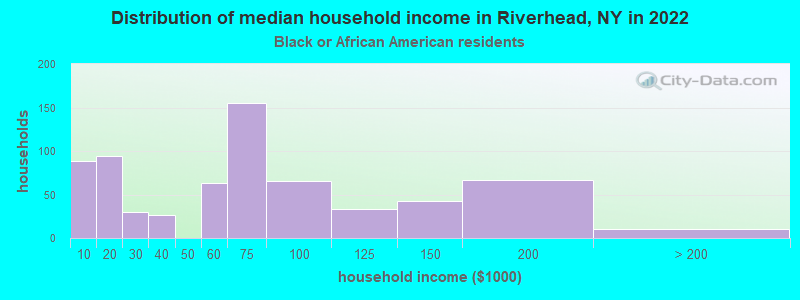
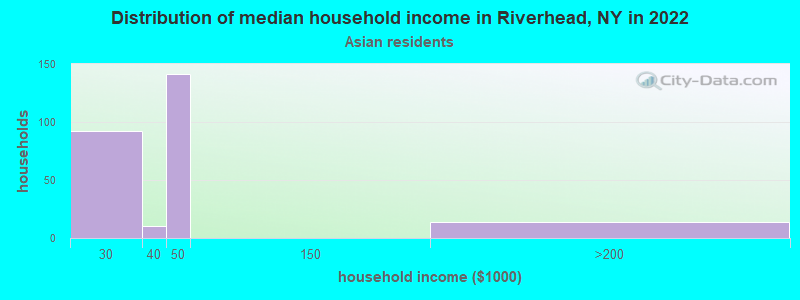
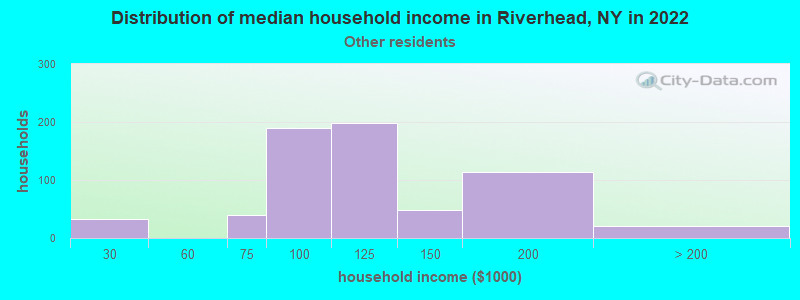
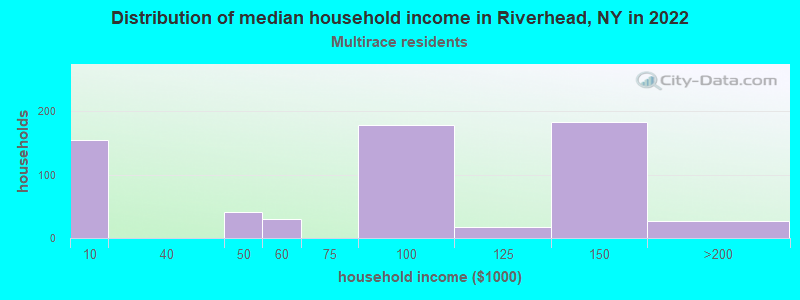
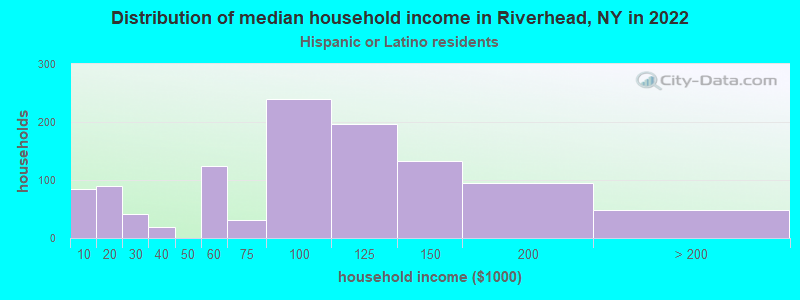
Income and house value in Riverhead Median household income in 2022 $72,438 White non-Hispanic householders$58,657 Black householders$44,369 Asian householders$82,893 Some other race householders$82,459 Two or more races householders$78,987 Hispanic or Latino race householdersMedian 2022 house value $474,366 White Non-Hispanic householders$409,243 Black or African American householders $416,005 Asian householders$667,245 Some other race householders$557,994 Two or more races householders$645,181 Hispanic or Latino householders
Median age by race in Riverhead
56.9 Median age for White residents54.5 60.9 52.1 Median age for Black or African American residents29.2 60.2 -748,832,865.7 Median age for American Indian / Alaska Native residents-807,017,543.1 -513,692,161.9 67.7 Median age for Asian residents68.5 34.1 -742,816,091.2 Median age for Native Hawaiian / Pacific Islander residents-831,187,409.8 -771,300,447.7 25.3 Median age for Other race residents25.0 24.6 29.1 Median age for Two or more races residents23.1 30.8 61.7 Median age for White alone residents59.1 62.9 27.8 Median age for Hispanic or Latino residents29.6 26.8
Owner/renter occupied households by race in Riverhead
House owners and renters - White residents 2,222 69.6% Owner occupied969 30.4% Renter occupiedHouse owners and renters - Black or African American residents 416 55.4% Owner occupied335 44.6% Renter occupiedHouse owners and renters - Asian residents 33 22.5% Owner occupied114 77.5% Renter occupiedHouse owners and renters - Other race residents 79 10.6% Owner occupied665 89.4% Renter occupiedHouse owners and renters - Two or more races residents 221 39.1% Owner occupied345 60.9% Renter occupiedHouse owners and renters - White alone residents 2,225 73.2% Owner occupied814 26.8% Renter occupiedHouse owners and renters - Hispanic or Latino residents 228 19.9% Owner occupied916 80.1% Renter occupied
Language usage in Riverhead
English speakers - Total 64.6% of residents of Riverhead speak English at home.
28.4% of residents speak Spanish at home 1,217 32.0% Speak English very well2,592 68.0% Speak English less than very well8.8% of residents speak other language at home 607 51.4% Speak English very well574 48.6% Speak English less than very well
English speakers - Born in the United States 95.6% of residents of Riverhead speak English at home.
3.4% of residents speak Spanish at home 51 100.0% Speak English very well1.2% of residents speak other language at home 18 100.0% Speak English very well
English speakers - Native, born elsewhere 10.3% of residents of Riverhead speak English at home.
73.8% of residents speak Spanish at home 40 20.6% Speak English very well154 79.4% Speak English less than very well
English speakers - Foreign-born 19.8% of residents of Riverhead speak English at home.
61.3% of residents speak Spanish at home 319 11.6% Speak English very well2,424 88.4% Speak English less than very well22.4% of residents speak other language at home 418 41.7% Speak English very well585 58.3% Speak English less than very well
White (Caucasian) - Speak only English Native:
92.5% (5,202)Foreign-born:
12.1% (126)
White (Caucasian) - Speak another language Native:
6.9% (388)Foreign-born:
82.6% (860)
Black or African American - Speak only English Native:
96.8% (1,248)Foreign-born:
78.4% (513)
Black or African American - Speak another language Native:
0.3% (4)Foreign-born:
26.4% (172)
Asian - Speak only English Native:
59.7% (64)Foreign-born:
9.1% (28)
Asian - Speak another language Native:
37.7% (40)Foreign-born:
92.5% (280)
Other race - Speak only English Native:
84.1% (743)Foreign-born:
13.1% (281)
Other race - Speak another language Native:
21.1% (186)Foreign-born:
85.6% (1,837)
Two or more races - Speak only English Native:
52.8% (850)Foreign-born:
12.6% (54)
Two or more races - Speak another language Native:
46.7% (752)Foreign-born:
87.4% (376)
White alone - Speak only English Native:
97.1% (5,198)Foreign-born:
21.3% (137)
White alone - Speak another language Native:
2.9% (153)Foreign-born:
78.7% (507)
Hispanic or Latino - Speak only English Native:
37.2% (636)Foreign-born:
8.1% (230)
Hispanic or Latino - Speak another language Native:
62.0% (1,060)Foreign-born:
91.8% (2,605)
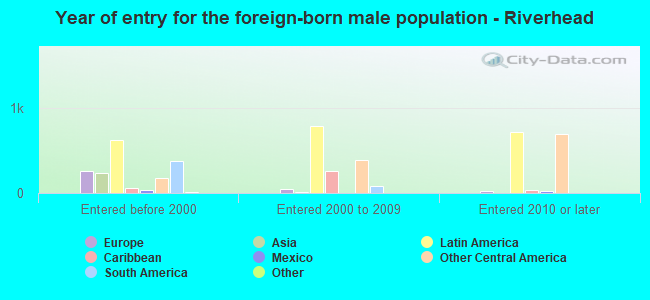
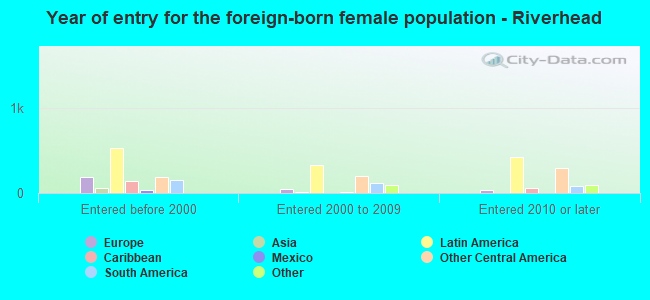
Foreign-born residents in Riverhead 4,125 residents are foreign born (21.0% Latin America , 4.7% Europe ).
This city:
28.7%New York:
22.6%
Marital status for residents in Riverhead Marital status - White (Caucasian) population 15 years and over
Males 36.1% Never married50.6% Now married1.9% Separated1.1% Widowed10.2% DivorcedFemales 20.0% Never married53.5% Now married2.4% Separated13.1% Widowed10.9% DivorcedWomen who gave birth in the past 12 months Now married:
100.0% (15)Unmarried:
0.0% (0)
Women who did not give birth in the past 12 months Now married:
57.3% (509)Unmarried:
42.7% (380)
Marital status - Black or African American population 15 years and over
Males 60.9% Never married38.7% Now married0.0% Separated0.4% Widowed0.0% DivorcedFemales 30.3% Never married30.6% Now married0.0% Separated17.9% Widowed21.3% DivorcedWomen who did not give birth in the past 12 months Now married:
13.7% (40)Unmarried:
86.3% (249)
Marital status - Asian population 15 years and over
Males 0.0% Never married26.0% Now married35.3% Separated0.0% Widowed38.7% DivorcedFemales 0.0% Never married45.9% Now married0.0% Separated43.2% Widowed10.8% DivorcedWomen who did not give birth in the past 12 months Now married:
100.0% (53)Unmarried:
0.0% (0)
Marital status - Other race population 15 years and over
Males 38.2% Never married48.1% Now married0.0% Separated4.3% Widowed9.5% DivorcedFemales 60.8% Never married35.0% Now married2.9% Separated0.0% Widowed1.2% DivorcedWomen who gave birth in the past 12 months Now married:
100.0% (124)Unmarried:
0.0% (0)
Women who did not give birth in the past 12 months Now married:
13.8% (117)Unmarried:
86.2% (726)
Marital status - Two or more races population 15 years and over
Males 55.7% Never married36.5% Now married0.0% Separated0.0% Widowed7.8% DivorcedFemales 67.5% Never married22.9% Now married0.0% Separated0.0% Widowed9.5% DivorcedWomen who did not give birth in the past 12 months Now married:
29.5% (192)Unmarried:
70.5% (458)
Marital status - White alone, not Hispanic / Latino population 15 years and over
Males 33.0% Never married53.4% Now married2.4% Separated1.4% Widowed9.7% DivorcedFemales 18.8% Never married50.9% Now married2.8% Separated15.0% Widowed12.5% DivorcedWomen who did not give birth in the past 12 months Now married:
55.2% (385)Unmarried:
44.8% (313)
Marital status - Hispanic or Latino population 15 years and over
Males 46.5% Never married41.8% Now married0.0% Separated2.3% Widowed9.5% DivorcedFemales 58.4% Never married37.8% Now married1.3% Separated0.0% Widowed2.4% DivorcedWomen who gave birth in the past 12 months Now married:
100.0% (105)Unmarried:
0.0% (0)
Women who did not give birth in the past 12 months Now married:
27.4% (338)Unmarried:
72.6% (893)
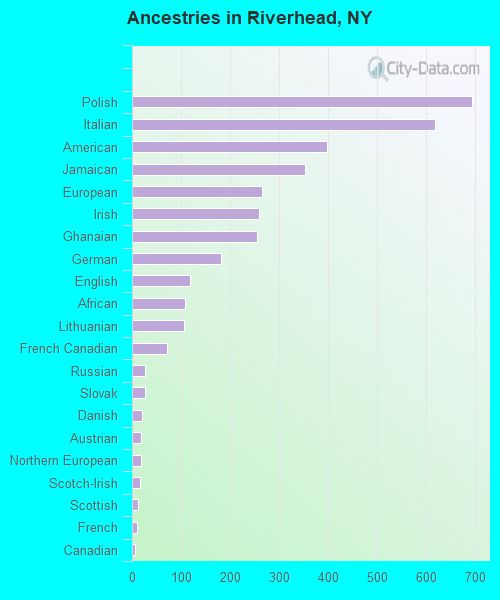
Ancestries in Riverhead
693 8.7% Polish618 7.8% Italian397 5.0% American352 4.4% Jamaican264 3.3% European259 3.3% Irish254 3.2% Ghanaian182 2.3% German119 1.5% English109 1.4% African105 1.3% Lithuanian71 0.9% French Canadian27 0.3% Russian26 0.3% Slovak21 0.3% Danish19 0.2% Austrian18 0.2% Northern European17 0.2% Scotch-Irish12 0.2% Scottish10 0.1% French7 0.09% Canadian5 0.06% Haitian4 0.05% Portuguese
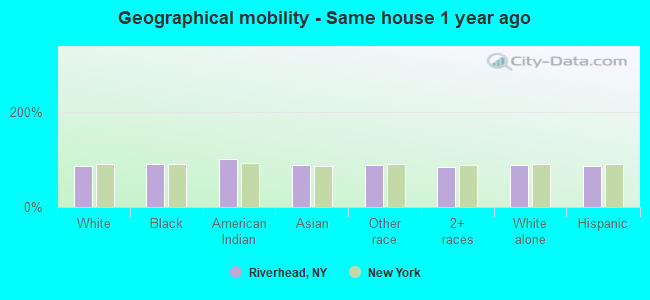
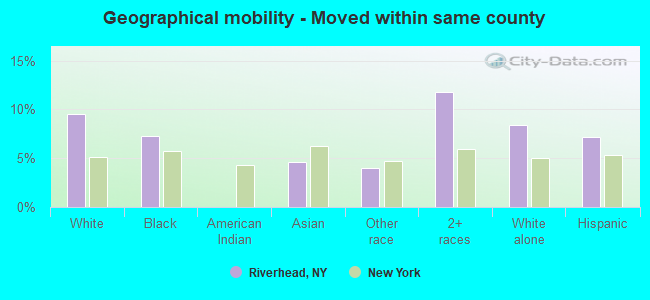
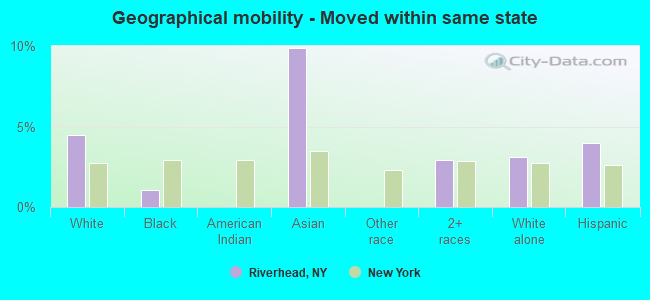
Geographical mobility in Riverhead Same house 1 year ago 6,151 85.1% White (Caucasian)1,753 90.0% Black or African American21 100.0% American Indian / Alaska Native361 86.5% Asian2,914 89.1% Other race1,809 83.7% Two or more races5,483 88.4% White alone, not Hispanic / Latino4,100 85.4% Hispanic or LatinoMoved within same county 692 9.6% White / Caucasian141 7.2% Black or African American19 4.6% Asian131 4.0% Other race255 11.8% Two or more races521 8.4% White alone, not Hispanic / Latino346 7.2% Hispanic or LatinoMoved within same state 323 4.5% White / Caucasian20 1.0% Black or African American41 9.8% Asian63 2.9% Two or more races192 3.1% White alone, not Hispanic / Latino191 4.0% Hispanic or LatinoMoved from different state 14 0.2% White / Caucasian15 0.2% White alone, not Hispanic / LatinoMoved from abroad 53 0.7% White212 6.5% Other race173 3.6% Hispanic or Latino
Children Nativity (place of birth) in Riverhead
Children under 6 years - Living with two parents Both parents native 255 100.0% NativeBoth parents foreign-born 393 100.0% NativeChildren under 6 years - Living with one parent Foreign-born parent 461 100.0% NativeChildren 6 to 17 years - Living with two parents Both parents native 487 99.9% Native0 0.1% Foreign-bornBoth parents foreign-born 253 64.8% Native137 35.2% Foreign-bornOne native, one foreign-born parent 313 100.0% NativeChildren 6 to 17 years - Living with one parent Native parent 259 100.0% NativeForeign-born parent 132 64.9% Native71 35.1% Foreign-born
Grandparents responsible for own grandchildren in Riverhead
Grandparents (30 to 59 years) White / Caucasian 41 65.0% Responsible for grandchildren22 35.0% Not responsible for grandchildrenBlack or African American 11 100.0% Responsible for grandchildrenTwo or more races 50 100.0% Responsible for grandchildrenWhite alone, not Hispanic / Latino 40 100.0% Responsible for grandchildrenHispanic or Latino 31 100.0% Not responsible for grandchildrenGrandparents (60 years and over) White / Caucasian 62 100.0% Not responsible for grandchildrenBlack or African American 8 100.0% Responsible for grandchildrenTwo or more races 33 100.0% Not responsible for grandchildrenWhite alone, not Hispanic / Latino 37 100.0% Not responsible for grandchildrenHispanic or Latino 29 27.6% Responsible for grandchildren75 72.4% Not responsible for grandchildren