Races in Rochester, Massachusetts (MA) Detailed Stats
Ancestries, Foreign-born residents, place of birth

Recent posts about races in Rochester, Massachusetts on our local forum with over 2,400,000 registered users:

Latest news about races in Rochester, MA collected exclusively by city-data.com from local newspapers, TV, and radio stations
2.5% of Rochester, MA residents are foreign-born (1.9% born in Europe, 0.3% born in Asia, 0.3% born in Latin America), which is 617.0% less than the foreign-born rate of 18.0% across the entire state of Massachusetts.
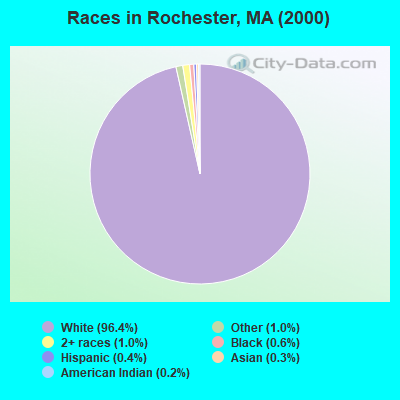
Race distribution in Rochester

- 4,41696.4%White alone
- 461.0%Two or more races
- 481.0%Other race alone
- 290.6%Black alone
- 170.4%Hispanic
- 160.3%Asian alone
- 90.2%American Indian alone
2000
2022
-
- 5,198,35981.9%White alone
- 428,7296.8%Hispanic
- 318,3295.0%Black alone
- 236,7863.7%Asian alone
- 110,3381.7%Two or more races
- 43,5860.7%Other race alone
- 11,2640.2%American Indian alone
- 1,7060.03%Native Hawaiian and Other
Pacific Islander alone

-
- 4,676,62767.0%White alone
- 911,03813.0%Hispanic
- 501,4637.2%Asian alone
- 459,7406.6%Black alone
- 341,8894.9%Two or more races
- 84,4031.2%Other race alone
- 5,8380.08%American Indian alone
- 9760.01%Native Hawaiian and Other
Pacific Islander alone

Income and house value in Rochester
- Median household income in 2022
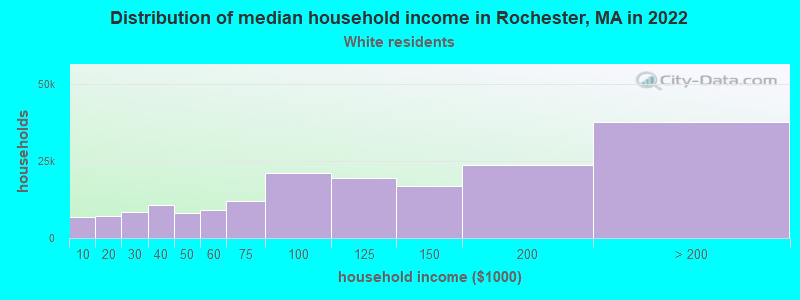
- $116,804White non-Hispanic householders
- $166,357Some other race householders
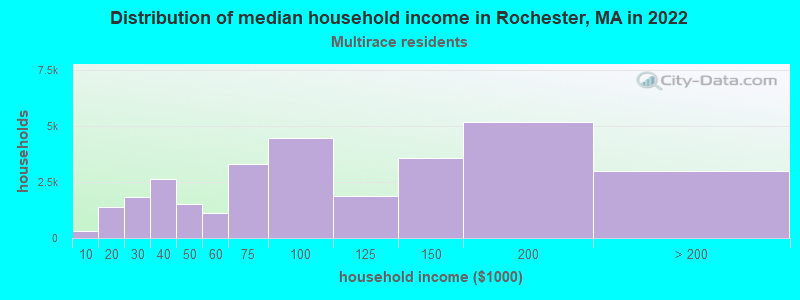
- $195,221Two or more races householders
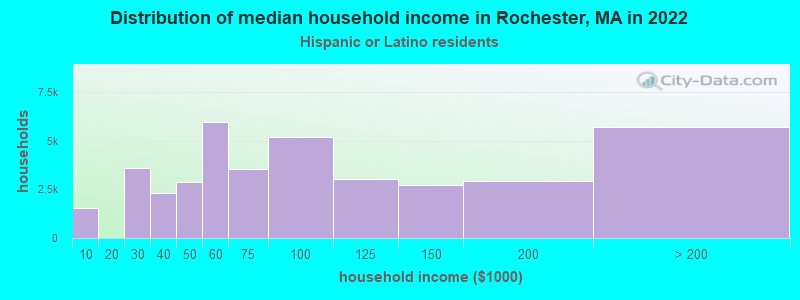
- over $200,000Hispanic or Latino race householders
- Median 2022 house value
- $560,873White Non-Hispanic householders
- $233,567Some other race householders
- $428,207Two or more races householders
Household income for White non-Hispanic householders
Household income for Two or more races householders
Household income for Hispanic or Latino race householders
Foreign-born residents in Rochester
115 residents are foreign born (1.9% Europe, 0.3% Asia, 0.3% Latin America).
| This city: | 2.5% |
| Massachusetts: | 12.2% |
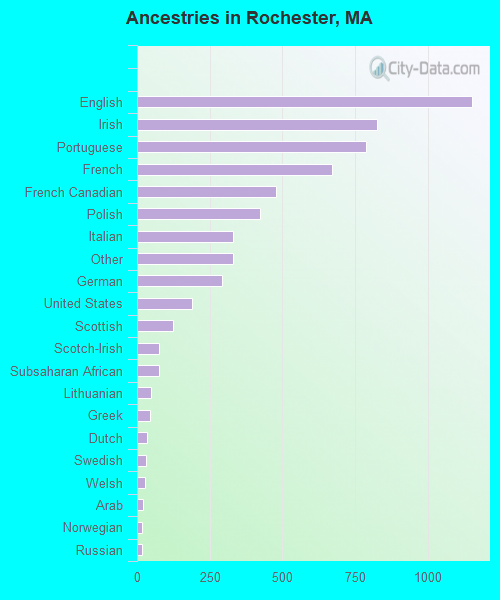
Ancestries in Rochester

- 1,15419.2%English
- 82613.8%Irish
- 78813.1%Portuguese
- 67211.2%French
- 4798.0%French Canadian
- 4247.1%Polish
- 3305.5%Italian
- 3305.5%Other
- 2914.8%German
- 1893.1%United States
- 1232.0%Scottish
- 771.3%Scotch-Irish
- 751.2%Subsaharan African
- 490.8%Lithuanian
- 460.8%Greek
- 340.6%Dutch
- 300.5%Swedish
- 280.5%Welsh
- 210.3%Arab
- 170.3%Norwegian
- 160.3%Russian
- 70.1%Danish
Zip codes: 02770.