Races in Rockledge, Florida (FL) Detailed Stats
Data:
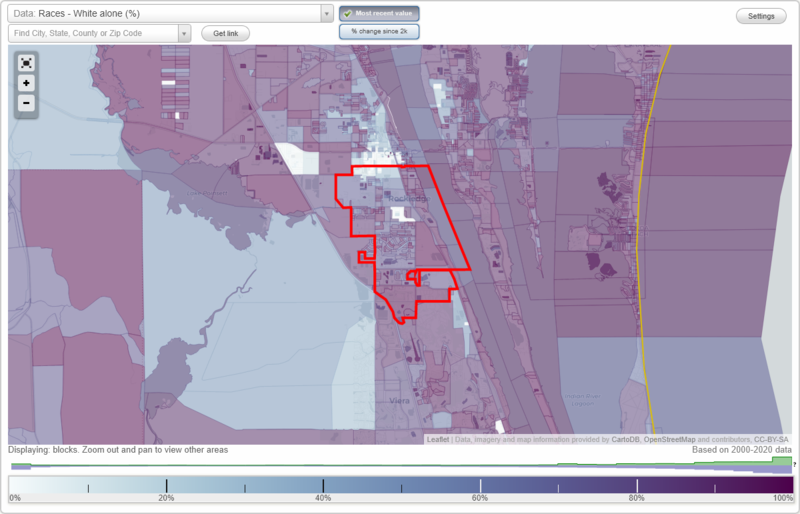
Races - White alone (%)
Races - White alone (% change since 2000)
Races - Black alone (%)
Races - Black alone (% change since 2000)
Races - American Indian alone (%)
Races - American Indian alone (% change since 2000)
Races - Asian alone (%)
Races - Asian alone (% change since 2000)
Races - Hispanic (%)
Races - Hispanic (% change since 2000)
Races - Native Hawaiian and Other Pacific Islander alone (%)
Races - Native Hawaiian and Other Pacific Islander alone (% change since 2000)
Races - Two or more races(%)
Races - Two or more races(% change since 2000)
Races - Other race alone (%)
Races - Other race alone (% change since 2000)
Racial diversity
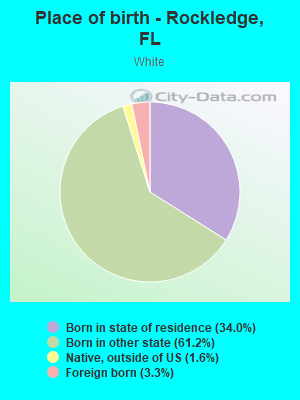
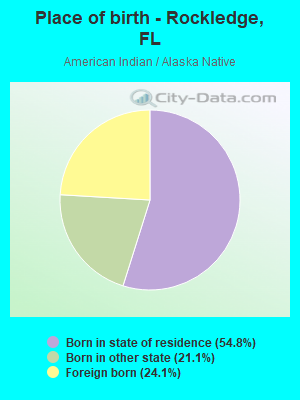
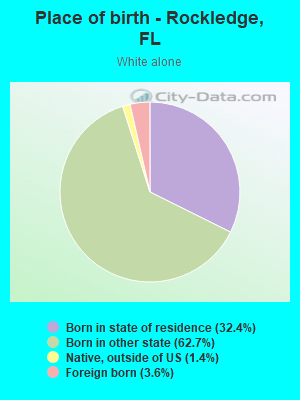
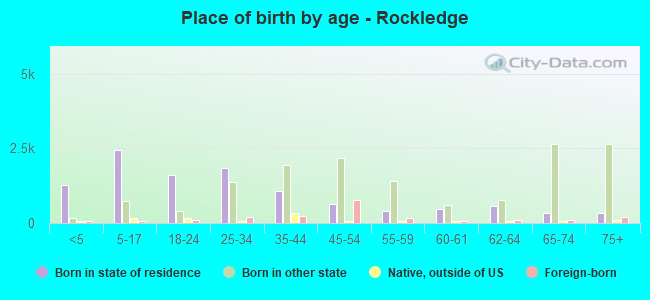
Place of birth - Born in state of residence (%)
Place of birth - Born in state of residence (%) - White
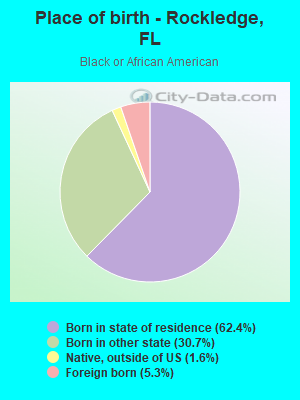
Place of birth - Born in state of residence (%) - Black or African American
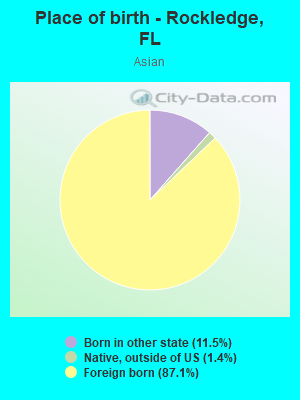
Place of birth - Born in state of residence (%) - Asian
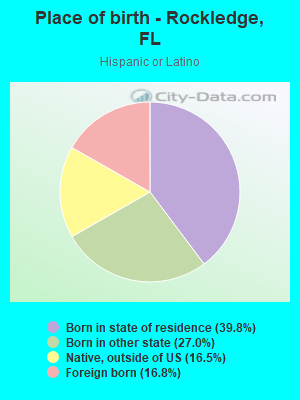
Place of birth - Born in state of residence (%) - Hispanic or Latino
Place of birth - Born in state of residence (%) - American Indian and Alaska Native
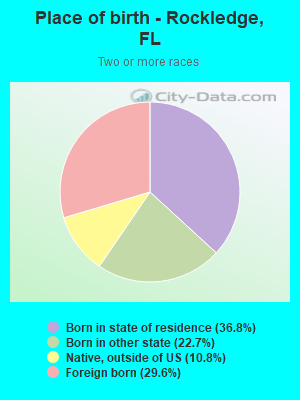
Place of birth - Born in state of residence (%) - Multirace
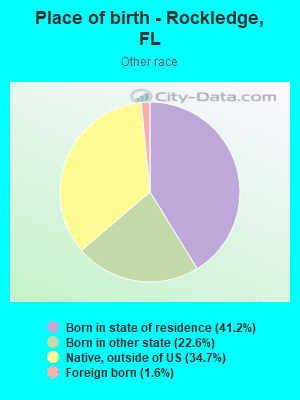
Place of birth - Born in state of residence (%) - Other Race
Place of birth - Born in other state (%)
Place of birth - Born in other state (%) - White
Place of birth - Born in other state (%) - Black or African American
Place of birth - Born in other state (%) - Asian
Place of birth - Born in other state (%) - Hispanic or Latino
Place of birth - Born in other state (%) - American Indian and Alaska Native
Place of birth - Born in other state (%) - Multirace
Place of birth - Born in other state (%) - Other Race
Place of birth - Native, outside of US (%)
Place of birth - Native, outside of US (%) - White
Place of birth - Native, outside of US (%) - Black or African American
Place of birth - Native, outside of US (%) - Asian
Place of birth - Native, outside of US (%) - Hispanic or Latino
Place of birth - Native, outside of US (%) - American Indian and Alaska Native
Place of birth - Native, outside of US (%) - Multirace
Place of birth - Native, outside of US (%) - Other Race
Place of birth - Foreign born (%)
Place of birth - Foreign born (%) - White
Place of birth - Foreign born (%) - Black or African American
Place of birth - Foreign born (%) - Asian
Place of birth - Foreign born (%) - Hispanic or Latino
Place of birth - Foreign born (%) - American Indian and Alaska Native
Place of birth - Foreign born (%) - Multirace
Place of birth - Foreign born (%) - Other Race
Residents speaking English at home (%)
Residents speaking English at home - Born in the United States (%)
Residents speaking English at home - Native, born elsewhere (%)
Residents speaking English at home - Foreign born (%)
Residents speaking Spanish at home (%)
Residents speaking Spanish at home - Born in the United States (%)
Residents speaking Spanish at home - Native, born elsewhere (%)
Residents speaking Spanish at home - Foreign born (%)
Residents speaking other language at home (%)
Residents speaking other language at home - Born in the United States (%)
Residents speaking other language at home - Native, born elsewhere (%)
Residents speaking other language at home - Foreign born (%)
Marital status - Never married (%)
Marital status - Now married (%)
Marital status - Separated (%)
Marital status - Widowed (%)
Marital status - Divorced (%)
Ancestries Reported - Arab (%)
Ancestries Reported - Czech (%)
Ancestries Reported - Danish (%)
Ancestries Reported - Dutch (%)
Ancestries Reported - English (%)
Ancestries Reported - French (%)
Ancestries Reported - French Canadian (%)
Ancestries Reported - German (%)
Ancestries Reported - Greek (%)
Ancestries Reported - Hungarian (%)
Ancestries Reported - Irish (%)
Ancestries Reported - Italian (%)
Ancestries Reported - Lithuanian (%)
Ancestries Reported - Norwegian (%)
Ancestries Reported - Polish (%)
Ancestries Reported - Portuguese (%)
Ancestries Reported - Russian (%)
Ancestries Reported - Scotch-Irish (%)
Ancestries Reported - Scottish (%)
Ancestries Reported - Slovak (%)
Ancestries Reported - Subsaharan African (%)
Ancestries Reported - Swedish (%)
Ancestries Reported - Swiss (%)
Ancestries Reported - Ukrainian (%)
Ancestries Reported - United States (%)
Ancestries Reported - Welsh (%)
Ancestries Reported - West Indian (%)
Ancestries Reported - Other (%)
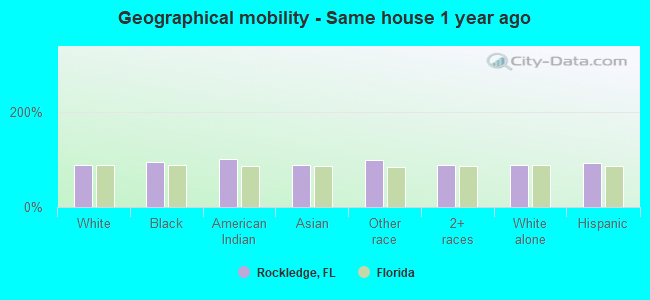
Geographical mobility - Same house 1 year ago (%)
Geographical mobility - Same house 1 year ago (%) - White
Geographical mobility - Same house 1 year ago (%) - Black or African American
Geographical mobility - Same house 1 year ago (%) - Asian
Geographical mobility - Same house 1 year ago (%) - Hispanic or Latino
Geographical mobility - Same house 1 year ago (%) - American Indian and Alaska Native
Geographical mobility - Same house 1 year ago (%) - Multirace
Geographical mobility - Same house 1 year ago (%) - Other Race
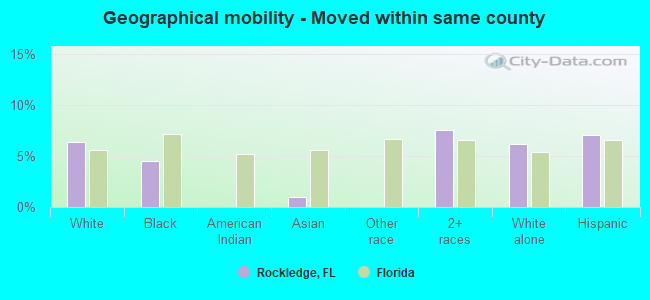
Geographical mobility - Moved within same county (%)
Geographical mobility - Moved within same county (%) - White
Geographical mobility - Moved within same county (%) - Black or African American
Geographical mobility - Moved within same county (%) - Asian
Geographical mobility - Moved within same county (%) - Hispanic or Latino
Geographical mobility - Moved within same county (%) - American Indian and Alaska Native
Geographical mobility - Moved within same county (%) - Multirace
Geographical mobility - Moved within same county (%) - Other Race
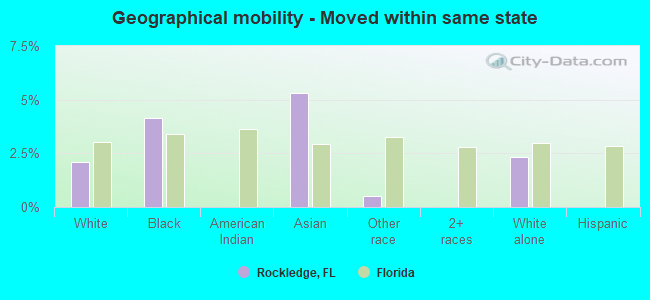
Geographical mobility - Moved from different county within same state (%)
Geographical mobility - Moved from different county within same state (%) - White
Geographical mobility - Moved from different county within same state (%) - Black or African American
Geographical mobility - Moved from different county within same state (%) - Asian
Geographical mobility - Moved from different county within same state (%) - Hispanic or Latino
Geographical mobility - Moved from different county within same state (%) - American Indian and Alaska Native
Geographical mobility - Moved from different county within same state (%) - Multirace
Geographical mobility - Moved from different county within same state (%) - Other Race
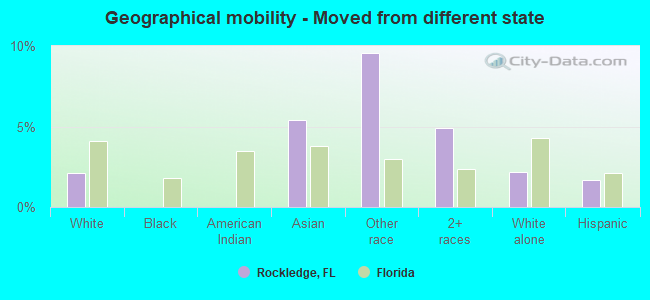
Geographical mobility - Moved from different state (%)
Geographical mobility - Moved from different state (%) - White
Geographical mobility - Moved from different state (%) - Black or African American
Geographical mobility - Moved from different state (%) - Asian
Geographical mobility - Moved from different state (%) - Hispanic or Latino
Geographical mobility - Moved from different state (%) - American Indian and Alaska Native
Geographical mobility - Moved from different state (%) - Multirace
Geographical mobility - Moved from different state (%) - Other Race
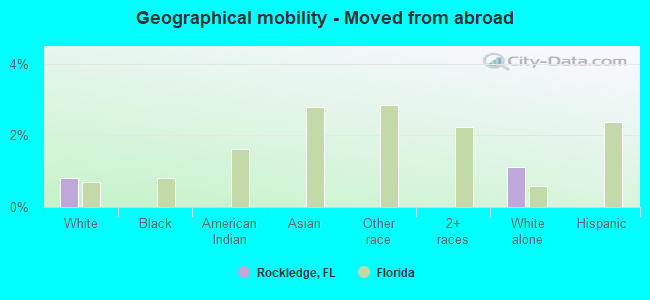
Geographical mobility - Moved from abroad (%)
Geographical mobility - Moved from abroad (%) - White
Geographical mobility - Moved from abroad (%) - Black or African American
Geographical mobility - Moved from abroad (%) - Asian
Geographical mobility - Moved from abroad (%) - Hispanic or Latino
Geographical mobility - Moved from abroad (%) - American Indian and Alaska Native
Geographical mobility - Moved from abroad (%) - Multirace
Geographical mobility - Moved from abroad (%) - Other Race
Place of birth for the foreign-born population - Ireland (%)
Place of birth for the foreign-born population - Denmark (%)
Place of birth for the foreign-born population - Norway (%)
Place of birth for the foreign-born population - Sweden (%)
Place of birth for the foreign-born population - United Kingdom (%)
Place of birth for the foreign-born population - England (%)
Place of birth for the foreign-born population - Scotland (%)
Place of birth for the foreign-born population - Other Northern Europe (%)
Place of birth for the foreign-born population - Austria (%)
Place of birth for the foreign-born population - Belgium (%)
Place of birth for the foreign-born population - France (%)
Place of birth for the foreign-born population - Germany (%)
Place of birth for the foreign-born population - Netherlands (%)
Place of birth for the foreign-born population - Switzerland (%)
Place of birth for the foreign-born population - Other Western Europe (%)
Place of birth for the foreign-born population - Greece (%)
Place of birth for the foreign-born population - Italy (%)
Place of birth for the foreign-born population - Portugal (%)
Place of birth for the foreign-born population - Spain (%)
Place of birth for the foreign-born population - Other Southern Europe (%)
Place of birth for the foreign-born population - Albania (%)
Place of birth for the foreign-born population - Belarus (%)
Place of birth for the foreign-born population - Bosnia and Herzegovina (%)
Place of birth for the foreign-born population - Bulgaria (%)
Place of birth for the foreign-born population - Croatia (%)
Place of birth for the foreign-born population - Czechoslovakia (%)
Place of birth for the foreign-born population - Hungary (%)
Place of birth for the foreign-born population - Latvia (%)
Place of birth for the foreign-born population - Lithuania (%)
Place of birth for the foreign-born population - North Macedonia (Macedonia) (%)
Place of birth for the foreign-born population - Moldova (%)
Place of birth for the foreign-born population - Poland (%)
Place of birth for the foreign-born population - Romania (%)
Place of birth for the foreign-born population - Russia (%)
Place of birth for the foreign-born population - Serbia (%)
Place of birth for the foreign-born population - Ukraine (%)
Place of birth for the foreign-born population - Other Eastern Europe (%)
Place of birth for the foreign-born population - China (%)
Place of birth for the foreign-born population - Hong Kong (%)
Place of birth for the foreign-born population - Taiwan (%)
Place of birth for the foreign-born population - Japan (%)
Place of birth for the foreign-born population - Korea (%)
Place of birth for the foreign-born population - Other Eastern Asia (%)
Place of birth for the foreign-born population - Afghanistan (%)
Place of birth for the foreign-born population - Bangladesh (%)
Place of birth for the foreign-born population - India (%)
Place of birth for the foreign-born population - Iran (%)
Place of birth for the foreign-born population - Kazakhstan (%)
Place of birth for the foreign-born population - Nepal (%)
Place of birth for the foreign-born population - Pakistan (%)
Place of birth for the foreign-born population - Sri Lanka (%)
Place of birth for the foreign-born population - Uzbekistan (%)
Place of birth for the foreign-born population - Other South Central Asia (%)
Place of birth for the foreign-born population - Burma (%)
Place of birth for the foreign-born population - Cambodia (%)
Place of birth for the foreign-born population - Indonesia (%)
Place of birth for the foreign-born population - Laos (%)
Place of birth for the foreign-born population - Malaysia (%)
Place of birth for the foreign-born population - Philippines (%)
Place of birth for the foreign-born population - Singapore (%)
Place of birth for the foreign-born population - Thailand (%)
Place of birth for the foreign-born population - Vietnam (%)
Place of birth for the foreign-born population - Other South Eastern Asia (%)
Place of birth for the foreign-born population - Armenia (%)
Place of birth for the foreign-born population - Iraq (%)
Place of birth for the foreign-born population - Israel (%)
Place of birth for the foreign-born population - Jordan (%)
Place of birth for the foreign-born population - Kuwait (%)
Place of birth for the foreign-born population - Lebanon (%)
Place of birth for the foreign-born population - Saudi Arabia (%)
Place of birth for the foreign-born population - Syria (%)
Place of birth for the foreign-born population - Turkey (%)
Place of birth for the foreign-born population - Yemen (%)
Place of birth for the foreign-born population - Other Western Asia (%)
Place of birth for the foreign-born population - Eritrea (%)
Place of birth for the foreign-born population - Ethiopia (%)
Place of birth for the foreign-born population - Kenya (%)
Place of birth for the foreign-born population - Somalia (%)
Place of birth for the foreign-born population - Uganda (%)
Place of birth for the foreign-born population - Zimbabwe (%)
Place of birth for the foreign-born population - Other Eastern Africa (%)
Place of birth for the foreign-born population - Cameroon (%)
Place of birth for the foreign-born population - Congo (%)
Place of birth for the foreign-born population - Democratic Republic of Congo (Zaire) (%)
Place of birth for the foreign-born population - Other Middle Africa (%)
Place of birth for the foreign-born population - Egypt (%)
Place of birth for the foreign-born population - Morocco (%)
Place of birth for the foreign-born population - Sudan (%)
Place of birth for the foreign-born population - Other Northern Africa (%)
Place of birth for the foreign-born population - South Africa (%)
Place of birth for the foreign-born population - Other Southern Africa (%)
Place of birth for the foreign-born population - Cabo Verde (%)
Place of birth for the foreign-born population - Ghana (%)
Place of birth for the foreign-born population - Liberia (%)
Place of birth for the foreign-born population - Nigeria (%)
Place of birth for the foreign-born population - Senegal (%)
Place of birth for the foreign-born population - Sierra Leone (%)
Place of birth for the foreign-born population - Other Western Africa (%)
Place of birth for the foreign-born population - Australia (%)
Place of birth for the foreign-born population - New Zealand (%)
Place of birth for the foreign-born population - Fiji (%)
Place of birth for the foreign-born population - Micronesia (%)
Place of birth for the foreign-born population - Bahamas (%)
Place of birth for the foreign-born population - Barbados (%)
Place of birth for the foreign-born population - Cuba (%)
Place of birth for the foreign-born population - Dominica (%)
Place of birth for the foreign-born population - Dominican Republic (%)
Place of birth for the foreign-born population - Grenada (%)
Place of birth for the foreign-born population - Haiti (%)
Place of birth for the foreign-born population - Jamaica (%)
Place of birth for the foreign-born population - St. Vincent and the Grenadines (%)
Place of birth for the foreign-born population - Trinidad and Tobago (%)
Place of birth for the foreign-born population - West Indies (%)
Place of birth for the foreign-born population - Other Caribbean (%)
Place of birth for the foreign-born population - Belize (%)
Place of birth for the foreign-born population - Costa Rica (%)
Place of birth for the foreign-born population - El Salvador (%)
Place of birth for the foreign-born population - Guatemala (%)
Place of birth for the foreign-born population - Honduras (%)
Place of birth for the foreign-born population - Mexico (%)
Place of birth for the foreign-born population - Nicaragua (%)
Place of birth for the foreign-born population - Panama (%)
Place of birth for the foreign-born population - Other Central America (%)
Place of birth for the foreign-born population - Argentina (%)
Place of birth for the foreign-born population - Bolivia (%)
Place of birth for the foreign-born population - Brazil (%)
Place of birth for the foreign-born population - Chile (%)
Place of birth for the foreign-born population - Colombia (%)
Place of birth for the foreign-born population - Ecuador (%)
Place of birth for the foreign-born population - Guyana (%)
Place of birth for the foreign-born population - Peru (%)
Place of birth for the foreign-born population - Uruguay (%)
Place of birth for the foreign-born population - Venezuela (%)
Place of birth for the foreign-born population - Other South America (%)
Place of birth for the foreign-born population - Canada (%)
Place of birth for the foreign-born population - Other Northern America (%)
Place of birth for the foreign-born population - Other (%)
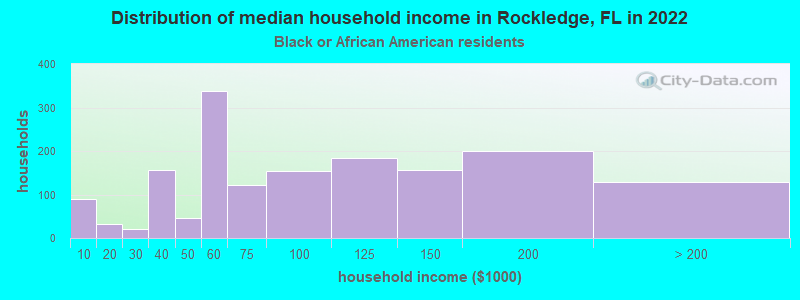
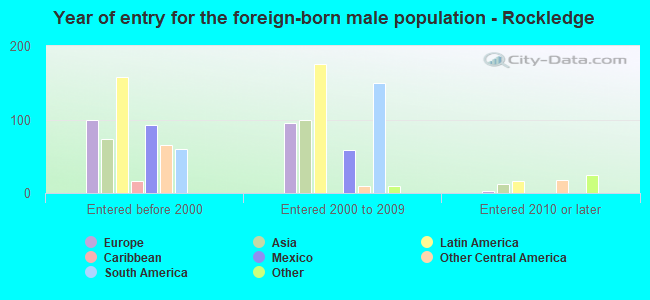
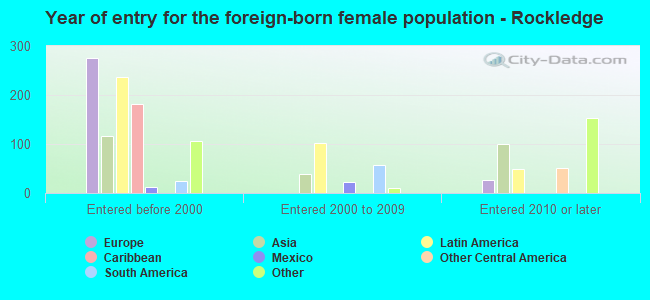
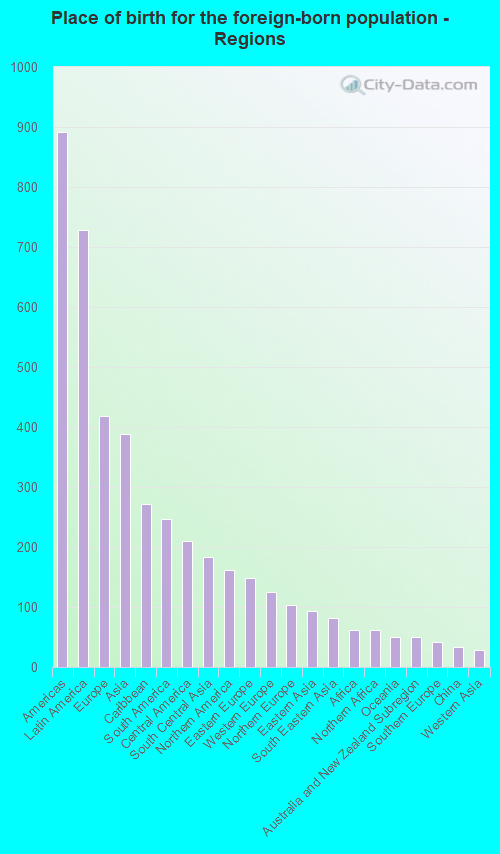
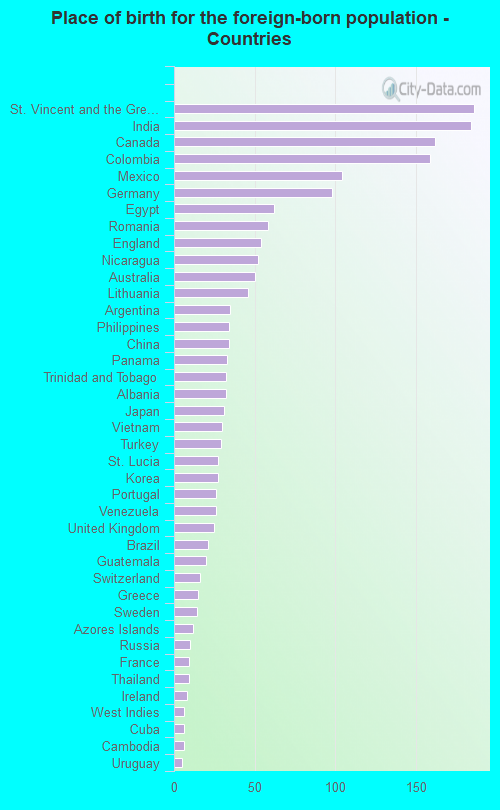
According to 2022 data, the most numerous races in Rockledge, FL are White alone (19,771 residents), Hispanic (3,157 residents), and Black alone (3,734 residents). 90.7% of Rockledge residents speak English at home. 6.3% of Rockledge, FL residents are foreign-born (2.5% born in Latin America, 1.4% born in Europe, 1.3% born in Asia), which is 232.8% less than the foreign-born rate of 21.0% across the entire state of Florida.
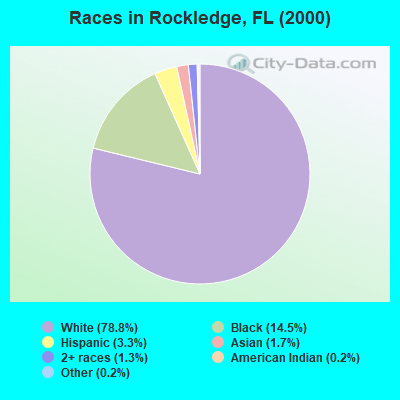
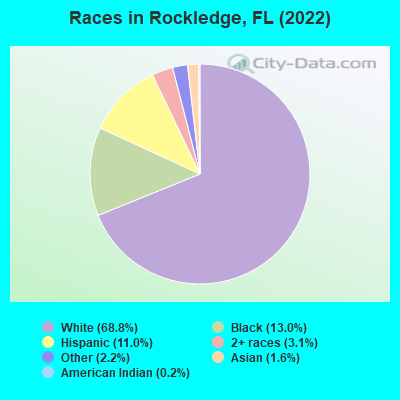
Race distribution in Rockledge
2000 2022
10,458,509 65.4% White alone 2,682,715 16.8% Hispanic 2,264,268 14.2% Black alone 261,693 1.6% Asian alone 236,954 1.5% Two or more races 42,358 0.3% American Indian alone 28,994 0.2% Other race alone 6,887 0.04% Native Hawaiian and Other
11,309,403 50.8% White alone 6,025,039 27.1% Hispanic 3,241,015 14.6% Black alone 861,630 3.9% Two or more races 623,692 2.8% Asian alone 152,054 0.7% Other race alone 22,504 0.1% American Indian alone 9,486 0.04% Native Hawaiian and Other
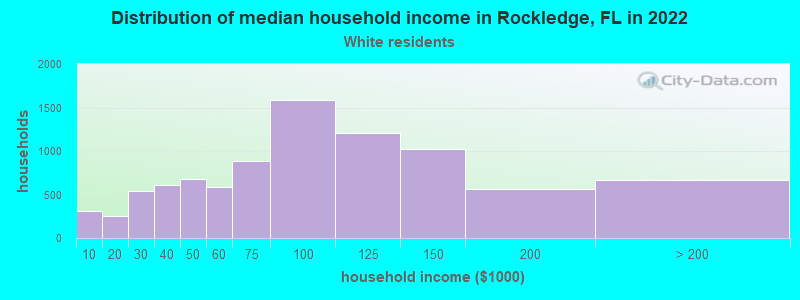
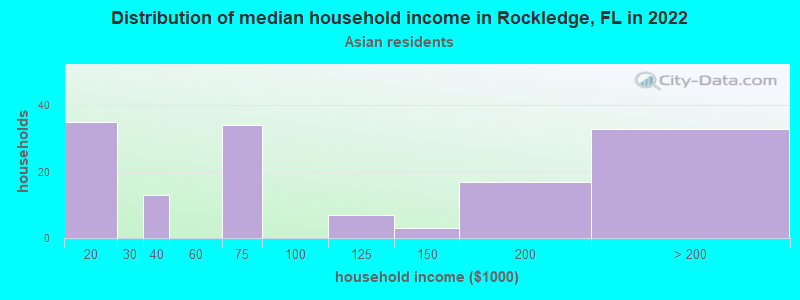
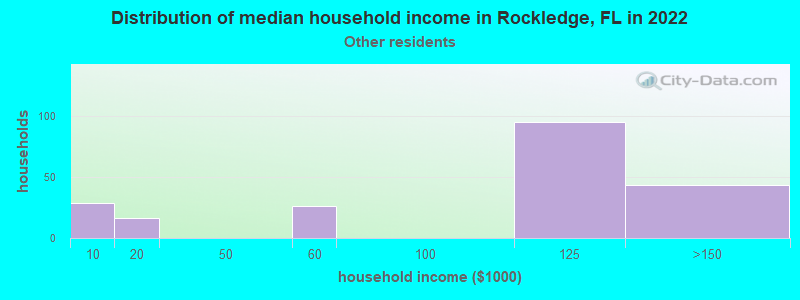
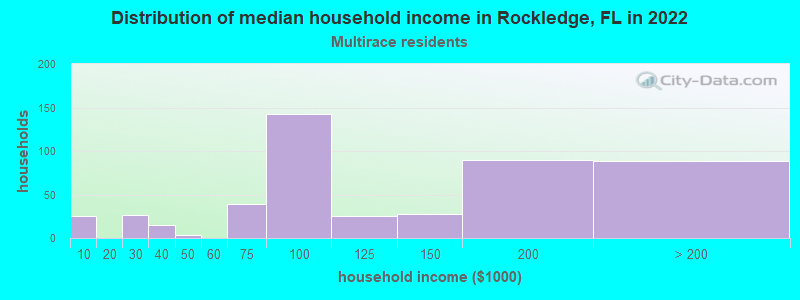
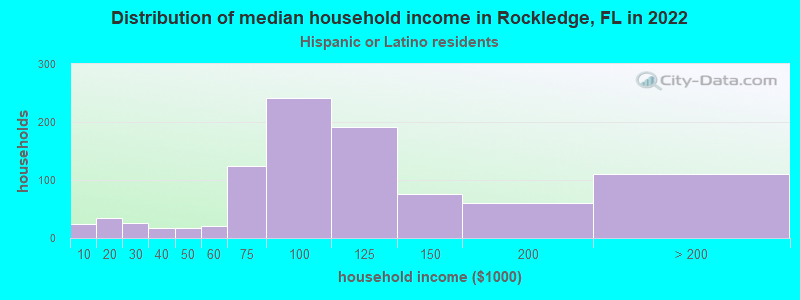
Income and house value in Rockledge Median household income in 2022 $82,404 White non-Hispanic householders$88,290 Black householders$88,435 Asian householders$112,529 Two or more races householders$104,675 Hispanic or Latino race householdersMedian 2022 house value $362,337 White Non-Hispanic householders$319,802 Black or African American householders$475,764 American Indian or Alaska Native householders $322,952 Asian householders$443,075 Some other race householders$352,097 Two or more races householders$372,971 Hispanic or Latino householders
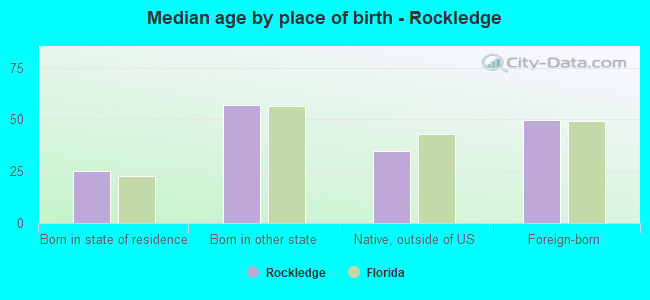
Median age by race in Rockledge
49.4 Median age for White residents48.0 50.7 43.8 Median age for Black or African American residents43.4 43.6 32.6 Median age for American Indian / Alaska Native residents-611,418,047.3 -594,925,633.7 53.5 Median age for Asian residents52.6 54.5 -679,849,340.2 Median age for Native Hawaiian / Pacific Islander residents-858,307,848.3 -443,298,968.6 21.8 Median age for Other race residents24.9 39.8 36.6 Median age for Two or more races residents27.1 51.5 51.2 Median age for White alone residents49.6 52.3 28.3 Median age for Hispanic or Latino residents30.5 27.1
Owner/renter occupied households by race in Rockledge
House owners and renters - White residents 7,349 82.3% Owner occupied1,577 17.7% Renter occupiedHouse owners and renters - Black or African American residents 1,039 72.6% Owner occupied391 27.4% Renter occupiedHouse owners and renters - Asian residents 122 87.1% Owner occupied18 12.9% Renter occupiedHouse owners and renters - Other race residents 61 24.5% Owner occupied188 75.5% Renter occupiedHouse owners and renters - Two or more races residents 398 83.4% Owner occupied79 16.6% Renter occupiedHouse owners and renters - White alone residents 7,120 83.5% Owner occupied1,409 16.5% Renter occupiedHouse owners and renters - Hispanic or Latino residents 604 63.7% Owner occupied344 36.3% Renter occupied
Language usage in Rockledge
English speakers - Total 90.7% of residents of Rockledge speak English at home.
5.7% of residents speak Spanish at home 1,253 80.0% Speak English very well314 20.0% Speak English less than very well3.5% of residents speak other language at home 713 75.7% Speak English very well229 24.3% Speak English less than very well
English speakers - Born in the United States 95.7% of residents of Rockledge speak English at home.
2.6% of residents speak Spanish at home 301 79.4% Speak English very well78 20.6% Speak English less than very well1.4% of residents speak other language at home 182 87.1% Speak English very well27 12.9% Speak English less than very well
English speakers - Native, born elsewhere 54.4% of residents of Rockledge speak English at home.
44.2% of residents speak Spanish at home 387 92.8% Speak English very well30 7.2% Speak English less than very well0.7% of residents speak other language at home 7 100.0% Speak English very well
English speakers - Foreign-born 39.5% of residents of Rockledge speak English at home.
25.9% of residents speak Spanish at home 341 67.9% Speak English very well161 32.1% Speak English less than very well32.9% of residents speak other language at home 453 71.1% Speak English very well184 28.9% Speak English less than very well
White (Caucasian) - Speak only English Native:
96.7% (18,721)Foreign-born:
57.2% (392)
White (Caucasian) - Speak another language Native:
3.1% (595)Foreign-born:
44.3% (304)
Black or African American - Speak only English Native:
99.1% (3,506)Foreign-born:
92.1% (185)
Asian - Speak only English Native:
80.0% (45)Foreign-born:
27.0% (120)
Other race - Speak another language Native:
36.1% (368)Foreign-born:
100.0% (17)
Two or more races - Speak only English Native:
82.3% (915)Foreign-born:
9.1% (51)
Two or more races - Speak another language Native:
17.6% (196)Foreign-born:
87.8% (490)
White alone - Speak only English Native:
98.1% (17,743)Foreign-born:
54.2% (381)
White alone - Speak another language Native:
1.7% (307)Foreign-born:
45.7% (321)
Hispanic or Latino - Speak only English Native:
60.6% (1,446)Foreign-born:
6.2% (33)
Hispanic or Latino - Speak another language Native:
39.7% (947)Foreign-born:
94.2% (498)
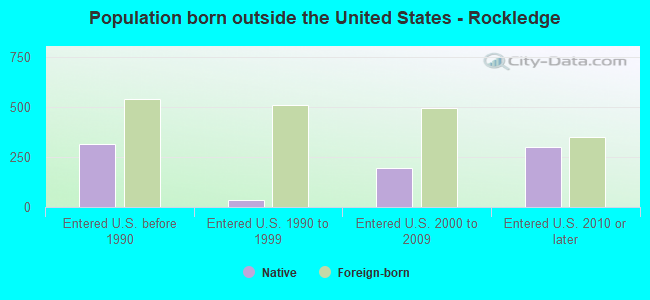
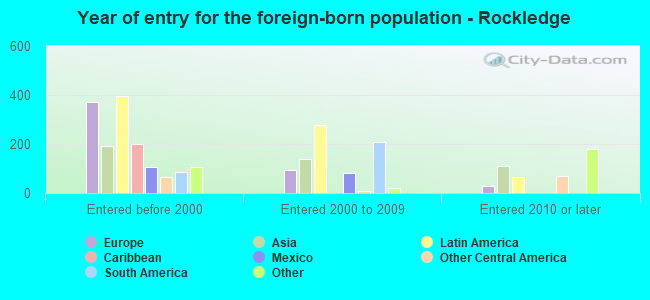
Foreign-born residents in Rockledge 1,812 residents are foreign born (2.5% Latin America , 1.4% Europe , 1.3% Asia ).
This city:
6.3%Florida:
21.1%
Marital status for residents in Rockledge Marital status - White (Caucasian) population 15 years and over
Males 27.3% Never married54.9% Now married1.6% Separated4.1% Widowed12.0% DivorcedFemales 24.8% Never married43.6% Now married1.5% Separated11.2% Widowed19.0% DivorcedWomen who gave birth in the past 12 months Now married:
36.1% (126)Unmarried:
63.9% (224)
Women who did not give birth in the past 12 months Now married:
42.5% (1,707)Unmarried:
57.5% (2,313)
Marital status - Black or African American population 15 years and over
Males 25.7% Never married51.4% Now married0.0% Separated4.6% Widowed18.3% DivorcedFemales 31.7% Never married52.2% Now married3.9% Separated2.2% Widowed10.0% DivorcedWomen who gave birth in the past 12 months Now married:
100.0% (80)Unmarried:
0.0% (0)
Women who did not give birth in the past 12 months Now married:
32.8% (248)Unmarried:
67.2% (508)
Marital status - American Indian / Alaska Native population 15 years and over
Males 0.0% Never married100.0% Now married0.0% Separated0.0% Widowed0.0% DivorcedFemales 0.0% Never married100.0% Now married0.0% Separated0.0% Widowed0.0% DivorcedMarital status - Asian population 15 years and over
Males 6.0% Never married80.0% Now married0.0% Separated10.7% Widowed3.3% DivorcedFemales 7.4% Never married73.1% Now married0.0% Separated6.0% Widowed13.4% DivorcedWomen who gave birth in the past 12 months Now married:
100.0% (16)Unmarried:
0.0% (0)
Women who did not give birth in the past 12 months Now married:
82.6% (114)Unmarried:
17.4% (24)
Marital status - Other race population 15 years and over
Males 80.5% Never married19.5% Now married0.0% Separated0.0% Widowed0.0% DivorcedFemales 15.9% Never married84.1% Now married0.0% Separated0.0% Widowed0.0% DivorcedWomen who gave birth in the past 12 months Now married:
100.0% (10)Unmarried:
0.0% (0)
Women who did not give birth in the past 12 months Now married:
80.0% (109)Unmarried:
20.0% (27)
Marital status - Two or more races population 15 years and over
Males 36.2% Never married46.8% Now married0.0% Separated0.0% Widowed17.0% DivorcedFemales 25.7% Never married48.6% Now married0.0% Separated8.7% Widowed17.1% DivorcedWomen who did not give birth in the past 12 months Now married:
49.5% (154)Unmarried:
50.5% (157)
Marital status - White alone, not Hispanic / Latino population 15 years and over
Males 26.7% Never married55.1% Now married1.7% Separated4.1% Widowed12.4% DivorcedFemales 22.1% Never married45.7% Now married1.4% Separated12.1% Widowed18.8% DivorcedWomen who gave birth in the past 12 months Now married:
56.5% (121)Unmarried:
43.5% (93)
Women who did not give birth in the past 12 months Now married:
46.2% (1,676)Unmarried:
53.8% (1,949)
Marital status - Hispanic or Latino population 15 years and over
Males 36.0% Never married52.0% Now married0.0% Separated1.9% Widowed10.1% DivorcedFemales 45.9% Never married34.8% Now married1.5% Separated2.0% Widowed15.8% DivorcedWomen who gave birth in the past 12 months Now married:
23.2% (46)Unmarried:
76.8% (152)
Women who did not give birth in the past 12 months Now married:
31.3% (269)Unmarried:
68.7% (591)
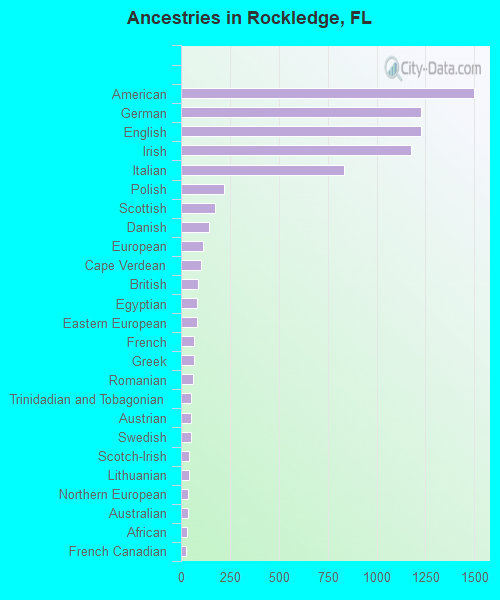
Ancestries in Rockledge
1,500 12.5% American1,228 10.2% German1,225 10.2% English1,174 9.8% Irish832 6.9% Italian218 1.8% Polish173 1.4% Scottish145 1.2% Danish115 1.0% European102 0.9% Cape Verdean86 0.7% British84 0.7% Egyptian81 0.7% Eastern European69 0.6% French68 0.6% Greek60 0.5% Romanian52 0.4% Trinidadian and Tobagonian51 0.4% Austrian51 0.4% Swedish43 0.4% Scotch-Irish39 0.3% Lithuanian38 0.3% Northern European35 0.3% Australian29 0.2% African28 0.2% French Canadian28 0.2% Dutch27 0.2% Russian26 0.2% Portuguese24 0.2% Slavic20 0.2% Croatian18 0.2% Scandinavian16 0.1% Finnish13 0.1% Turkish13 0.1% Iranian10 0.08% Ukrainian9 0.08% Norwegian6 0.05% West Indian3 0.03% Icelander2 0.02% Albanian
Geographical mobility in Rockledge Same house 1 year ago 18,365 88.3% White (Caucasian)3,611 94.3% Black or African American95 100.0% American Indian / Alaska Native424 89.4% Asian1,115 98.2% Other race1,551 88.6% Two or more races17,203 88.2% White alone, not Hispanic / Latino2,846 92.1% Hispanic or LatinoMoved within same county 1,323 6.4% White / Caucasian173 4.5% Black or African American5 1.0% Asian133 7.6% Two or more races1,201 6.2% White alone, not Hispanic / Latino218 7.0% Hispanic or LatinoMoved within same state 437 2.1% White / Caucasian158 4.1% Black or African American25 5.3% Asian6 0.5% Other race454 2.3% White alone, not Hispanic / LatinoMoved from different state 439 2.1% White / Caucasian26 5.4% Asian108 9.6% Other race86 4.9% Two or more races426 2.2% White alone, not Hispanic / Latino52 1.7% Hispanic or LatinoMoved from abroad 169 0.8% White220 1.1% White alone, not Hispanic / Latino
Children Nativity (place of birth) in Rockledge
Children under 6 years - Living with two parents Both parents native 896 100.0% NativeBoth parents foreign-born 7 100.0% NativeOne native, one foreign-born parent 120 100.0% NativeChildren under 6 years - Living with one parent Native parent 589 100.0% NativeChildren 6 to 17 years - Living with two parents Both parents native 1,670 100.0% NativeBoth parents foreign-born 125 88.2% Native17 11.8% Foreign-bornOne native, one foreign-born parent 124 100.0% NativeChildren 6 to 17 years - Living with one parent Native parent 996 100.0% NativeForeign-born parent 47 52.7% Native42 47.3% Foreign-born
Grandparents responsible for own grandchildren in Rockledge
Grandparents (30 to 59 years) White / Caucasian 71 33.0% Responsible for grandchildren143 67.0% Not responsible for grandchildrenBlack or African American 34 100.0% Not responsible for grandchildrenWhite alone, not Hispanic / Latino 54 32.0% Responsible for grandchildren114 68.0% Not responsible for grandchildrenHispanic or Latino 52 100.0% Not responsible for grandchildrenGrandparents (60 years and over) White / Caucasian 26 20.7% Responsible for grandchildren98 79.3% Not responsible for grandchildrenBlack or African American 9 100.0% Not responsible for grandchildrenWhite alone, not Hispanic / Latino 23 21.4% Responsible for grandchildren84 78.6% Not responsible for grandchildren