Races in Rocky Hill, Connecticut (CT) Detailed Stats
Ancestries, Foreign-born residents, place of birth

Discuss Rocky Hill, Connecticut races on our local forum with over 2,400,000 registered users
12.2% of Rocky Hill, CT residents are foreign-born (7.1% born in Europe, 3.2% born in Asia), which is 22.7% less than the foreign-born rate of 15.0% across the entire state of Connecticut.
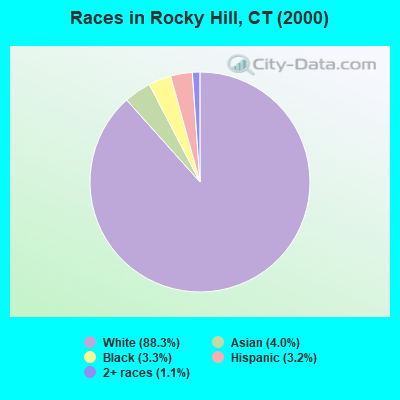
Race distribution in Rocky Hill

- 15,86588.3%White alone
- 7114.0%Asian alone
- 6013.3%Black alone
- 5753.2%Hispanic
- 1891.1%Two or more races
- 110.06%American Indian alone
- 90.05%Other race alone
- 50.03%Native Hawaiian and Other
Pacific Islander alone
2000
2022
-
- 2,638,84577.5%White alone
- 320,3239.4%Hispanic
- 295,5718.7%Black alone
- 81,5642.4%Asian alone
- 52,8961.6%Two or more races
- 8,1410.2%Other race alone
- 7,2670.2%American Indian alone
- 9580.03%Native Hawaiian and Other
Pacific Islander alone

-
- 2,246,91362.0%White alone
- 658,97818.2%Hispanic
- 353,9739.8%Black alone
- 172,9294.8%Asian alone
- 159,6314.4%Two or more races
- 29,7610.8%Other race alone
- 3,4280.09%American Indian alone
- 5920.02%Native Hawaiian and Other
Pacific Islander alone

Income and house value in Rocky Hill
- Median household income in 2022
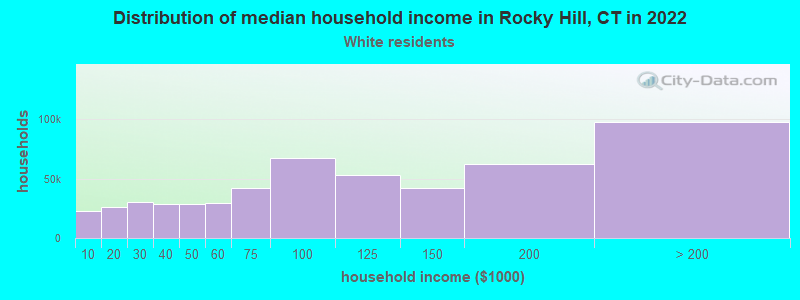
- $100,693White non-Hispanic householders
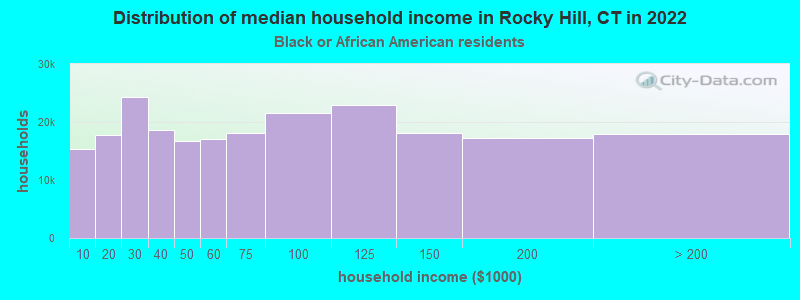
- $99,657Black householders
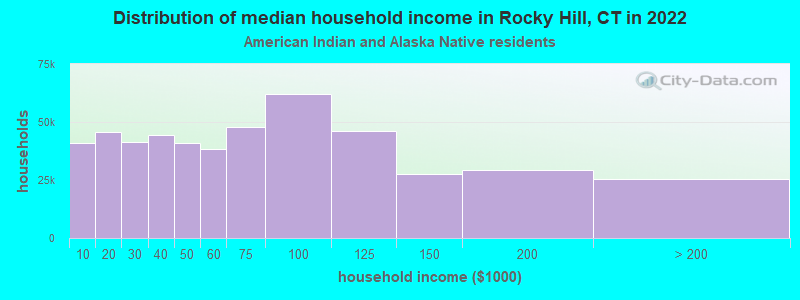
- $16,324American Indian and Alaska Native householders
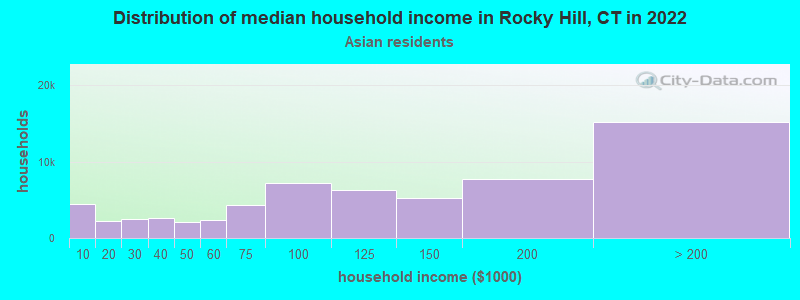
- $111,916Asian householders
- $103,828Some other race householders
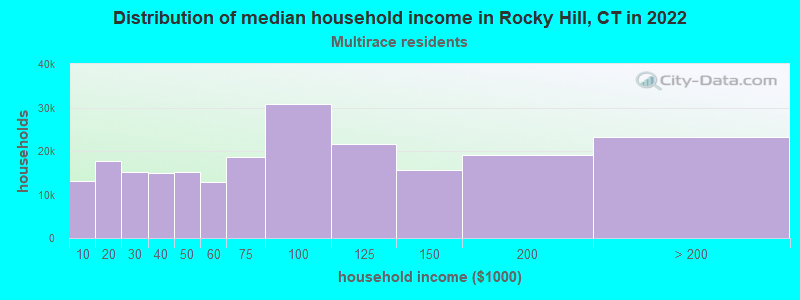
- $131,446Two or more races householders
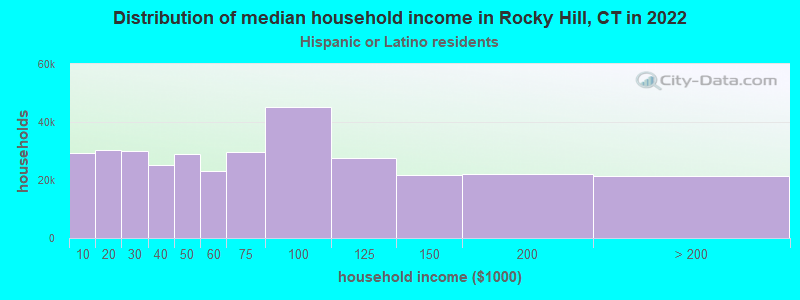
- $92,179Hispanic or Latino race householders
- Median 2022 house value
- $358,658White Non-Hispanic householders
- $326,445Black or African American householders
- $569,010Asian householders
- $150,035Some other race householders
- $205,379Two or more races householders
- $293,801Hispanic or Latino householders
Household income for White non-Hispanic householders
Household income for Black householders
Household income for American Indian and Alaska Native householders
Household income for Asian householders
Household income for Two or more races householders
Household income for Hispanic or Latino race householders
Foreign-born residents in Rocky Hill
2,197 residents are foreign born (7.1% Europe, 3.2% Asia).
| This city: | 12.2% |
| Connecticut: | 10.9% |
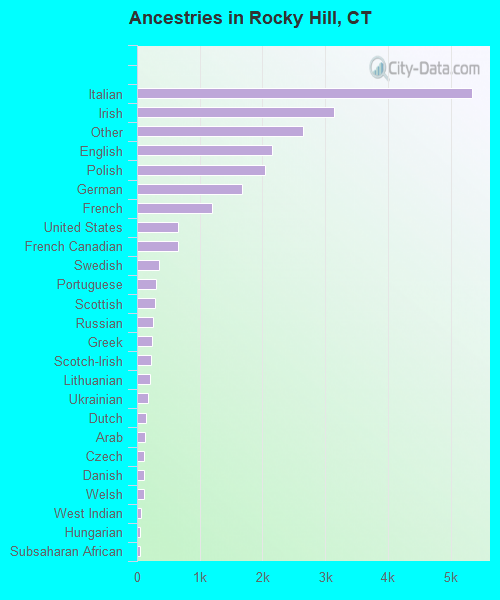
Ancestries in Rocky Hill

- 5,34423.8%Italian
- 3,13714.0%Irish
- 2,64611.8%Other
- 2,1539.6%English
- 2,0409.1%Polish
- 1,6777.5%German
- 1,2015.4%French
- 6602.9%United States
- 6462.9%French Canadian
- 3481.6%Swedish
- 3091.4%Portuguese
- 2821.3%Scottish
- 2601.2%Russian
- 2451.1%Greek
- 2261.0%Scotch-Irish
- 2010.9%Lithuanian
- 1790.8%Ukrainian
- 1370.6%Dutch
- 1230.5%Arab
- 1170.5%Czech
- 1060.5%Danish
- 1050.5%Welsh
- 710.3%West Indian
- 540.2%Hungarian
- 540.2%Subsaharan African
- 490.2%Swiss
- 390.2%Norwegian
- 210.09%Slovak
Zip codes: 06067.