Races in Roseland, California (CA) Detailed Stats
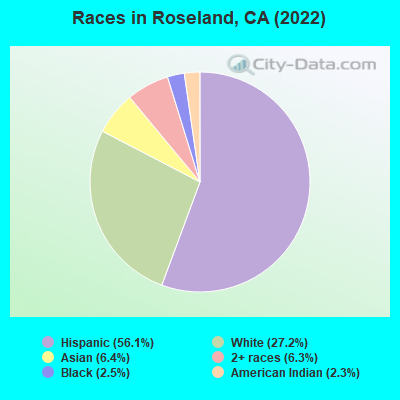
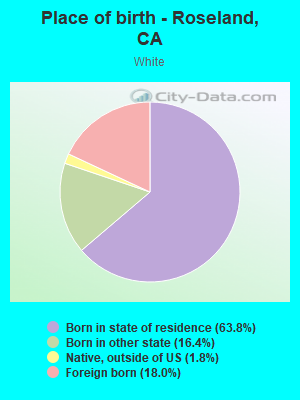
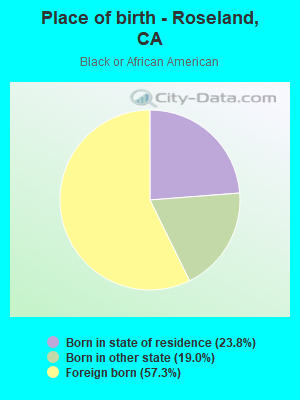
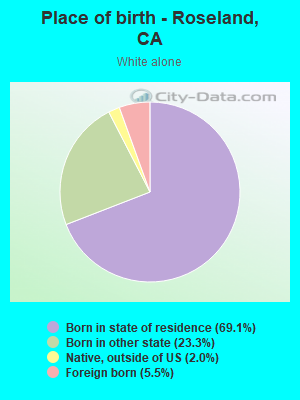
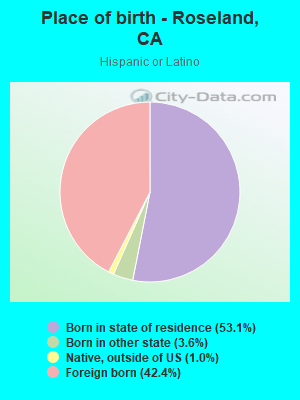
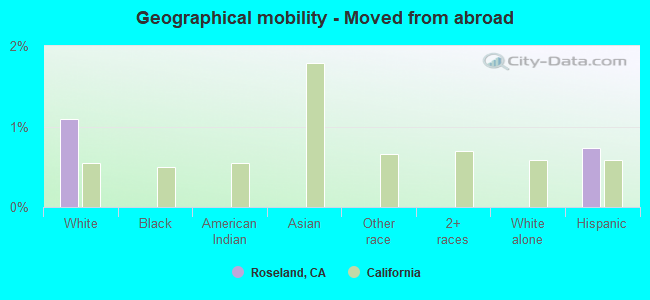
According to 2022 data, the most numerous races in Roseland, CA are Hispanic (3,286 residents), White alone (1,592 residents), and Asian alone (372 residents). 46.0% of Roseland residents speak English at home. 32.4% of Roseland, CA residents are foreign-born (25.9% born in Latin America, 4.8% born in Asia), which is 19.7% greater than the foreign-born rate of 26.0% across the entire state of California.
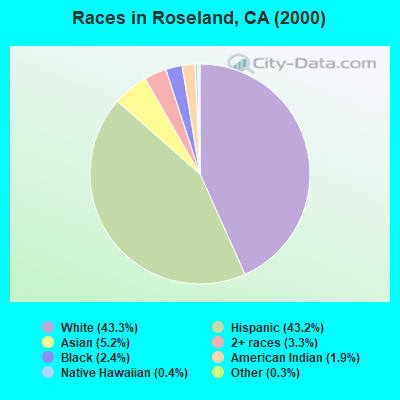
Race distribution in Roseland
2000 2022
15,816,790 46.7% White alone 10,966,556 32.4% Hispanic 3,648,860 10.8% Asian alone 2,181,926 6.4% Black alone 903,115 2.7% Two or more races 178,984 0.5% American Indian alone 103,736 0.3% Native Hawaiian and Other 71,681 0.2% Other race alone
15,732,184 40.3% Hispanic 13,160,426 33.7% White alone 5,957,867 15.3% Asian alone 2,025,218 5.2% Black alone 1,663,222 4.3% Two or more races 251,618 0.6% Other race alone 135,777 0.3% Native Hawaiian and Other 103,030 0.3% American Indian alone
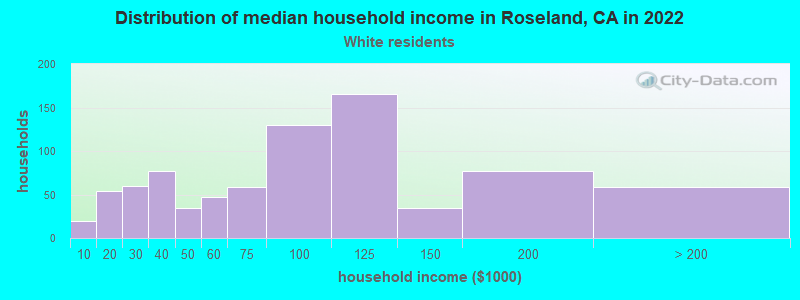
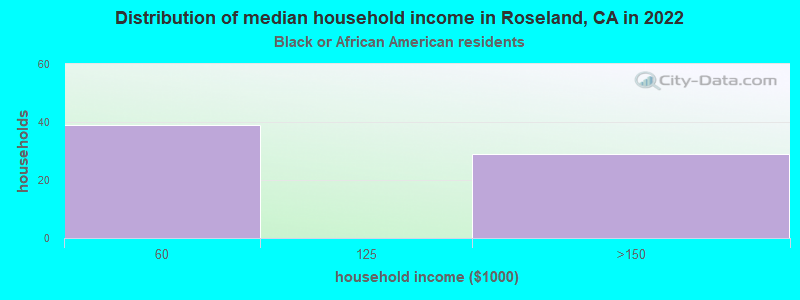
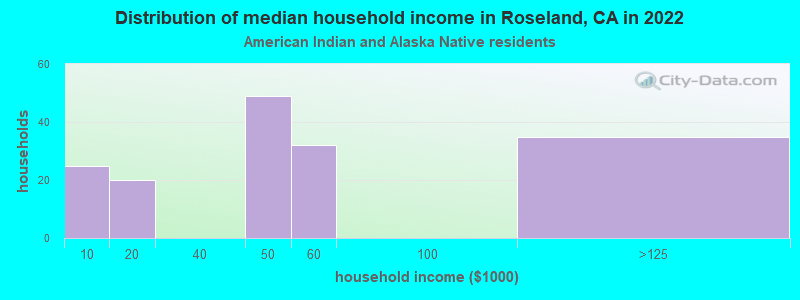
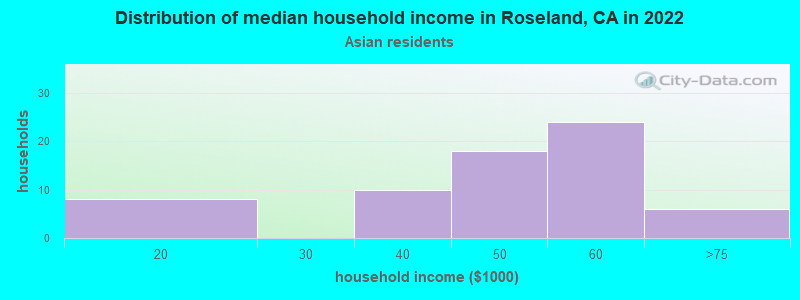
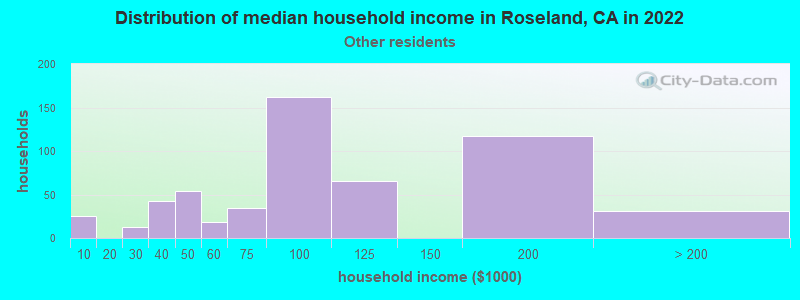
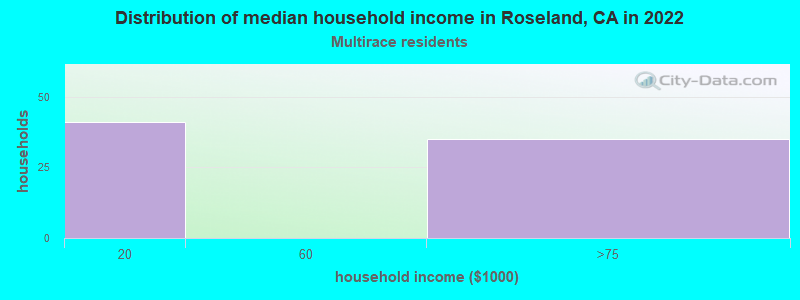
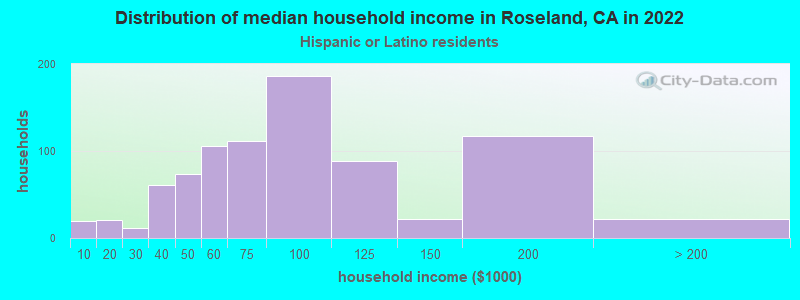
Income and house value in Roseland Median household income in 2022 $84,089 White non-Hispanic householders$75,671 Black householders$110,305 American Indian and Alaska Native householders$63,977 Asian householders$46,935 Native Hawaiian and other Pacific Islander householders$121,373 Some other race householders$39,837 Two or more races householders$102,813 Hispanic or Latino race householdersMedian 2022 house value $670,548 White Non-Hispanic householders$635,635 Black or African American householders$404,920 American Indian or Alaska Native householders $503,181 Asian householders$737,855 Some other race householders$494,903 Two or more races householders$743,254 Hispanic or Latino householders
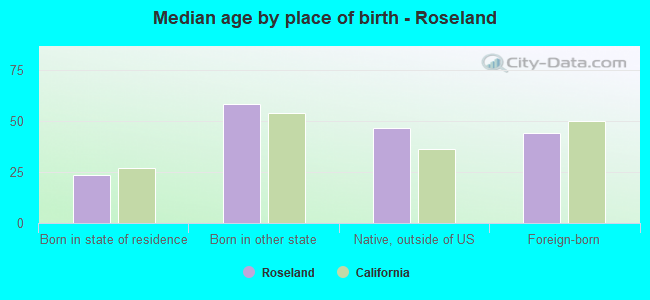
Median age by race in Roseland
45.6 Median age for White residents42.7 50.1 27.8 Median age for Black or African American residents27.8 16.8 45.7 Median age for American Indian / Alaska Native residents49.5 25.5 41.6 Median age for Asian residents32.7 46.3 28.6 Median age for Other race residents29.2 29.0 25.6 Median age for Two or more races residents14.7 30.5 53.0 Median age for White alone residents45.0 58.3 31.8 Median age for Hispanic or Latino residents32.8 29.0
Owner/renter occupied households by race in Roseland
House owners and renters - White residents 757 81.4% Owner occupied173 18.6% Renter occupiedHouse owners and renters - Black or African American residents 33 59.1% Owner occupied23 40.9% Renter occupiedHouse owners and renters - American Indian / Alaska Native residents 61 33.7% Owner occupied120 66.3% Renter occupiedHouse owners and renters - Asian residents 78 82.2% Owner occupied17 17.8% Renter occupiedHouse owners and renters - Other race residents 162 34.4% Owner occupied308 65.6% Renter occupiedHouse owners and renters - Two or more races residents 82 100.0% Renter occupiedHouse owners and renters - White alone residents 654 83.4% Owner occupied130 16.6% Renter occupiedHouse owners and renters - Hispanic or Latino residents 338 41.8% Owner occupied471 58.2% Renter occupied
Language usage in Roseland
English speakers - Total 46.0% of residents of Roseland speak English at home.
46.0% of residents speak Spanish at home 1,219 48.4% Speak English very well1,300 51.6% Speak English less than very well6.0% of residents speak other language at home 158 48.3% Speak English very well169 51.7% Speak English less than very well
English speakers - Born in the United States 92.3% of residents of Roseland speak English at home.
7.2% of residents speak Spanish at home 40 100.0% Speak English very well
English speakers - Native, born elsewhere 71.6% of residents of Roseland speak English at home.
29.9% of residents speak Spanish at home 8 40.0% Speak English very well12 60.0% Speak English less than very well
English speakers - Foreign-born 7.1% of residents of Roseland speak English at home.
70.8% of residents speak Spanish at home 290 22.0% Speak English very well1,031 78.0% Speak English less than very well15.7% of residents speak other language at home 125 42.7% Speak English very well168 57.3% Speak English less than very well
White (Caucasian) - Speak only English Native:
81.3% (1,419)Foreign-born:
13.2% (53)
White (Caucasian) - Speak another language Native:
18.2% (318)Foreign-born:
79.5% (317)
Black or African American - Speak another language Native:
21.5% (27)Foreign-born:
95.8% (167)
American Indian / Alaska Native - Speak another language Native:
48.2% (134)Foreign-born:
98.1% (264)
Asian - Speak only English Native:
90.0% (70)Foreign-born:
23.2% (63)
Other race - Speak another language Native:
73.1% (831)Foreign-born:
96.3% (795)
Two or more races - Speak another language Native:
8.5% (62)Foreign-born:
100.0% (124)
White alone - Speak only English Native:
97.2% (1,400)Foreign-born:
22.9% (20)
White alone - Speak another language Native:
2.7% (38)Foreign-born:
71.3% (62)
Hispanic or Latino - Speak only English Native:
22.0% (352)Foreign-born:
3.8% (52)
Hispanic or Latino - Speak another language Native:
76.6% (1,228)Foreign-born:
95.3% (1,305)
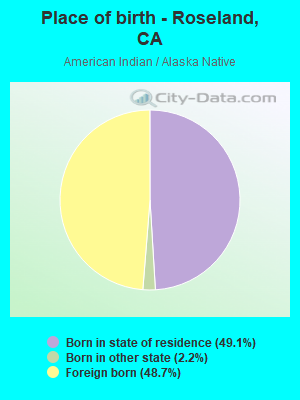
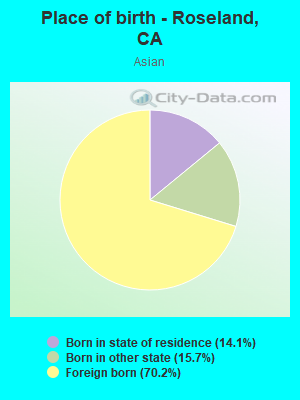
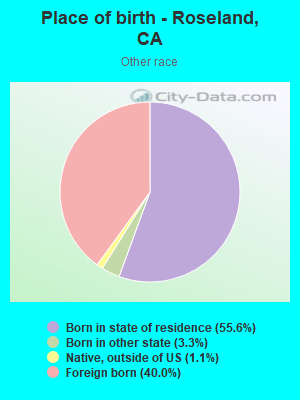
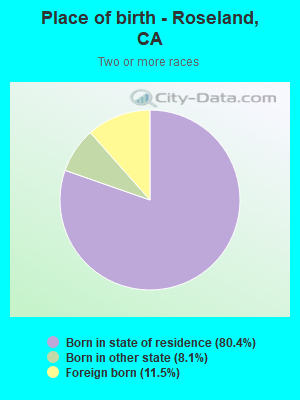
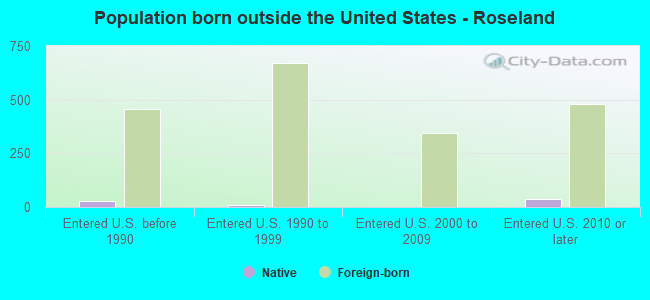
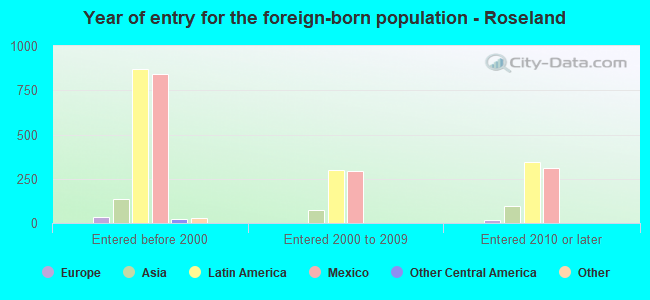
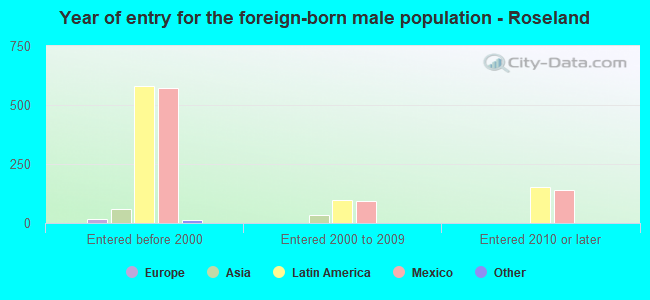
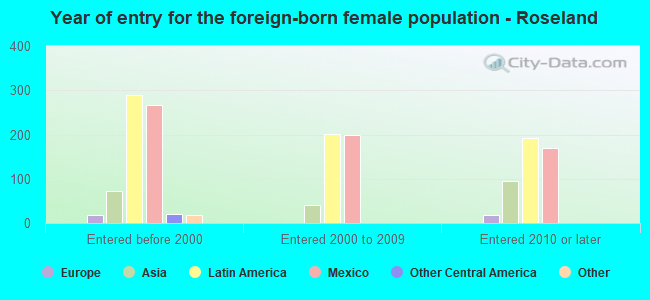
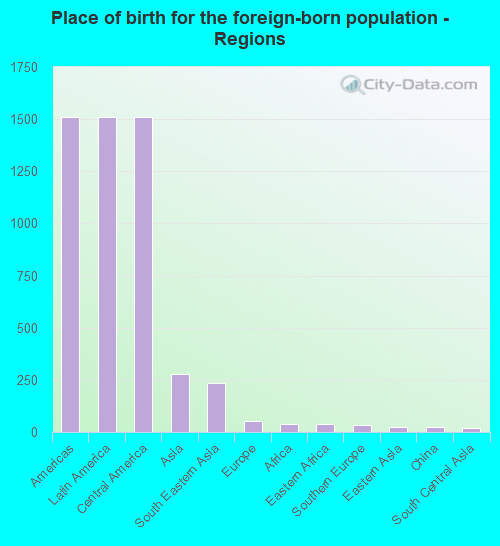
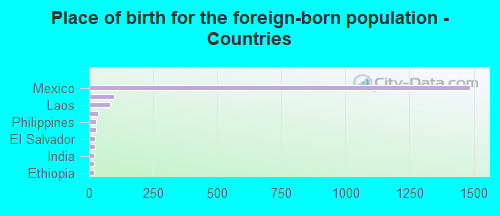
Foreign-born residents in Roseland 1,880 residents are foreign born (25.9% Latin America , 4.8% Asia ).
This city:
32.4%California:
100.0%
Marital status for residents in Roseland Marital status - White (Caucasian) population 15 years and over
Males 41.7% Never married46.8% Now married0.0% Separated1.3% Widowed10.3% DivorcedFemales 31.9% Never married41.7% Now married1.7% Separated5.3% Widowed19.3% DivorcedWomen who gave birth in the past 12 months Now married:
61.2% (22)Unmarried:
38.8% (14)
Women who did not give birth in the past 12 months Now married:
38.6% (181)Unmarried:
61.4% (288)
Marital status - Black or African American population 15 years and over
Males 62.7% Never married37.3% Now married0.0% Separated0.0% Widowed0.0% DivorcedFemales 43.0% Never married57.0% Now married0.0% Separated0.0% Widowed0.0% DivorcedWomen who gave birth in the past 12 months Now married:
61.1% (10)Unmarried:
38.9% (7)
Women who did not give birth in the past 12 months Now married:
55.7% (32)Unmarried:
44.3% (25)
Marital status - American Indian / Alaska Native population 15 years and over
Males 0.0% Never married73.1% Now married26.9% Separated0.0% Widowed0.0% DivorcedFemales 44.5% Never married33.6% Now married10.9% Separated3.9% Widowed7.0% DivorcedWomen who did not give birth in the past 12 months Now married:
43.0% (63)Unmarried:
57.0% (83)
Marital status - Asian population 15 years and over
Males 54.0% Never married34.5% Now married0.0% Separated0.0% Widowed11.5% DivorcedFemales 20.8% Never married34.9% Now married0.0% Separated37.6% Widowed6.7% DivorcedWomen who gave birth in the past 12 months Now married:
100.0% (21)Unmarried:
0.0% (0)
Women who did not give birth in the past 12 months Now married:
33.3% (21)Unmarried:
66.7% (43)
Marital status - Other race population 15 years and over
Males 30.9% Never married57.5% Now married0.0% Separated0.0% Widowed11.6% DivorcedFemales 33.0% Never married61.6% Now married0.0% Separated0.0% Widowed5.5% DivorcedWomen who gave birth in the past 12 months Now married:
100.0% (24)Unmarried:
0.0% (0)
Women who did not give birth in the past 12 months Now married:
53.6% (249)Unmarried:
46.4% (216)
Marital status - Two or more races population 15 years and over
Males 72.5% Never married0.0% Now married17.5% Separated0.0% Widowed10.0% DivorcedFemales 78.0% Never married22.0% Now married0.0% Separated0.0% Widowed0.0% DivorcedWomen who did not give birth in the past 12 months Now married:
22.0% (65)Unmarried:
78.0% (232)
Marital status - White alone, not Hispanic / Latino population 15 years and over
Males 43.6% Never married38.6% Now married0.0% Separated2.1% Widowed15.6% DivorcedFemales 30.5% Never married33.6% Now married0.8% Separated7.3% Widowed27.8% DivorcedWomen who did not give birth in the past 12 months Now married:
34.1% (101)Unmarried:
65.9% (195)
Marital status - Hispanic or Latino population 15 years and over
Males 36.7% Never married53.3% Now married4.1% Separated0.0% Widowed5.8% DivorcedFemales 35.8% Never married58.1% Now married1.6% Separated0.7% Widowed3.8% DivorcedWomen who gave birth in the past 12 months Now married:
72.1% (52)Unmarried:
27.9% (20)
Women who did not give birth in the past 12 months Now married:
49.0% (396)Unmarried:
51.0% (412)
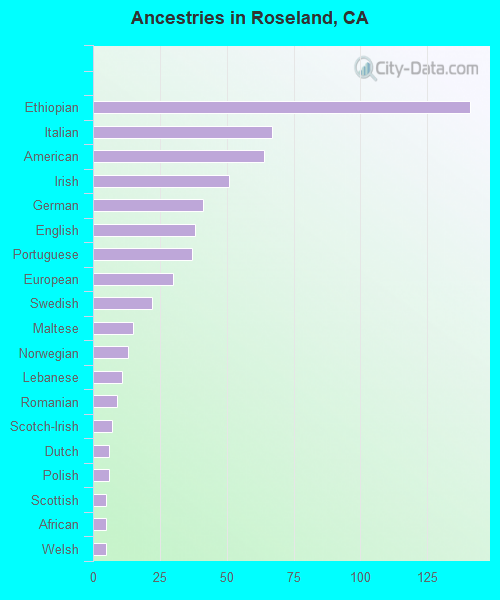
Ancestries in Roseland
141 3.9% Ethiopian67 1.9% Italian64 1.8% American51 1.4% Irish41 1.1% German38 1.1% English37 1.0% Portuguese30 0.8% European22 0.6% Swedish15 0.4% Maltese13 0.4% Norwegian11 0.3% Lebanese9 0.3% Romanian7 0.2% Scotch-Irish6 0.2% Dutch6 0.2% Polish5 0.1% Scottish5 0.1% African5 0.1% Welsh
Children Nativity (place of birth) in Roseland
Children under 6 years - Living with two parents Both parents native 70 100.0% NativeBoth parents foreign-born 235 100.0% NativeChildren under 6 years - Living with one parent Native parent 168 100.0% NativeForeign-born parent 17 100.0% NativeChildren 6 to 17 years - Living with two parents Both parents native 256 100.0% NativeBoth parents foreign-born 444 92.0% Native39 8.0% Foreign-bornOne native, one foreign-born parent 38 100.0% NativeChildren 6 to 17 years - Living with one parent Native parent 69 100.0% NativeForeign-born parent 73 49.6% Native74 50.4% Foreign-born
Grandparents responsible for own grandchildren in Roseland
Grandparents (30 to 59 years) White / Caucasian 9 16.2% Responsible for grandchildren47 83.8% Not responsible for grandchildrenAmerican Indian / Alaska Native 40 100.0% Not responsible for grandchildrenOther race 24 100.0% Not responsible for grandchildrenWhite alone, not Hispanic / Latino 15 100.0% Not responsible for grandchildrenHispanic or Latino 24 27.1% Responsible for grandchildren66 72.9% Not responsible for grandchildrenGrandparents (60 years and over) White / Caucasian 11 20.9% Responsible for grandchildren40 79.1% Not responsible for grandchildrenOther race 52 100.0% Not responsible for grandchildrenWhite alone, not Hispanic / Latino 22 100.0% Not responsible for grandchildrenHispanic or Latino 16 17.8% Responsible for grandchildren73 82.2% Not responsible for grandchildren