Races in Ross Valley, California (CA) Detailed Stats
Ancestries, Foreign-born residents, place of birth
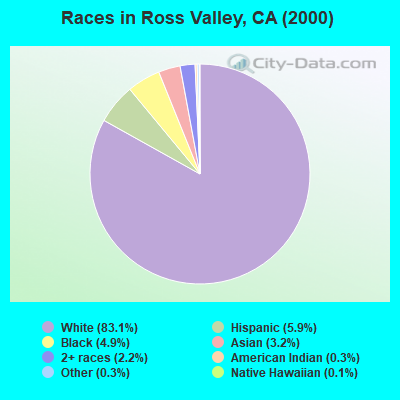
Race distribution in Ross Valley

- 49,57683.1%White alone
- 3,5175.9%Hispanic
- 2,9344.9%Black alone
- 1,8943.2%Asian alone
- 1,2972.2%Two or more races
- 1770.3%Other race alone
- 1950.3%American Indian alone
- 720.1%Native Hawaiian and Other
Pacific Islander alone
2000
2022
-
- 15,816,79046.7%White alone
- 10,966,55632.4%Hispanic
- 3,648,86010.8%Asian alone
- 2,181,9266.4%Black alone
- 903,1152.7%Two or more races
- 178,9840.5%American Indian alone
- 103,7360.3%Native Hawaiian and Other
Pacific Islander alone - 71,6810.2%Other race alone

-
- 15,732,18440.3%Hispanic
- 13,160,42633.7%White alone
- 5,957,86715.3%Asian alone
- 2,025,2185.2%Black alone
- 1,663,2224.3%Two or more races
- 251,6180.6%Other race alone
- 135,7770.3%Native Hawaiian and Other
Pacific Islander alone - 103,0300.3%American Indian alone

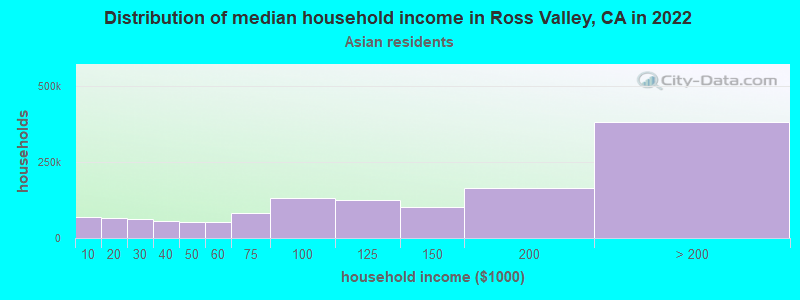
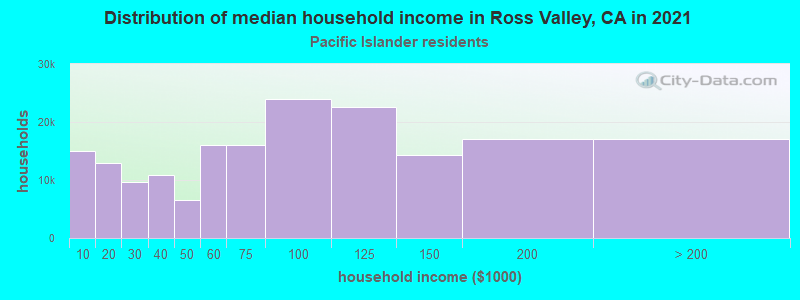
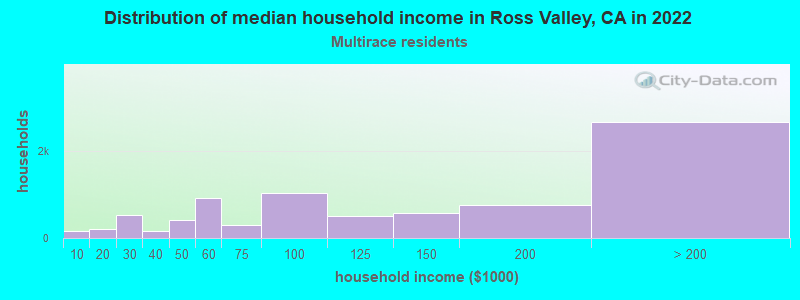
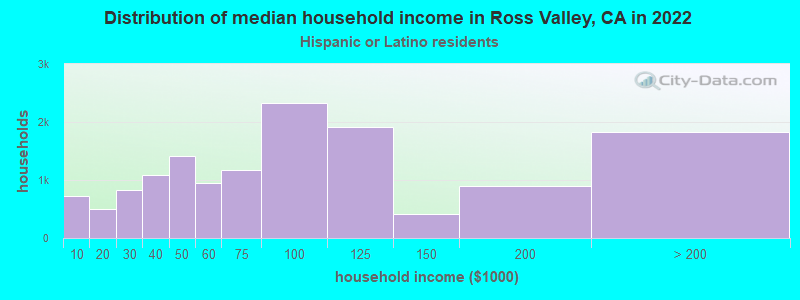
Income and house value in Ross Valley
- Median household income in 2022
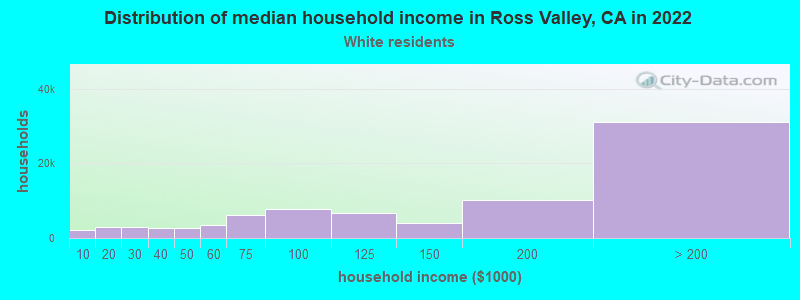
- $143,671White non-Hispanic householders
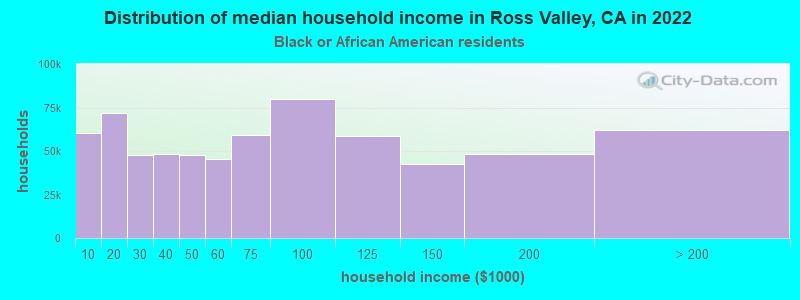
- $104,389Black householders
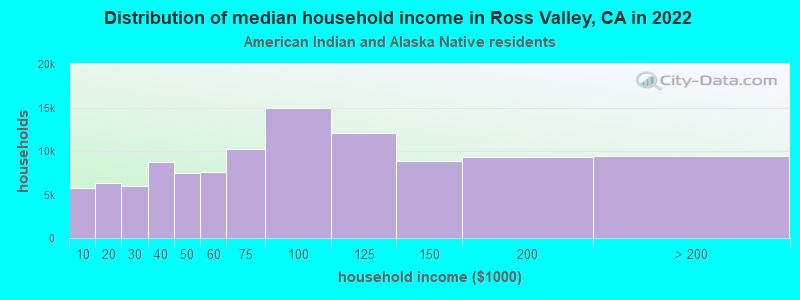
- $102,920American Indian and Alaska Native householders
- $156,194Asian householders
- over $200,000Native Hawaiian and other Pacific Islander householders
- $116,627Some other race householders
- $117,351Two or more races householders
- $144,158Hispanic or Latino race householders
- Median 2022 house value
- over $1,000,000White Non-Hispanic householders
- over $1,000,000Black or African American householders
- over $1,000,000Asian householders
- over $1,000,000Native Hawaiian and other Pacific Islander householders
- over $1,000,000Some other race householders
- over $1,000,000Two or more races householders
- over $1,000,000Hispanic or Latino householders
Household income for White non-Hispanic householders
Household income for Black householders
Household income for American Indian and Alaska Native householders
Household income for Asian householders
Household income for Native Hawaiian and other Pacific Islander householders
Household income for Two or more races householders
Household income for Hispanic or Latino race householders
Zip code: 94904